
全球科研合作网络的动态演化及其驱动机制
|
桂钦昌(1991-), 男, 四川达州人, 博士, 助理研究员, 中国地理学会会员(S110016476M), 研究方向为科技创新与城市发展。E-mail: qcgui@iud.ecnu.edu.cn |
收稿日期: 2022-04-22
修回日期: 2022-11-19
网络出版日期: 2023-02-16
基金资助
国家自然科学基金项目(42201190)
中国博士后基金项目(2022M711152)
国家社会科学基金重大项目(19ZDA087)
The network dynamics and driving mechanisms of global scientific cooperation
Received date: 2022-04-22
Revised date: 2022-11-19
Online published: 2023-02-16
Supported by
National Natural Science Foundation of China(42201190)
China Postdoctoral Science Foundation(2022M711152)
Major Program of National Social Science Foundation of China(19ZDA087)
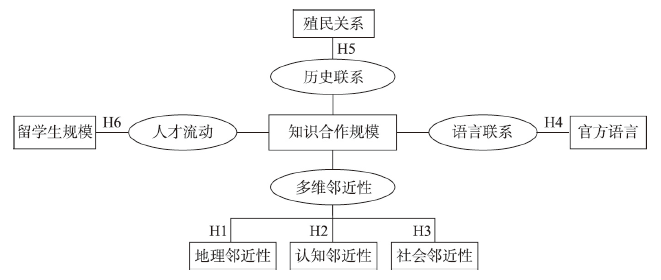
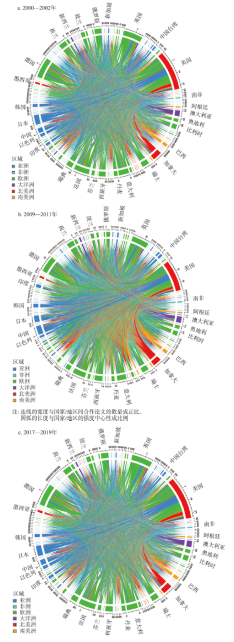
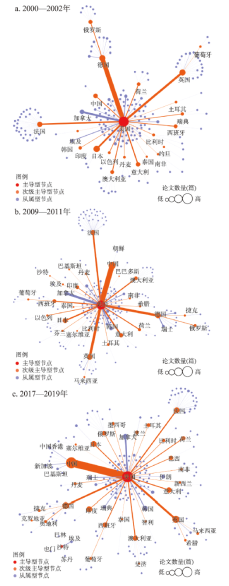
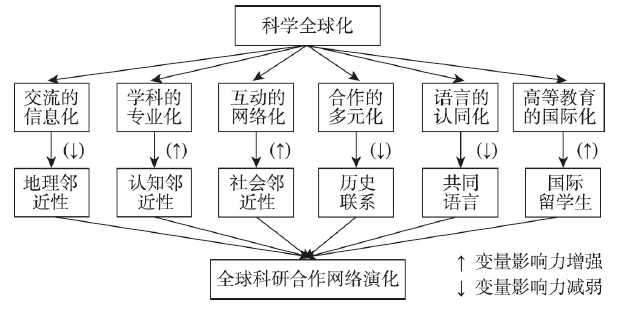
随着全球进入大发展、大变革的新时代,国家/地区间科研合作环境发生剧烈变化,全球科研合作既面临历史性机遇,也遭遇重大挑战。因此,探究全球科研合作网络的动态演化及其驱动机制,对于研判全球科技竞合态势至关重要。本文采用科睿唯安的InCites数据库所收录的2000—2019年国家/地区间科研合作数据,基于“点—线—网”的分析框架和动态的研究视角,刻画了全球科研合作网络的节点位置、双边关系和网络结构3个方面的演化动态,揭示了网络演化的综合驱动机制及其不同发育阶段驱动力重要性的变化。研究发现:① 节点位置上,传统科学强国的度中心性排名始终位居前列,新兴科研国家的网络影响力不断增强。② 双边关系上,国际合作联系数量快速飙升,中美合作取代美德合作,其成为全球最重要的双边联系。③ 网络结构上,全球科研合作网络的等级层次性逐渐降低,由美国单组团演化为美国—沙特双组团。④ 驱动机制上,全球科研合作网络演化受到地理邻近性、认知邻近性、社会邻近性、共同语言、历史联系和人才流动等多重因素的共同作用。其中,地理邻近性、共同语言和历史联系的重要性随着网络演化而降低,合作网络的驱动力更多是依靠社会邻近性、认知邻近性和人才流动。
桂钦昌 , 杜德斌 , 刘承良 . 全球科研合作网络的动态演化及其驱动机制[J]. 地理学报, 2023 , 78(2) : 423 -442 . DOI: 10.11821/dlxb202302010
As the world enters a new era of big developments and changes, the inter-country and inter-region scientific collaboration has seen fundamental changes in its environment, which not only faces unprecedented opportunities but also encounters grand challenges. Consequently, exploring the network dynamics and driving mechanisms of global scientific collaboration plays a critical role in the judgment of global science competition and cooperation. This paper, from the perspective of "node-line-network" and based on the dynamic logic in proximity approaches, uses the internationally co-authored papers data from the InCites database of Clarivate Analytics company for the period 2000-2019, and investigates the position of countries/regions, bilateral partnerships between countries/regions, the evolution of network structure, and reveals dynamic mechanisms of international scientific collaboration network as well as how the influence of driving factors changes over time. Firstly, results show that the traditional science powerhouses, such as the United States, the United Kingdom, France, and Germany, have occupied central and critical positions in the network. At the same time, the emerging scientific nations have strengthened their centrality and influence in the network, including China, South Korea, India, and South Africa, which are gradually close to the core position. Secondly, the number of ties between countries has increased dramatically. The research partnership between Germany and the United States is gradually giving way to China-US collaboration, which becomes the most important bilateral collaboration between countries in the world. Thirdly, the global scientific collaboration network is characterized by a star-shaped structure. As globalization and networking of science advance, decentralization in the collaboration network grows increasingly refined. The whole network has evolved from a single group dominated by the United States to a double group including the United States and Saudi Arabia. Finally, the extended gravity model indicates that geographical proximity, social proximity, cognitive proximity, common language, historical links, and talent flows have a positive effect on international scientific collaboration. As the knowledge network evolves, the importance of geographical proximity, common language, and historical links has waned over time, while the significance of social proximity, cognitive proximity, and talent flows has increased.
表1 变量描述和数据来源Tab. 1 Variable descriptions and data sources |
| 变量名称 | 变量描述 | 数据来源 | |
|---|---|---|---|
| 因变量 | 合作规模Cij | 国家/地区间科学论文合作的数量 | InCties数据库 |
| 自变量 | 地理邻近性Geoprox | 国家/地区间的地理距离的自然对数与10的差值 | 作者计算 |
| 认知邻近性Conprox | 国家/地区间知识结构的Jaffe系数 | 作者计算 | |
| 社会邻近性Sociprox | 国家/地区间合作伙伴重叠的程度 | 作者计算 | |
| 共同语言Comlang | 虚拟变量,英语是否两国/地区的主要语言 | CEPII数据库 | |
| 历史联系Hislink | 虚拟变量,国家/地区间的殖民关系 | CEPII数据库 | |
| 人才流动Talflow | 国家/地区间的留学生数量的自然对数 | UIS数据库 | |
| 控制变量 | 科学规模Publicationi (ln) | 国家/地区i发表论文数量的自然对数 | InCties数据库 |
| 科学规模Publicationj (ln) | 国家/地区j发表论文数量的自然对数 | InCties数据库 | |
| 研发人员Researchersi (ln) | 国家/地区i每百万居民全时研发人员的自然对数 | 世界银行 | |
| 研发人员Researchersj (ln) | 国家/地区j每百万居民全时研发人员的自然对数 | 世界银行 | |
| 经济水平EDLi | 国家/地区i的经济发展阶段 | 世界银行 | |
| 经济水平EDLj | 国家/地区j的经济发展阶段 | 世界银行 |
表2 2000—2019年国家/地区在全球科学合作网络中的位置变化Tab. 2 Country/region position changes in the global scientific collaboration network, 2000-2019 |
| 排名 | 2000—2002年 | 2009—2011年 | 2017—2019年 | |||||||
|---|---|---|---|---|---|---|---|---|---|---|
| 国家/地区 | 度中心性 | 国家/地区 | 度中心性 | 国家/地区 | 度中心性 | |||||
| 1 | 美国 | 183 | 美国 | 195 | 美国 | 204 | ||||
| 2 | 英国 | 177 | 英国 | 193 | 法国 | 204 | ||||
| 3 | 法国 | 173 | 法国 | 185 | 英国 | 203 | ||||
| 4 | 德国 | 162 | 加拿大 | 184 | 澳大利亚 | 202 | ||||
| 5 | 加拿大 | 155 | 意大利 | 179 | 德国 | 200 | ||||
| 6 | 瑞士 | 153 | 澳大利亚 | 177 | 中国 | 199 | ||||
| 7 | 意大利 | 148 | 瑞士 | 177 | 西班牙 | 199 | ||||
| 8 | 荷兰 | 148 | 德国 | 176 | 加拿大 | 198 | ||||
| 9 | 澳大利亚 | 147 | 日本 | 175 | 印度 | 198 | ||||
| 10 | 比利时 | 143 | 荷兰 | 169 | 南非 | 198 | ||||
| 11 | 日本 | 140 | 西班牙 | 169 | 意大利 | 197 | ||||
| 12 | 西班牙 | 140 | 比利时 | 165 | 荷兰 | 197 | ||||
| 13 | 瑞典 | 136 | 巴西 | 165 | 瑞士 | 197 | ||||
| 14 | 丹麦 | 130 | 瑞典 | 165 | 新西兰 | 196 | ||||
| 15 | 巴西 | 127 | 中国 | 162 | 日本 | 195 | ||||
| 16 | 印度 | 127 | 墨西哥 | 159 | 比利时 | 194 | ||||
| 17 | 南非 | 123 | 印度 | 158 | 巴西 | 194 | ||||
| 18 | 奥地利 | 119 | 南非 | 158 | 葡萄牙 | 193 | ||||
| 19 | 中国 | 119 | 肯尼亚 | 154 | 俄罗斯 | 192 | ||||
| 20 | 芬兰 | 115 | 丹麦 | 152 | 瑞典 | 192 | ||||
表3 全球科研合作的回归结果Tab. 3 Estimation results of the global scientific collaboration network |
| 模型1 | 模型2 | 模型3 | 模型4 | 模型5 | 模型6 | 模型7 | 模型8 | |
|---|---|---|---|---|---|---|---|---|
| 国家/地区i科学规模 | 0.414*** | 0.430*** | 0.392*** | 0.399*** | 0.414*** | 0.416*** | 0.408*** | 0.394*** |
| (0.008) | (0.008) | (0.008) | (0.008) | (0.008) | (0.008) | (0.008) | (0.008) | |
| 国家/地区j科学规模 | 0.425*** | 0.440*** | 0.408*** | 0.404*** | 0.424*** | 0.425*** | 0.420*** | 0.404*** |
| (0.008) | (0.008) | (0.008) | (0.009) | (0.008) | (0.008) | (0.008) | (0.009) | |
| 国家/地区i研发人数 | 0.051*** | 0.014 | 0.040*** | 0.051*** | 0.052*** | 0.051*** | 0.049*** | 0.009 |
| (0.010) | (0.010) | (0.010) | (0.010) | (0.010) | (0.010) | (0.010) | (0.010) | |
| 国家/地区j研发人数 | 0.045*** | 0.007 | 0.039*** | 0.055*** | 0.047*** | 0.045*** | 0.046*** | 0.018* |
| (0.010) | (0.010) | (0.010) | (0.010) | (0.010) | (0.010) | (0.010) | (0.010) | |
| 国家/地区i经济水平 | 0.121*** | 0.125*** | 0.127*** | 0.122*** | 0.122*** | 0.122*** | 0.121*** | 0.132*** |
| (0.010) | (0.010) | (0.010) | (0.010) | (0.010) | (0.010) | (0.010) | (0.010) | |
| 国家/地区j经济水平 | 0.146*** | 0.150*** | 0.145*** | 0.146*** | 0.147*** | 0.147*** | 0.146*** | 0.151*** |
| (0.010) | (0.010) | (0.010) | (0.010) | (0.010) | (0.010) | (0.010) | (0.010) | |
| 地理邻近性 | 0.256*** | 0.222*** | ||||||
| (0.014) | (0.015) | |||||||
| 认知邻近性 | 0.843*** | 0.687*** | ||||||
| (0.061) | (0.061) | |||||||
| 社会邻近性 | 0.580*** | 0.462*** | ||||||
| (0.056) | (0.054) | |||||||
| 共同语言 | 0.190*** | 0.274*** | ||||||
| (0.073) | (0.074) | |||||||
| 历史联系 | 0.222*** | 0.045 | ||||||
| (0.062) | (0.063) | |||||||
| 人才流动 | 0.015*** | 0.010*** | ||||||
| (0.003) | (0.003) | |||||||
| 常数 | -7.436*** | -7.587*** | -7.652*** | -7.523*** | -7.452*** | -7.461*** | -7.373*** | -7.806*** |
| (0.109) | (0.109) | (0.110) | (0.109) | (0.109) | (0.109) | (0.109) | (0.111) | |
| 年份 | YES | YES | YES | YES | YES | YES | YES | YES |
| 国家/地区i | YES | YES | YES | YES | YES | YES | YES | YES |
| 国家/地区j | YES | YES | YES | YES | YES | YES | YES | YES |
| 观察值 | 15708 | 15708 | 15708 | 15708 | 15708 | 15708 | 15708 | 15708 |
| 样本量 | 2618 | 2618 | 2618 | 2618 | 2618 | 2618 | 2618 | 2618 |
注:括号内为标准误;*p < 0.1,**p < 0.05,***p < 0.01。 |
表4 全球科研合作的驱动因素时间演化Tab. 4 Temporal evolution of the driving factors of the global scientific collaboration network |
| 时段 | ||||||
|---|---|---|---|---|---|---|
| 2003—2005 | 2006—2008 | 2009—2011 | 2012—2014 | 2015—2017 | 2017—2019 | |
| 地理邻近性 | 0.506*** | 0.503*** | 0.432*** | 0.306*** | 0.284*** | 0.254*** |
| (0.024) | (0.030) | (0.021) | (0.019) | (0.020) | (0.018) | |
| 认知邻近性 | 0.149*** | 0.187*** | 0.208*** | 0.208*** | 0.231*** | 0.263*** |
| (0.022) | (0.028) | (0.025) | (0.024) | (0.026) | (0.022) | |
| 社会邻近性 | 0.187*** | 0.145*** | 0.318*** | 0.511*** | 0.524*** | 0.626*** |
| (0.028) | (0.030) | (0.032) | (0.031) | (0.031) | (0.036) | |
| 共同语言 | 0.083*** | 0.051*** | 0.033** | 0.005 | 0.000 | 0.012 |
| (0.019) | (0.015) | (0.013) | (0.012) | (0.010) | (0.009) | |
| 历史联系 | 0.074*** | 0.066*** | 0.059*** | 0.075*** | 0.050*** | 0.035** |
| (0.019) | (0.020) | (0.018) | (0.018) | (0.017) | (0.0145) | |
| 人才流动 | 0.323*** | 0.386*** | 0.302*** | 0.282*** | 0.253*** | 0.313*** |
| (0.032) | (0.030) | (0.027) | (0.024) | (0.026) | (0.025) | |
| 国家/地区i控制变量 | YES | YES | YES | YES | YES | YES |
| 国家/地区j控制变量 | YES | YES | YES | YES | YES | YES |
| 常数项 | 4.271*** | 4.335*** | 4.455*** | 4.641*** | 4.783*** | 4.411*** |
| (0.025) | (0.024) | (0.021) | (0.019) | (0.028) | (0.042) | |
| 观察值 | 2628 | 2628 | 2628 | 2628 | 2628 | 2628 |
| Alpha | 0.600 | 0.625 | 0.606 | 0.557 | 0.512 | 0.434 |
| Wald chi2 | 13708.97 | 11456.21 | 14108.83 | 17239.37 | 8529.62 | 10407.21 |
| Prob > chi2 | 0.000 | 0.000 | 0.000 | 0.000 | 0.000 | 0.000 |
| Log pseudolikelihood | -10921.268 | -12127.680 | -13715.301 | -15384.121 | -16958.363 | -17609.594 |
注:括号内为稳健标准误;*p < 0.1,**p < 0.05,***p < 0.01;全部自变量被Z-score标准化。 |
| [1] |
|
| [2] |
[ 杜德斌, 张仁开, 龚利, 等. 高校科技国际化:国际经验与中国的实践. 北京: 中国人民大学出版社, 2015.]
|
| [3] |
[ 王一鸣. 百年大变局、高质量发展与构建新发展格局. 管理世界, 2020, 36(12): 1-13.]
|
| [4] |
[ 张杰. 中美科技创新战略竞争的博弈策略与共生逻辑. 亚太经济, 2019(4): 5-12, 149.]
|
| [5] |
|
| [6] |
[ 司月芳, 孙康, 朱贻文, 等. 高被引华人科学家知识网络的空间结构及影响因素. 地理研究, 2020, 39(12): 2731-2742.]
|
| [7] |
[ 刘凤朝, 马荣康, 姜楠. 基于“985高校”的产学研专利合作网络演化路径研究. 中国软科学, 2011(7): 178-192.]
|
| [8] |
[ 王秋玉, 曾刚, 吕国庆. 中国装备制造业产学研合作创新网络初探. 地理学报, 2016, 71(2): 251-264.]
|
| [9] |
[ 马海涛, 黄晓东, 李迎成. 粤港澳大湾区城市群知识多中心的演化过程与机理. 地理学报, 2018, 73(12): 2297-2314.]
|
| [10] |
[ 林晓峰, 姜海宁. 基于论文合作的长三角“青年千人”知识合作网络特征分析. 世界地理研究, 2020, 29(2): 388-396.]
|
| [11] |
[ 顾伟男, 刘慧, 王亮. “一带一路”沿线国家科研合作网络的多元结构及形成机制. 地理研究, 2020, 39(5): 1070-1087.]
|
| [12] |
|
| [13] |
|
| [14] |
[ 王庆喜, 胡志学. 多维邻近下浙江城市创新网络演化及其机制研究. 地理科学, 2021, 41(8): 1380-1388.]
|
| [15] |
[ 贺灿飞, 余昌达. 多维邻近性、贸易壁垒与中国: 世界市场的产业联系动态演化. 地理学报, 2022, 77(2): 275-294.]
|
| [16] |
|
| [17] |
[ 周锐波, 陈依楠, 覃远红. 全球高技术产品贸易网络演化及影响因素. 世界地理研究: 1-13, http://kns.cnki.net/kcms/detail/31.1626.P.20220308.0844.002.html, 2022-09-14.] (网络首发)
|
| [18] |
|
| [19] |
[ 顾伟男, 刘慧, 王亮. 国外创新网络演化机制研究. 地理科学进展, 2019, 38(12): 1977-1990.]
|
| [20] |
|
| [21] |
|
| [22] |
|
| [23] |
|
| [24] |
[ 胡杨, 李郇. 多维邻近性对产学研合作创新的影响: 广州市高新技术企业的案例分析. 地理研究, 2017, 36(4): 695-706.]
|
| [25] |
|
| [26] |
|
| [27] |
|
| [28] |
[ 吕国庆, 曾刚, 顾娜娜. 基于地理邻近与社会邻近的创新网络动态演化分析: 以我国装备制造业为例. 中国软科学, 2014(5):97-106.]
|
| [29] |
|
| [30] |
|
| [31] |
|
| [32] |
[ 王越. 试论产业聚集区的知识转移. 中国煤炭, 2003, 29(8): 21-22, 24.]
|
| [33] |
|
| [34] |
[ 汪涛,
|
| [35] |
|
| [36] |
|
| [37] |
|
| [38] |
|
| [39] |
|
| [40] |
[ 刘晔, 沈建法, 刘于琪. 西方高端人才跨国流动研究述评. 人文地理, 2013, 28(2): 7-12.]
|
| [41] |
|
| [42] |
[ 侯纯光. 全球留学生流动的空间演化、机理、效应与中国响应[D]. 上海: 华东师范大学, 2021.]
|
| [43] |
[ 李丹丹, 汪涛, 魏也华, 等. 中国城市尺度科学知识网络与技术知识网络结构的时空复杂性. 地理研究, 2015, 34(3): 525-540.]
|
| [44] |
[ 刘承良, 桂钦昌, 段德忠, 等. 全球科研论文合作网络的结构异质性及其邻近性机理. 地理学报, 2017, 72(4): 737-752.]
|
| [45] |
[ 孙瑶, 王贤文. 改革开放以来中国国际科学论文产出的计量分析:基于InCites数据库的研究. 科学学与科学技术管理, 2018, 39(12): 46-53.]
|
| [46] |
|
| [47] |
|
| [48] |
[ 刘凤朝, 邬德林, 马荣康.专利技术许可对企业创新产出的影响研究: 三种邻近性的调节作用. 科研管理, 2015, 36(4): 91-100.]
|
| [49] |
|
| [50] |
|
| [51] |
|
| [52] |
|
| [53] |
|
| [54] |
|
| [55] |
|
| [56] |
|
| [57] |
|
| [58] |
|
| [59] |
|
| [60] |
|
| [61] |
|
| [62] |
|
| [63] |
|
| [64] |
|
| [65] |
|
| [66] |
|
| [67] |
Union of International Associations. Yearbook of International Organizations. Belgium: Union of International Associations, 2022. https://ybio.brillonline.com.
|
| [68] |
OECD. Education at a Glance 2018: OECD Indicators. Paris: OECD Publishing, 2018. DOI: 10.1787/eag-2018-en.
|
| [69] |
|
| [70] |
|
| [71] |
|
| [72] |
|
| [73] |
|
| [74] |
|
/
| 〈 |
|
〉 |