
基于遥感监测的秦岭南北积雪日数时空变化及影响因素
|
李双双(1988-), 男, 陕西潼关人, 副教授, 硕士生导师, 中国地理学会会员(S110011553M), 研究方向为气候变化与区域灾害防治。E-mail: lss1988@snnu.edu.cn |
收稿日期: 2022-09-04
修回日期: 2022-11-15
网络出版日期: 2023-01-16
基金资助
国家自然科学基金项目(42171095)
国家自然科学基金项目(41877519)
国家自然科学基金项目(41771030)
国家自然科学基金项目(41701592)
Spatiotemporal variation of snow cover days and influencing factors in north and south Qinling Mountains based on remote sensing monitoring
Received date: 2022-09-04
Revised date: 2022-11-15
Online published: 2023-01-16
Supported by
National Natural Science Foundation of China(42171095)
National Natural Science Foundation of China(41877519)
National Natural Science Foundation of China(41771030)
National Natural Science Foundation of China(41701592)
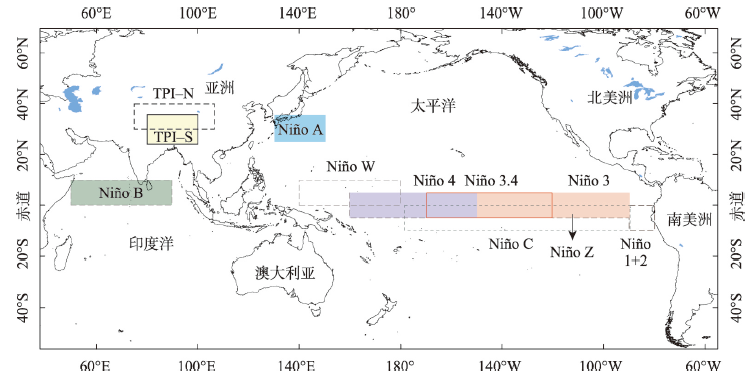
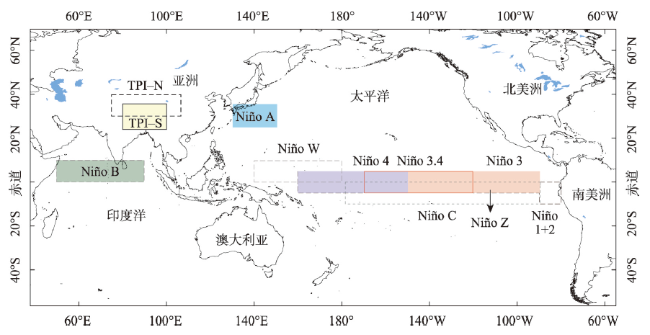
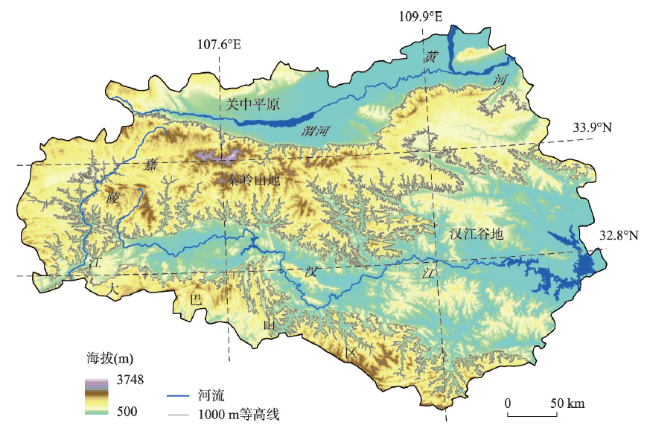
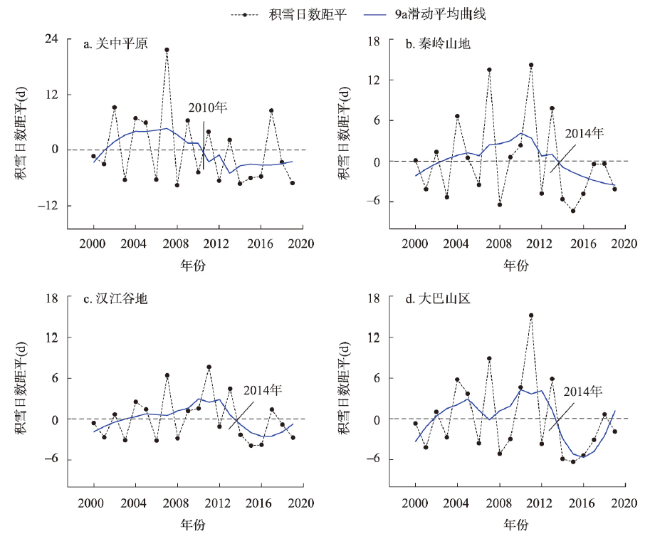
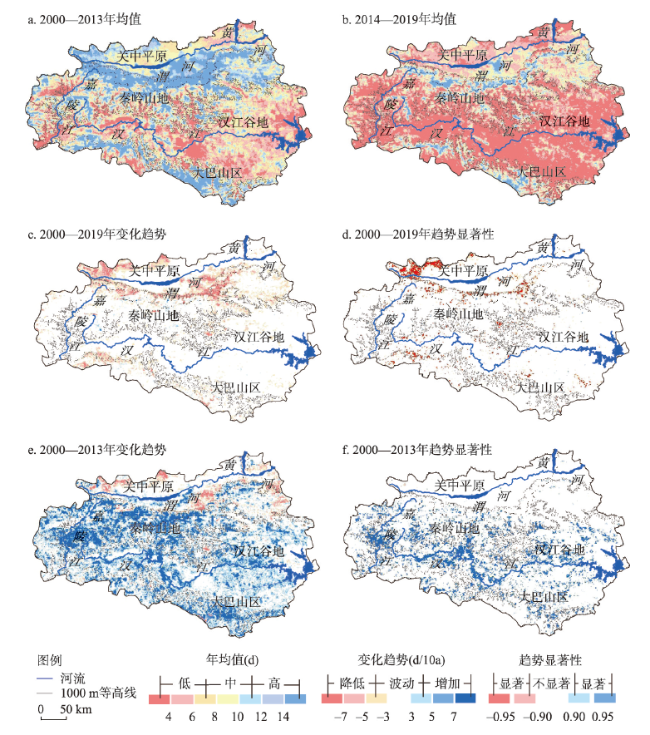
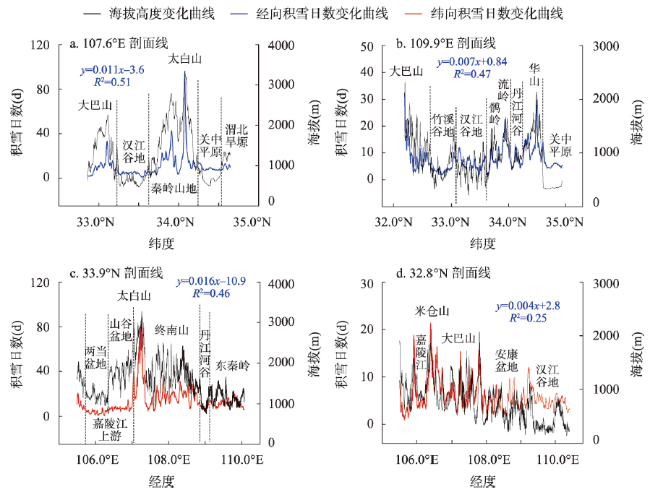
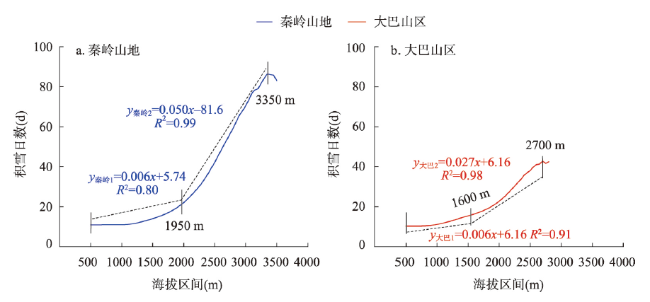
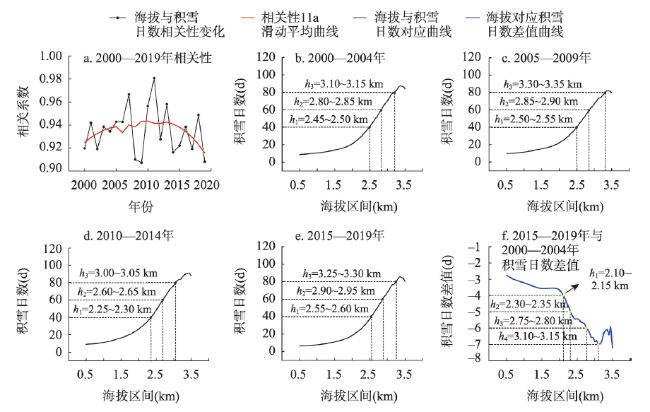
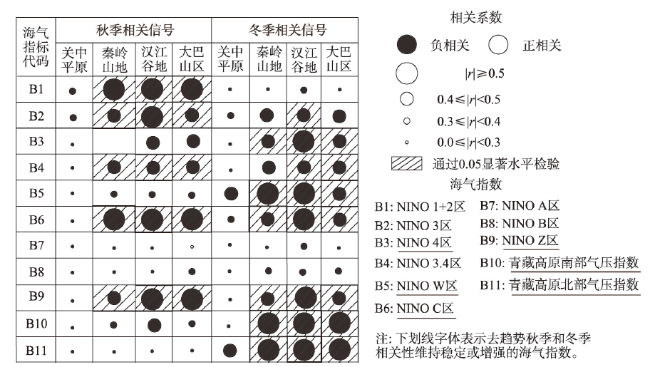
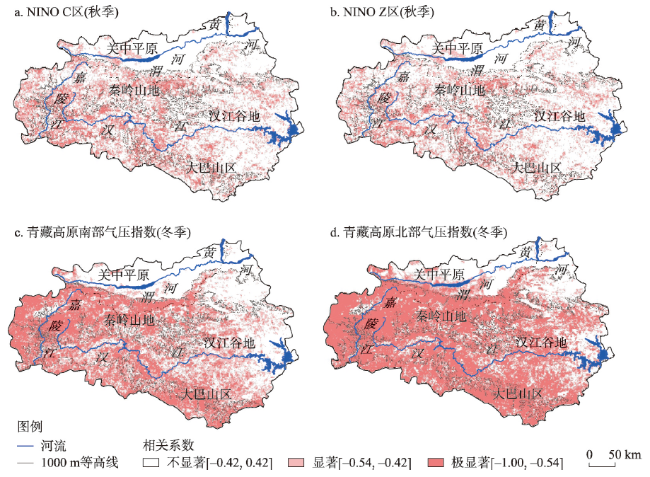
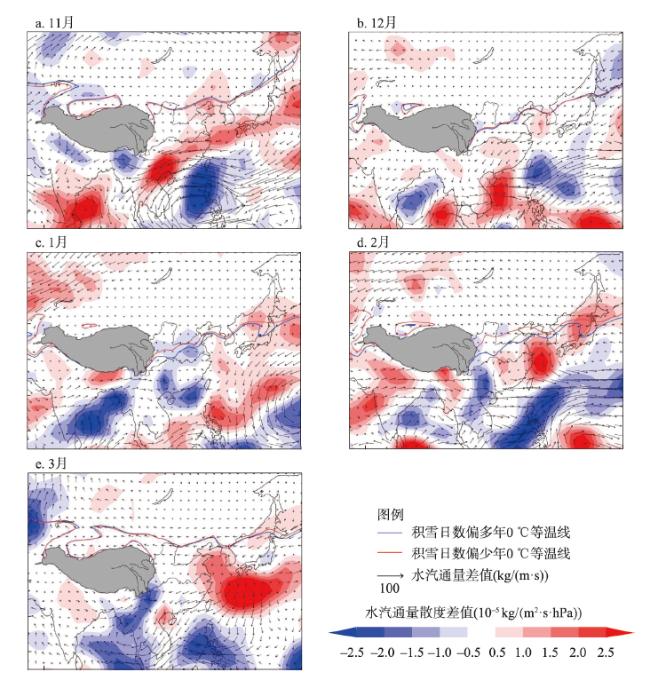
以海拔依赖型变暖为理论基础,研究山地积雪对气候变暖的响应机制,是当前气候变化研究的热点问题。基于2000—2019年MODIS积雪物候数据,对秦岭南北积雪日数时空变化进行分析,探讨了秋冬两季厄尔尼诺指数(NINO)、青藏高原气压对积雪异常的影响。结果表明:① 2013年后秦岭南北气候由“变暖停滞”转为“增温回升”,积雪日数随之呈现转折下降,积雪日数≥10 d栅格占比由前期的35.1%下降为8.6%。② 在垂直地带规律上,秦岭山地以1950~2000 m为临界点,大巴山区以1600~1650 m为临界点,低海拔地区积雪日数随海拔增加速率要低于高海拔地区。2100~3150 m海拔带是积雪日数的垂直变化的关键带;③ 在影响因素上,NINO C区、NINO Z区秋冬海温和青藏高原冬季高压,是秦岭山地、汉江谷地和大巴山区积雪异常的有效指示信号。当赤道太平洋中部秋冬海温偏低,且青藏高原冬季高压偏低时,上述3个子区积雪日数异常偏多。④ 在环流机制方面,相对于积雪日数偏少年,秦岭南北积雪日数偏多年1—2月0 ℃等温线位置偏南,低温环境为增加冰雪物质积累、延缓冰雪消融提供了气温条件;1月区域存在弱的水汽辐合带,为增加冰雪物质积累提供了水汽条件。
李双双 , 胡佳岚 , 段克勤 , 何锦屏 , 延军平 . 基于遥感监测的秦岭南北积雪日数时空变化及影响因素[J]. 地理学报, 2023 , 78(1) : 121 -138 . DOI: 10.11821/dlxb202301008
It is a hot issue in climate change research to study the response mechanism of mountain snow cover to climate warming based on elevation-dependent warming. Based on Terra Moderate Resolution Imaging Spectroradiometer (MODIS) snow cover phenology datasets from 2000 to 2019, we analyzed the spatiotemporal variation of snow cover days in the north and south of the Qinling Mountains by the methods of trend and detrended correlation analysis. Meanwhile, we identified the influencing factors of snow cover days from the perspectives of sea surface temperature (SST) in autumn and winter of the equatorial Pacific, high pressure over the Qinghai-Tibet Plateau, respectively. The results are as follows: (1) after 2013, climate condition in the north and south of the Qinling Mountains shifted from "warming hiatus" to "warming up", followed by declining snow cover days. And the proportion of areas with snow cover more than 10 days decreased from 35.1% to 8.6%. (2) We identified 1950-2000 m in the Qinling Mountains and 1600-1650 m in the Daba Mountains as transition zones of snow cover days. Above the transition zone, the increasing rate of snow cover days with altitude is higher than that of the low altitude area. Particularly, the altitudinal belt between 2100 m and 3150 m is the sensitivity zone of snow cover days to climate change. On the basis of the reference period of 2000-2004, we find that the elevation with 40, 60 and 80 days of snow cover increased by 100 m, 100 m and 150 m for the period of 2015-2019. (3) The SST in autumn and winter over NINO C and NINO Z regions and the winter high pressure over Qinghai-Tibet Plateau are two effective indicators of snow cover days anomaly in the Qinling Mountains, Hanjiang Valley and Daba Mountains. The lower SST of the central equatorial Pacific in autumn and winter, or the lower the winter high pressure over the Qinghai-Tibet Plateau is, the more excessive snow cover days would occur. (4) In terms of circulation mechanism, during the years with more snow cover days, the 0 ℃ isotherm in January and February was southerly, providing the proper temperature for increasing snow and ice accumulation and delaying snow and ice melting. Moreover, there was a weak water vapor convergence zone in January, which provided water vapor conditions for increasing snow and ice accumulation. The findings can enrich our understanding of winter climate change and provide early warning information of snow anomaly in the subtropical and warm-temperate zones in China.
表1 秦岭南北不同分区积雪日数变化统计特征Tab. 1 The statistics of snow cover days change in the north and south of Qinling Mountains |
| 积雪日数 | 关中平原 | 秦岭山地 | 汉江谷地 | 大巴山区 | 秦岭南北 |
|---|---|---|---|---|---|
| 2000年(d) | 8.2 | 11.0 | 4.6 | 9.6 | 8.3 |
| 2010年(d) | 4.7 | 13.2 | 6.7 | 14.9 | 9.9 |
| 2019年(d) | 2.4 | 6.8 | 2.4 | 8.4 | 5.0 |
| 均值(d) | 9.5 | 10.9 | 5.1 | 10.3 | 9.0 |
| 标准差(d) | 7.8 | 6.3 | 3.4 | 5.7 | 5.3 |
| 变化率(%) | -70.9 | -38.4 | -47.4 | -12.5 | -40.1 |
| 趋势值(d/10a) | -2.7 | -1.0 | -0.5 | -1.3 | -1.3 |
注:均值、标准差、变化率和趋势值计算时段均为2000—2019年。 |
:感谢匿名评审专家对本文积雪垂直地带规律、影响因素分析和论文框架的修改建议,使本文获益匪浅。感谢任涛涛同学对本文遥感数据处理的帮助。感谢中国气象数据网、国家冰川冻土沙漠科学数据中心提供的气象、积雪数据支持。
| [1] |
[ 秦大河, 姚檀栋, 丁永建, 等. 冰冻圈科学概论. 北京: 科学出版社, 2018.]
|
| [2] |
[ 游庆龙, 康世昌, 李剑东, 等. 青藏高原气候变化若干前沿科学问题. 冰川冻土, 2021, 43(3): 885-901.]
|
| [3] |
|
| [4] |
[ 彭立, 邓伟, 谭静, 等. 横断山区水土资源利用与经济增长的匹配关系. 地理学报, 2020, 75(9): 1996-2008.]
|
| [5] |
[ 周鹏, 邓伟, 彭立, 等. 典型山地水土要素时空耦合特征及其成因. 地理学报, 2019, 74(11): 2273-2287.]
|
| [6] |
|
| [7] |
|
| [8] |
|
| [9] |
|
| [10] |
|
| [11] |
|
| [12] |
|
| [13] |
[ 李双双, 芦佳玉, 延军平, 等. 1970—2015年秦岭南北气温时空变化及其气候分界意义. 地理学报, 2018, 73(1): 13-24.]
|
| [14] |
|
| [15] |
[ 刘玉莲, 任国玉, 于宏敏. 中国降雪气候学特征. 地理科学, 2012, 32(10): 1176-1185.]
|
| [16] |
[ 雷向杰, 李亚丽, 李茜, 等. 1962—2014年秦岭主峰太白山地区积雪变化特征及其成因分析. 冰川冻土, 2016, 38(5): 1201-1210.]
|
| [17] |
[ 韩婷, 雷向杰, 李亚丽, 等. 秦岭区域性高山积雪事件变化特征分析. 冰川冻土, 2021, 43(4): 1040-1048.]
|
| [18] |
[ 李亚丽, 雷向杰, 李茜, 等. 1953—2016 年华山积雪变化特征及其与气温和降水的关系. 冰川冻土, 2020, 42(3): 791-800.]
|
| [19] |
[ 李双双, 段克勤, 王婷, 等. 1970—2018年秦岭南北冷季降雪量时空变化及其影响因素. 地理科学, 2022, 42(1): 163-173.]
|
| [20] |
[ 刘俊杰, 潘自武, 秦奋, 等. 基于MODIS的秦巴山地气温估算与山体效应分析. 地理研究, 2020, 39(3): 735-748.]
|
| [21] |
[ 白红英, 马新萍, 高翔, 等. 基于DEM的秦岭山地1月气温及0 ℃等温线变化. 地理学报, 2012, 67(11): 1443-1450.]
|
| [22] |
[ 赵芳, 张百平, 朱连奇, 等. 秦巴山地垂直带谱结构的空间分异与暖温带—亚热带界线问题. 地理学报, 2019, 74(5): 889-901.]
|
| [23] |
[ 张百平, 姚永慧, 肖飞, 等. 秦岭中部山地落叶阔叶林超级垂直带的发现与意义. 地理学报, 2022, 77(9): 2236-2248.]
|
| [24] |
[ 李大伟, 段克勤, 石培宏, 等. 秦岭中部山地降水的垂直变化研究. 地理学报, 2022, 77(7): 1762-1774.]
|
| [25] |
|
| [26] |
[ 黄荣辉, 刘永, 皇甫静亮, 等. 20世纪90年代末东亚冬季风年代际变化特征及其内动力成因. 大气科学, 2014, 38(4): 627-644.]
|
| [27] |
|
| [28] |
[ 胡钰玲, 赵中军, 康彩燕, 等. 中国南方2008年与2016年两次低温雨雪冰冻天气过程对比分析. 冰川冻土, 2017, 39(6): 1180-1191.]
|
| [29] |
China Meteorological Administration. China Climate Bulletin (2021) http://www.cma.gov.cn/zfxxgk/gknr/qxbg/202203/t20220308_4568477.html. 2022-11-07.
[ 中国气象局. 2021年中国气候公报. http://www.cma.gov.cn/zfxxgk/gknr/qxbg/202203/t20220308_4568477.html. 2022-11-07.]
|
| [30] |
[ 丁一汇, 柳艳菊, 梁苏洁, 等. 东亚冬季风的年代际变化及其与全球气候变化的可能联系. 气象学报, 2014, 72(5): 835-852.]
|
| [31] |
|
| [32] |
|
| [33] |
|
| [34] |
|
| [35] |
[ 陈文, 丁硕毅, 冯娟, 等. 不同类型ENSO对东亚季风的影响和机理研究进展. 大气科学, 2018, 42(3): 640-655.]
|
| [36] |
[ 王婷, 李双双, 延军平, 等. 基于ENSO发展过程的中国夏季降水时空变化特征. 自然资源学报, 2022, 37(3): 803-815.]
|
| [37] |
|
| [38] |
[ 郝晓华, 孙兴亮, 纪文政, 等. 中国MODIS逐日无云500 m积雪面积产品数据集. 国家冰川冻土沙漠科学数据中心, 2020.]
|
| [39] |
|
| [40] |
[ 杨凯, 胡田田, 王澄海. 青藏高原南、北积雪异常与中国东部夏季降水关系的数值试验研究. 大气科学, 2017, 41(2): 345-356.]
|
| [41] |
[ 朱玉祥, 丁一汇, 徐怀刚. 青藏高原大气热源和冬春积雪与中国东部降水的年代际变化关系. 气象学报, 2007, 65(6): 946-958.]
|
| [42] |
[ 张镱锂, 李炳元, 刘林山, 等. 再论青藏高原范围. 地理研究, 2021, 40(6): 1543-1553.]
|
| [43] |
[ 郝晓华, 赵琴, 纪文政, 等. 1980—2020年AVHRR中国积雪物候数据集. 国家冰川冻土沙漠科学数据中心(www.ncdc.ac.cn), 2021.]
|
| [44] |
[ 李爱农, 边金虎, 张正健, 等. 山地遥感主要研究进展、发展机遇与挑战. 遥感学报, 2016, 20(5): 1199-1215.]
|
/
| 〈 |
|
〉 |