
喀斯特山地土壤侵蚀和产水量的最优解释力
|
高江波(1984-), 男, 山东临沂人, 研究员, 博导,主要从事综合自然地理学、山地生态系统服务、气候变化影响与适应研究。E-mail: gaojiangbo@igsnrr.ac.cn |
收稿日期: 2021-08-30
修回日期: 2022-04-07
网络出版日期: 2022-12-27
基金资助
国家自然科学基金项目(42071288)
国家自然科学基金项目(41671098)
中国科学院地理科学与资源研究所可桢—秉维青年人才计划(2020RC002)
The optimal explanatory power of soil erosion and water yield in karst mountainous area
Received date: 2021-08-30
Revised date: 2022-04-07
Online published: 2022-12-27
Supported by
National Natural Science Foundation of China(42071288)
National Natural Science Foundation of China(41671098)
Programme of Kezhen-Bingwei Excellent Young Scientists of the Institute of Geographic Sciences and Natural Resources Research, CAS(2020RC002)
喀斯特生态系统服务主导影响因子识别是科学治理石漠化的前提,然而环境因子对生态系统服务空间分布的解释力受尺度变换的影响,其尺度效应的定量研究仍需进一步加强。为定量厘定环境因子解释力的尺度效应,本文从多尺度视角出发,利用地理探测器定量分析不同空间分辨率下环境因子对土壤侵蚀和产水量的解释力,并探求其在不同地貌形态类型区的差异性规律。结果表明,坡度和植被覆盖度是影响土壤侵蚀空间分布的主导因子,两者的交互作用对土壤侵蚀空间分布的解释力更强。受研究区地形起伏普遍性和景观破碎化的影响,坡度和土地利用类型在低分辨率下解释力最优。降水、海拔和土地利用类型是产水量空间分异的主导因子。降水和土地利用类型的交互作用对产水量的解释力达95%以上,海拔在不同地貌形态类型区的空间变异性影响其最优解释力水平。具体表现为:在台地、丘陵类型区海拔空间变异性较小,在高分辨率下其解释力最优;在山地类型区,海拔空间变异性较大,在低分辨率下其解释力更强。本文通过多尺度分析定量甄别生态系统服务变量的最优解释力,以期为喀斯特山地生态系统服务的主导因子精准辩识和分区优化提供途径和依据。
高江波 , 张怡博 , 左丽媛 . 喀斯特山地土壤侵蚀和产水量的最优解释力[J]. 地理学报, 2022 , 77(11) : 2920 -2934 . DOI: 10.11821/dlxb202211015
Accurately identifying the dominant factor of karst ecosystem services is a prerequisite for the rocky desertification control. However, the explanatory power of environmental factors for the spatial distribution of ecosystem services is affected by scaling, and the quantitative research on the scale effect still needs to be further strengthened. This study used Geodetector to access the explanatory power of environmental factors on soil erosion and water yield at different spatial resolutions, and then explored their differences in three geomorphological types. Results showed that slope and vegetation coverage were the dominant factors of soil erosion, and the interactive explanatory power between the two factors was stronger. Affected by the universality of topographic relief and landscape fragmentation in the study area, the explanatory of slope and land use type on soil erosion was optimal at a low resolution. Precipitation, elevation, and land use type were the dominant factors for the spatial heterogeneity of water yield, and the interaction between precipitation and land use type could explain more than 95% of water yield. The spatial variability of elevation in different geomorphological types affected its optimal explanatory power, especially in the terrace and hill type areas. The spatial variability of elevation was weak, and its explanatory power was optimal at a high resolution. However, in the mountainous areas, the spatial variability of elevation was strong, and its explanatory power was optimal at a low resolution. This study quantitatively identified the optimal explanatory power of ecosystem service variables through multi-scale analysis, which aimed to provide a way and basis for accurate identification of the dominant factors of karst mountain ecosystem services and zoning optimization.
表1 数据来源Tab. 1 Data sources |
| 数据类型 | 数据来源 |
|---|---|
| 气象数据 | 国家气象科学数据中心(http://data.cma.cn) |
| 土壤数据 | 世界土壤数据库(HWSD)、全国第二次土壤普查数据库 |
| 土地利用 岩性、地貌 | 中国科学院资源环境科学数据中心(http://www.resdc.cn) |
| DEM | Google Earth影像 |
| NDVI | 美国地质调查局官网(https://glovis.usgs.gov) |
表2 不同石漠化程度土壤侵蚀修正系数Tab. 2 Correctional coefficient for different degrees of rocky desertification |
| 石漠化程度 | 无 | 潜在 | 轻微 | 中度 | 高 | 极高 |
|---|---|---|---|---|---|---|
| 基岩裸露率(%) | < 20 | 20~30 | 31~50 | 51~70 | 71~90 | > 90 |
| α | 10 | 25 | 40 | 60 | 80 | 95 |
表3 双因子交互作用类型[33]Tab. 3 Types of interaction between two factors |
| 判断依据 | 交互类型 |
|---|---|
| q(X1∩X2) < Min(q(X1), q(X2)) | 非线性减弱 |
| Min(q(X1), q(X2)) < q(X1∩X2) < Max(q(X1), q(X2)) | 单因子非线性减弱 |
| q(X1∩X2) > Max(q(X1), q(X2)) | 双因子增强 |
| q(X1∩X2) = q(X1)+q(X2) | 独立 |
| q(X1∩X2) > q(X1)+q(X2) | 非线性增强 |
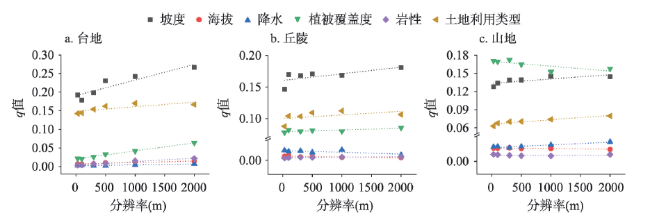
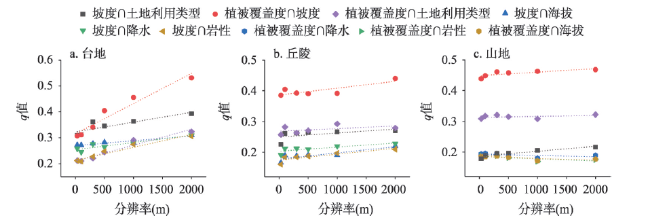
图3 不同地貌类型区内环境因子对土壤侵蚀的解释力随分辨率的变化Fig. 3 Variation of explanatory power of environmental factors on soil erosion with resolutions in different geomorphological areas |
表4 不同地貌类型区内环境因子对土壤侵蚀的最优解释力排序Tab. 4 The rank of optimal explanatory power of environmental factors on soil erosion in different geomorphological areas |
| 地貌类型区 | 排序 | 环境因子 | 因子类型 | 最佳分辨率(m) | 最优解释力(q值) |
|---|---|---|---|---|---|
| 台地 | 1 | 坡度 | 宏观 | 2000 | 0.27 |
| 2 | 土地利用类型 | 宏观 | 1000 | 0.17 | |
| 3 | 植被覆盖度 | 宏观 | 2000 | 0.06 | |
| 4 | 岩性 | 宏观 | 2000 | 0.02 | |
| 5 | 海拔 | 宏观 | 2000 | 0.01 | |
| 6 | 降水 | 宏观 | 2000 | 0.01 | |
| 丘陵 | 1 | 坡度 | 宏观 | 2000 | 0.18 |
| 2 | 土地利用类型 | 宏观 | 1000 | 0.11 | |
| 3 | 植被覆盖度 | 宏观 | 2000 | 0.09 | |
| 4 | 降水 | 局地 | 1000 | 0.02 | |
| 5 | 海拔 | 局地 | 100 | 0.01 | |
| 6 | 岩性 | 宏观 | 2000 | 0.01 | |
| 山地 | 1 | 植被覆盖度 | 局地 | 300 | 0.17 |
| 2 | 坡度 | 宏观 | 1000 | 0.15 | |
| 3 | 土地利用类型 | 宏观 | 2000 | 0.08 | |
| 4 | 降水 | 宏观 | 2000 | 0.02 | |
| 5 | 海拔 | 局地 | 300 | 0.01 | |
| 6 | 岩性 | 平稳 | 30 | 0.01 |
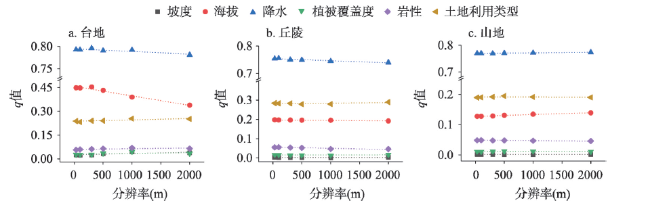
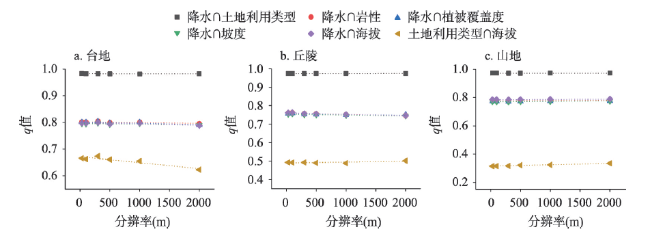
图4 不同地貌类型区内环境因子对产水量的解释力随分辨率的变化Fig. 4 Variation of explanatory power of environmental factors on water yield with resolutions in different geomorphological areas |
表5 不同地貌类型区内环境因子对产水量的最优解释力排序Tab. 5 The rank of optimal explanatory power of environmental factors on water yield in different geomorphological areas |
| 地貌 类型区 | 排序 | 环境因子 | 因子类型 | 最佳 分辨率(m) | 最优解释力 (q值) |
|---|---|---|---|---|---|
| 台地 | 1 | 降水 | 局地 | 300 | 0.80 |
| 2 | 海拔 | 局地 | 300 | 0.45 | |
| 3 | 土地利用类型 | 宏观 | 1000 | 0.25 | |
| 4 | 岩性 | 宏观 | 1000 | 0.07 | |
| 5 | 植被覆盖度 | 宏观 | 1000 | 0.05 | |
| 6 | 坡度 | 宏观 | 1000 | 0.04 | |
| 丘陵 | 1 | 降水 | 局地 | 100 | 0.76 |
| 2 | 土地利用类型 | 宏观 | 2000 | 0.29 | |
| 3 | 海拔 | 局地 | 30 | 0.20 | |
| 4 | 岩性 | 局地 | 100 | 0.06 | |
| 5 | 植被覆盖度 | 平稳 | 2000 | 0.02 | |
| 6 | 坡度 | 平稳 | 2000 | 0.00 | |
| 山地 | 1 | 降水 | 宏观 | 2000 | 0.77 |
| 2 | 土地利用类型 | 平稳 | 500 | 0.19 | |
| 3 | 海拔 | 宏观 | 2000 | 0.14 | |
| 4 | 岩性 | 局地 | 100 | 0.05 | |
| 5 | 植被覆盖度 | 平稳 | 500 | 0.01 | |
| 6 | 坡度 | 平稳 | 2000 | 0.00 |
图5 不同地貌类型区内双因子交互作用对土壤侵蚀的解释力随分辨率的变化Fig. 5 Variation of explanatory power of interactions between two factors on soil erosion with resolutions in different geomorphological areas |
表6 不同地貌类型区内双因子交互作用对土壤侵蚀的最优解释力排序Tab. 6 The rank of optimal explanatory power of interactions between two factors on soil erosion in different geomorphological areas |
| 地貌 类型区 | 排序 | 交互因子 | 因子类型 | 最佳 分辨率(m) | 最优解释力 (q值) |
|---|---|---|---|---|---|
| 台地 | 1 | 坡度∩植被覆盖度 | 宏观 | 2000 | 0.53 |
| 2 | 坡度∩土地利用类型 | 宏观 | 2000 | 0.39 | |
| 3 | 植被覆盖度∩土地利用类型 | 宏观 | 2000 | 0.32 | |
| 4 | 坡度∩海拔 | 宏观 | 2000 | 0.31 | |
| 5 | 坡度∩降水 | 宏观 | 2000 | 0.31 | |
| 6 | 坡度∩岩性 | 宏观 | 2000 | 0.31 | |
| 丘陵 | 1 | 坡度∩植被覆盖度 | 宏观 | 2000 | 0.44 |
| 2 | 植被覆盖度∩土地利用类型 | 宏观 | 1000 | 0.29 | |
| 3 | 坡度∩土地利用类型 | 宏观 | 2000 | 0.27 | |
| 4 | 坡度∩降水 | 宏观 | 2000 | 0.23 | |
| 5 | 坡度∩海拔 | 宏观 | 2000 | 0.22 | |
| 6 | 坡度∩岩性 | 宏观 | 2000 | 0.21 | |
| 山地 | 1 | 植被覆盖度∩坡度 | 宏观 | 2000 | 0.47 |
| 2 | 植被覆盖度∩土地利用类型 | 平稳 | 2000 | 0.32 | |
| 3 | 坡度∩土地利用类型 | 宏观 | 2000 | 0.22 | |
| 4 | 植被覆盖度∩降水 | 局地 | 100 | 0.20 | |
| 5 | 植被覆盖度∩岩性 | 局地 | 30 | 0.19 | |
| 6 | 植被覆盖度∩海拔 | 局地 | 300 | 0.19 |
图6 不同地貌类型区内双因子交互作用对产水量的解释力随分辨率的变化Fig. 6 Variation of explanatory power of interactions between two factors on water yield with resolutions in different geomorphological areas |
表7 不同地貌类型区内双因子交互作用对产水量的最优解释力排序Tab. 7 The rank of optimal explanatory power of interactions between two factors on water yield in different geomorphological areas |
| 地貌 类型区 | 排序 | 交互因子 | 因子类型 | 最佳 分辨率(m) | 最优解释力 (q值) |
|---|---|---|---|---|---|
| 台地 | 1 | 降水∩土地利用类型 | 局地 | 30 | 0.98 |
| 2 | 降水∩岩性 | 局地 | 300 | 0.80 | |
| 3 | 降水∩植被覆盖度 | 局地 | 300 | 0.80 | |
| 4 | 降水∩海拔 | 局地 | 300 | 0.80 | |
| 5 | 降水∩坡度 | 局地 | 300 | 0.80 | |
| 6 | 海拔∩土地利用类型 | 局地 | 300 | 0.67 | |
| 丘陵 | 1 | 降水∩土地利用类型 | 宏观 | 1000 | 0.97 |
| 2 | 降水∩海拔 | 局地 | 100 | 0.76 | |
| 3 | 降水∩岩性 | 局地 | 100 | 0.76 | |
| 4 | 降水∩植被覆盖度 | 局地 | 100 | 0.76 | |
| 5 | 降水∩坡度 | 局地 | 100 | 0.76 | |
| 6 | 海拔∩土地利用类型 | 宏观 | 2000 | 0.50 | |
| 山地 | 1 | 降水∩土地利用类型 | 宏观 | 2000 | 0.97 |
| 2 | 降水∩海拔 | 宏观 | 2000 | 0.79 | |
| 3 | 降水∩岩性 | 宏观 | 2000 | 0.78 | |
| 4 | 降水∩植被覆盖度 | 宏观 | 2000 | 0.78 | |
| 5 | 降水∩坡度 | 宏观 | 2000 | 0.78 | |
| 6 | 海拔∩土地利用类型 | 宏观 | 2000 | 0.33 |
| [1] |
|
| [2] |
[许尔琪. 基于地理加权回归的石漠化影响因子分布研究. 资源科学, 2017, 39(10): 1975-1988.]
|
| [3] |
[王克林, 岳跃民, 陈洪松, 等. 喀斯特石漠化综合治理及其区域恢复效应. 生态学报, 2019, 39(20): 7432-7440.]
|
| [4] |
[左丽媛, 高江波. 基于地理探测器的喀斯特植被NPP定量归因. 生态环境学报, 2020, 29(4): 686-694.]
|
| [5] |
|
| [6] |
[李瑞, 张弛, 顾再柯, 等. 贵州喀斯特区典型小流域坡面土壤侵蚀与主要影响因子的响应. 水土保持研究, 2018, 25(3): 1-5.]
|
| [7] |
[赵斯琦, 王晓红, 舒天竹, 等. 喀斯特地区区域尺度土壤侵蚀地形因子研究. 干旱区资源与环境, 2018, 32(5): 97-103.]
|
| [8] |
[王欢, 高江波, 侯文娟. 基于地理探测器的喀斯特不同地貌形态类型区土壤侵蚀定量归因. 地理学报, 2018, 73(9): 1674-1686.]
|
| [9] |
|
| [10] |
|
| [11] |
|
| [12] |
[魏梦瑶, 张卓栋, 刘瑛娜, 等. 基于CSLE模型的广西土壤侵蚀规律. 水土保持研究, 2020, 27(1): 15-20.]
|
| [13] |
|
| [14] |
|
| [15] |
|
| [16] |
|
| [17] |
|
| [18] |
[戴全厚, 严友进. 西南喀斯特石漠化与水土流失研究进展. 水土保持学报, 2018, 32(2): 1-10.]
|
| [19] |
[高江波, 左丽媛, 王欢. 喀斯特峰丛洼地生态系统服务空间权衡度及其分异特征. 生态学报, 2019, 39(21): 7829-7839.]
|
| [20] |
[王永平, 周子柯, 滕昊蔚, 等. 滇南小流域3种土地利用方式下土壤侵蚀及养分流失特征. 水土保持研究, 2021, 28(1): 11-18.]
|
| [21] |
|
| [22] |
[贾仰文, 郝春沣, 牛存稳, 等. 典型山地降水径流时空演变及“水—热—人—地”匹配性分析. 地理学报, 2019, 74(11): 2288-2302.]
|
| [23] |
[周成虎, 程维明, 钱金凯, 等. 中国陆地1:100万数字地貌分类体系研究. 地球信息科学学报, 2009, 11(6): 707-724.]
|
| [24] |
|
| [25] |
|
| [26] |
[章文波, 付金生. 不同类型雨量资料估算降雨侵蚀力. 资源科学, 2003, 25(1): 35-41.]
|
| [27] |
[钱庆欢, 王世杰, 白晓永, 等. 基于允许流失量和正负地形源汇理论的喀斯特关键带土壤侵蚀研究. 地理学报, 2018, 73(11): 2135-2149.]
|
| [28] |
|
| [29] |
|
| [30] |
|
| [31] |
[蔡崇法, 丁树文, 史志华, 等. 应用USLE模型与地理信息系统IDRISI预测小流域土壤侵蚀量的研究. 水土保持学报, 2000(2): 19-24.]
|
| [32] |
|
| [33] |
[王劲峰, 徐成东. 地理探测器: 原理与展望. 地理学报, 2017, 72(1): 116-134.]
|
| [34] |
|
| [35] |
|
| [36] |
|
| [37] |
|
| [38] |
[王尧, 蔡运龙, 潘懋. 贵州省乌江流域土地利用与土壤侵蚀关系研究. 水土保持研究, 2013, 20(3): 11-18.]
|
| [39] |
[胡奕, 戴全厚, 王佩将. 喀斯特坡耕地产流特征及影响因素. 水土保持学报, 2012, 26(6): 46-51.]
|
| [40] |
[熊康宁, 李晋, 龙明忠. 典型喀斯特石漠化治理区水土流失特征与关键问题. 地理学报, 2012, 67(7): 878-888.]
|
| [41] |
|
| [42] |
[李双成, 蔡运龙. 地理尺度转换若干问题的初步探讨. 地理研究, 2005, 24(1): 11-18.]
|
| [43] |
[刘学军, 卢华兴, 仁政, 等. 论DEM地形分析中的尺度问题. 地理研究, 2007, 26(3): 433-442.]
|
| [44] |
|
| [45] |
|
| [46] |
|
| [47] |
|
| [48] |
|
/
| 〈 |
|
〉 |
