
全球超大城市空间扩张及分形特征研究
|
侯亚丽(1995-), 女, 山西晋中人, 博士生, 主要从事城市遥感方向研究。E-mail: houyl.19s@igsnrr.ac.cn |
收稿日期: 2021-10-09
修回日期: 2022-10-23
网络出版日期: 2022-12-27
基金资助
中国科学院战略性先导科技专项(XDA20040403)
中国科学院战略性先导科技专项(XDA23100201)
Analysis of urban expansion and fractal features in global 33 megacities from 2000-2020
Received date: 2021-10-09
Revised date: 2022-10-23
Online published: 2022-12-27
Supported by
Strategic Priority Research Program of Chinese Academy of Sciences(XDA20040403)
Strategic Priority Research Program of Chinese Academy of Sciences(XDA23100201)
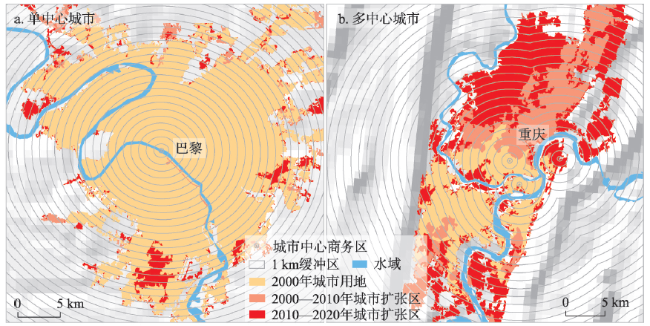
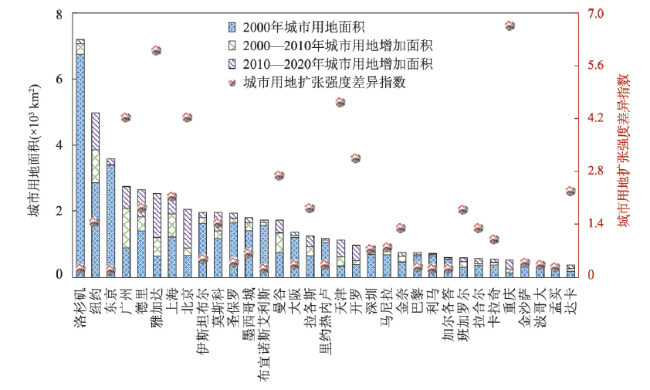
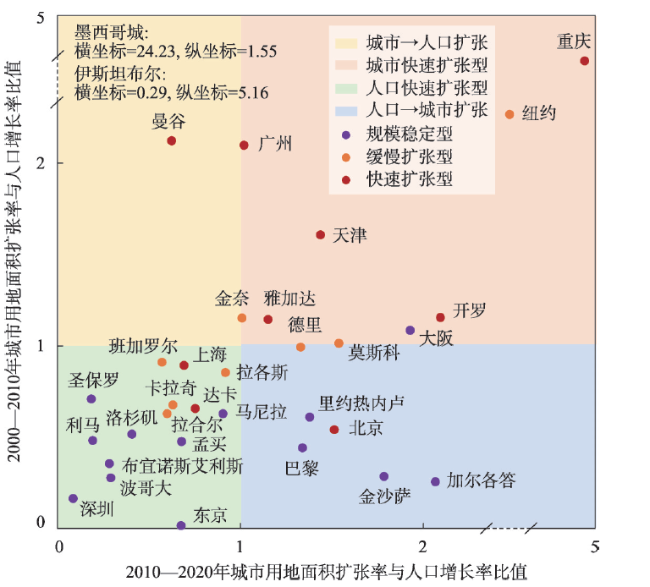
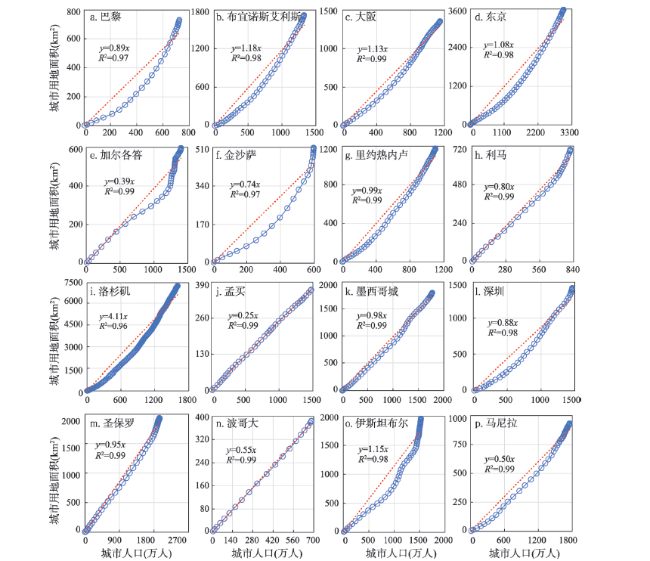
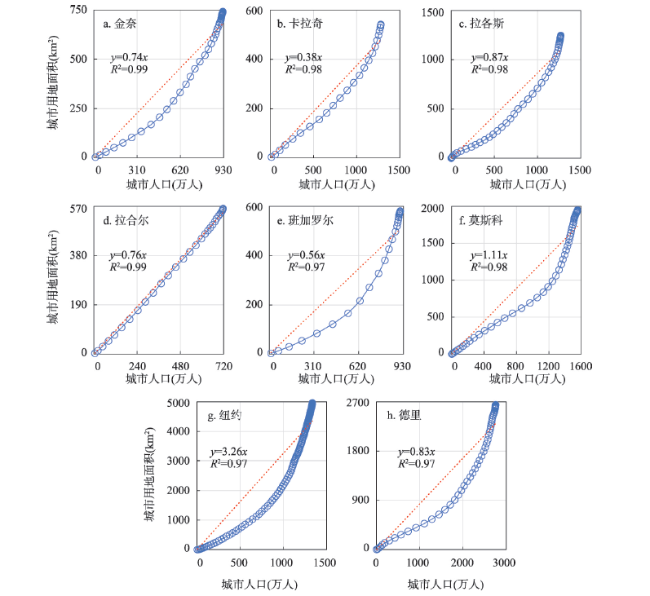
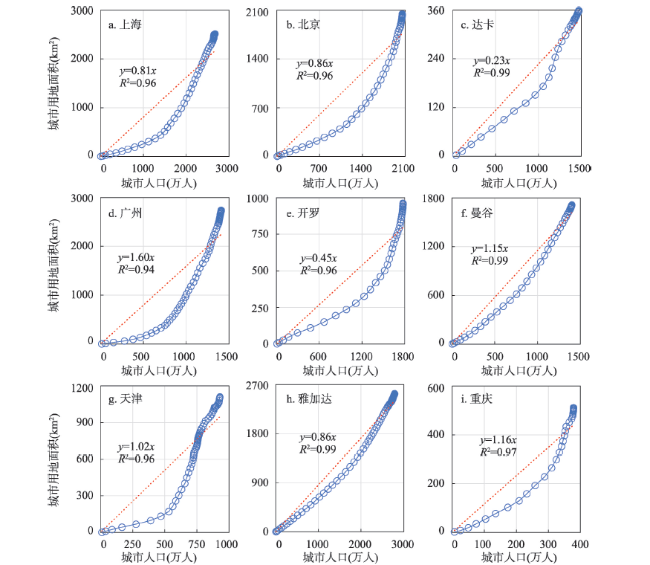
超大城市是全球经济、文化以及高科技产业发展的承载体和重要纽带,其形态结构特征和人口聚集效应是城市化影响的典型表现,然而当前对于全球超大城市形态特征及扩张模式的研究相对不足。基于2000—2020年全球城市土地利用/覆盖变化数据(GULUC-30),利用城市扩张强度差异指数分析了超大城市用地的时空变化规律;而后运用面积—半径标度分析模型研究了超大城市的分形特征及扩张模式,最后基于城市用地面积和城市人口之间的线性关系评价城市用地效率。结果发现:① 2000—2020年东南亚和东亚的中国超大城市用地扩张最剧烈,城市用地面积分别扩张了3148.32 km2和5996.26 km2,城市扩张强度差异指数平均值大于3;② 2000—2020年超大城市的形态特征和扩张模式向着更加集约和紧凑的方向发展,径向维数平均值由1.54增加至1.56,分维差呈逐年减少趋势,城市内部结构一体化特征显著;③ 北美和欧洲的超大城市用地效率低,2020年城市用地面积与城市人口比值系数范围为0.89~4.11;南亚和非洲城市用地效率高,比值范围为0.23~0.87。超大城市空间扩张格局和形态变化的认识对于城市用地的集约利用和可持续发展具有重要参考价值。严格控制超大城市扩张规模,促进城市用地的均衡发展是建设韧性城市和实现城市地区可持续发展的必要条件。

侯亚丽 , 匡文慧 , 窦银银 . 全球超大城市空间扩张及分形特征研究[J]. 地理学报, 2022 , 77(11) : 2687 -2702 . DOI: 10.11821/dlxb202211001
The ultimate form of urbanization is the megacity, which is the typical form of urban structural characteristics and population agglomeration effects. However, the comparative studies on the urban form and expansion patterns of megacities worldwide are still insufficient. This study first analyzed the spatiotemporal changes of land use in megacities based on the Global Urban Land Use/Cover Composites with a 30 m spatial resolution (GULUC-30) by using the method of urban expansion intensity differentiation index (UEDI). Then, the fractal structure and expansion patterns of megacities were investigated using the area-radius model. Finally, urban land use efficiency was assessed through a linear relationship between urban land area and its interna population. The findings include: (1) Southeast Asia and China had experienced the most dramatic urban land expansion (3148.32 km2 and 5996.26 km2) over the last 20 years, along with the average UEDI of both greater than 3. (2) In 2000-2020, morphological characteristics and sprawl patterns of megacities developed toward greater intensification and compactness, with the mean radial dimension increased from 1.54 to 1.56. Meanwhile, radial dimension difference showed a year-by-year decreasing trend, and the intra-city structure showed integration. (3) In 2020, urban land use efficiencies in both North America and Europe were low, with urban land area to its population ratio coefficients ranging from 0.89 to 4.11. On the contrary, high values happened in South Asia and Africa, from 0.23 to 0.87. Spatial patterns and morphological changes in megacities provide important reference values for the intensive utilization of urban land and its sustainable development. Controlling the scale of megacity expansion and promoting the balanced exploitation of urban land are the essential ways for building resilient cities and sustainable urban planning.
表1 全球33个超大城市名单Tab. 1 List of global 33 megacities |
| 超大城市 | 国家 | 地区 | 人口(千万) | 超大城市 | 国家 | 地区 | 人口(千万) |
|---|---|---|---|---|---|---|---|
| 班加罗尔 | 印度 | 南亚 | 1.14 | 拉各斯 | 尼日利亚 | 西非 | 1.35 |
| 曼谷 | 泰国 | 东南亚 | 1.02 | 拉合尔 | 巴基斯坦 | 南亚 | 1.17 |
| 北京 | 中国 | 东亚 | 1.96 | 利马 | 秘鲁 | 南美 | 1.04 |
| 波哥大 | 哥伦比亚 | 南美 | 1.06 | 洛杉矶 | 美国 | 北美 | 1.25 |
| 布宜诺斯艾利斯 | 阿根廷 | 南美 | 1.50 | 马尼拉 | 菲律宾 | 东南亚 | 1.35 |
| 开罗 | 埃及 | 北非 | 2.01 | 墨西哥城 | 墨西哥 | 北美 | 2.16 |
| 金奈 | 印度 | 南亚 | 1.05 | 莫斯科 | 俄罗斯 | 欧洲 | 1.24 |
| 重庆 | 中国 | 东亚 | 1.48 | 孟买 | 印度 | 南亚 | 2.00 |
| 德里 | 印度 | 南亚 | 2.85 | 纽约 | 美国 | 北美 | 1.88 |
| 达卡 | 孟加拉国 | 南亚 | 1.96 | 大阪 | 日本 | 东亚 | 1.93 |
| 广州 | 中国 | 东亚 | 1.26 | 巴黎 | 法国 | 欧洲 | 1.09 |
| 伊斯坦布尔 | 土耳其 | 欧洲、西亚 | 1.48 | 里约热内卢 | 巴西 | 南美 | 1.33 |
| 雅加达 | 印度尼西亚 | 东南亚 | 1.05 | 圣保罗 | 巴西 | 南美 | 2.17 |
| 卡拉奇 | 巴基斯坦 | 南亚 | 1.54 | 上海 | 中国 | 东亚 | 2.56 |
| 金沙萨 | 刚果(金) | 非洲 | 1.32 | 深圳 | 中国 | 东亚 | 1.19 |
| 加尔各答 | 印度 | 南亚 | 1.47 | 天津 | 中国 | 东亚 | 1.32 |
| 东京 | 日本 | 东亚 | 3.75 |
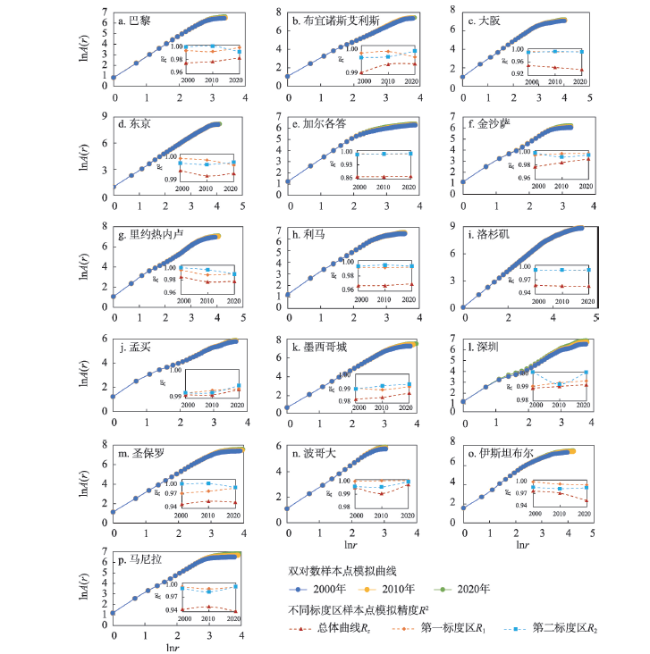
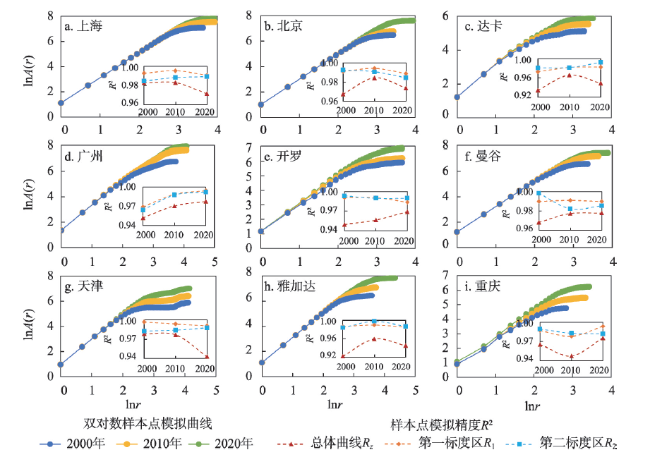
图3 规模稳定型城市用地面积—半径关系Fig. 3 Log-log plots of radius and urban land area in stable megacities |
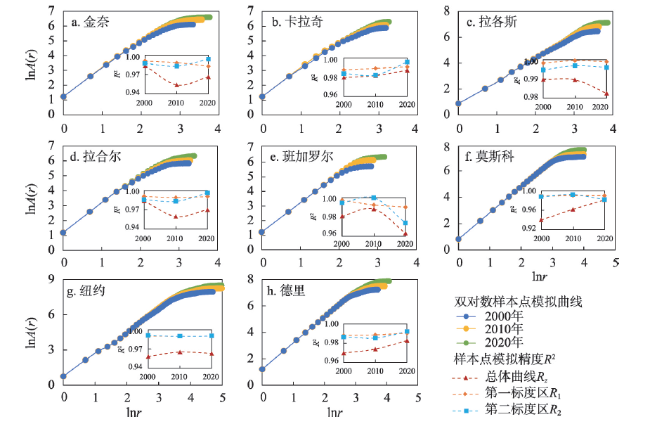
图4 缓慢扩张型城市用地面积—半径关系Fig. 4 Log-log plots of radius and urban land area in slowly expanded megacities |
图10 规模稳定型城市用地面积与城市人口关系Fig. 10 Relationship between urban land area and urban population in stable megacities |
图11 缓慢扩张型城市用地面积与城市人口关系Fig. 11 Relationship between urban land area and urban population in slowly expanded megacities |
| [1] |
|
| [2] |
|
| [3] |
|
| [4] |
United Nations. World urbanization prospects: The 2018 revision. https://www.un.org/development/desa/publications/2018-revision-of-world-urbanization-prospects.html.
|
| [5] |
|
| [6] |
|
| [7] |
|
| [8] |
|
| [9] |
|
| [10] |
|
| [11] |
|
| [12] |
|
| [13] |
[海凯, 王思远, 马元旭, 等. “一带一路”沿线地区城市扩张和形态变化分析. 地理学报, 2020, 75(10): 2092-2108.]
|
| [14] |
|
| [15] |
|
| [16] |
|
| [17] |
|
| [18] |
|
| [19] |
[宋长青, 程昌秀, 史培军. 新时代地理复杂性的内涵. 地理学报, 2018, 73(7): 1204-1213.]
|
| [20] |
|
| [21] |
|
| [22] |
|
| [23] |
|
| [24] |
|
| [25] |
|
| [26] |
|
| [27] |
|
| [28] |
|
| [29] |
[张凤, 陈彦光, 李晓松. 京津冀城市生长和形态的径向维数分析. 地理科学进展, 2019, 38(1): 65-76.]
|
| [30] |
[王琦安, 施建成, 柳钦火, 等. 全球生态环境遥感监测2020年度报告: 全球城市扩张与土地覆盖变化. http://www.chinageoss.cn/geoarc/2020.]
|
| [31] |
Worldpop. Open spatial demographic data and research. 2020. https://www.worldpop.org/.
|
| [32] |
|
| [33] |
[关兴良, 方创琳, 周敏, 等. 武汉城市群城镇用地空间扩展时空特征分析. 自然资源学报, 2012, 27(9): 1447-1459.]
|
| [34] |
|
| [35] |
|
| [36] |
|
| [37] |
|
| [38] |
United Nations. Sustainable development goals metadata repository-sdg indicator metadata: Format version 1.0. https://unstats.un.org/sdgs/metadata/files/Metadata-11-03-01.pdf.
|
| [39] |
[欧阳晓, 朱翔. 中国城市群城市用地扩张时空动态特征. 地理学报, 2020, 75(3): 571-588.]
|
| [40] |
|
| [41] |
|
| [42] |
|
| [43] |
|
| [44] |
|
/
| 〈 |
|
〉 |