
气象干旱对中亚棉花产量的影响
|
徐杨(1997-), 男, 辽宁大连人, 博士生, 主要从事农业气象研究。E-mail: xy_7912@163.com |
收稿日期: 2021-12-14
修回日期: 2022-08-11
网络出版日期: 2022-11-03
基金资助
第三次新疆综合科学考察项目(SQ2021xjkk0802)
中国科学院战略性先导科技专项(XDA20020202)
Effect of meteorological drought on cotton yield in Central Asia
Received date: 2021-12-14
Revised date: 2022-08-11
Online published: 2022-11-03
Supported by
The Third Xinjiang Scientific Expedition Program(SQ2021xjkk0802)
Strategic Priority Research Program of the Chinese Academy of Sciences(XDA20020202)
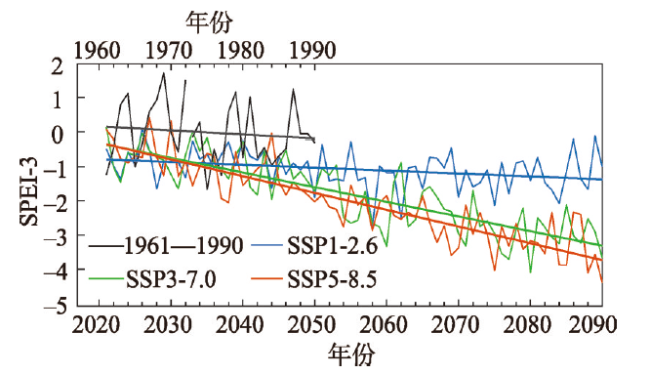
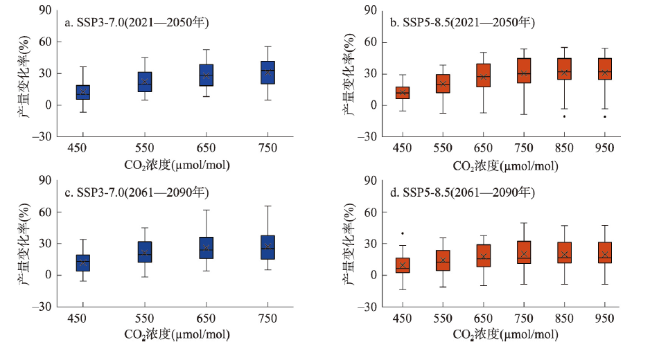
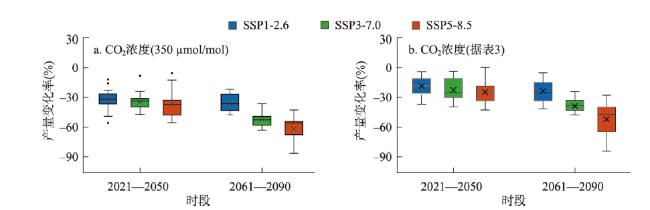
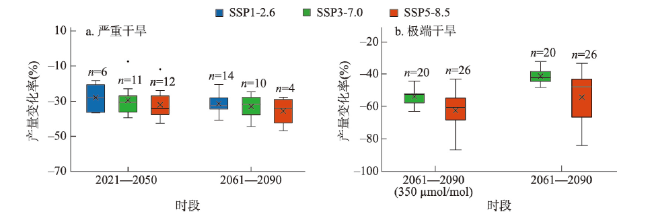
极端干旱事件频发对中亚棉花生产具有重要影响。本文利用乌兹别克斯坦赞格阿塔实验站棉花大田试验数据评估了APSIM-Cotton模型的适用性,根据CMIP6气候模式模拟的SSP1-2.6、SSP3-7.0和SSP5-8.5等3种共享社会经济路径下的气候变化数据集,分析了2021—2090年SPEI-3干旱指数的变化特征,进而利用APSIM-Cotton模型模拟了考虑CO2肥效作用的气象干旱对棉花产量的影响。结果表明:APSIM-Cotton模型能够准确模拟乌兹别克斯坦塔什干地区的生育期和产量变化趋势;未来塔什干地区呈现温度明显升高、干旱发生频率明显增加的特征;气象干旱将导致棉花产量下降,SSP1-2.6、SSP3-7.0和SSP5-8.5等3种排放情景下,严重气象干旱导致2021—2050年棉花产量较1961—1990年分别下降28.0%、29.6%和32.1%,2061—2090年棉花分别减产31.5%、33.1%和35.7%,在SSP3-7.0和SSP5-8.5情景下,极端气象干旱导致2061—2090年棉花产量分别下降41.3%和54.2%;CO2浓度升高可提高棉花产量,贡献率为14.9%~25.0%,但浓度达到750 µmol/mol以上时,棉花增产幅度将不再持续增加。
关键词: 气象干旱; 中亚; 棉花产量; APSIM; CMIP 6共享社会经济路径
徐杨 , 李秀芬 , 葛全胜 , 郝志新 . 气象干旱对中亚棉花产量的影响[J]. 地理学报, 2022 , 77(9) : 2338 -2352 . DOI: 10.11821/dlxb202209014
Frequent occurrence of extreme drought events has great impacts on cotton production in Central Asia. In this study, data from field experiments designed for different sowing densities and irrigation levels at the Zangiata experimental station in the Tashkent of Uzbekistan were adopted for calibration and validation. Using the CMIP6 climate change datasets for three shared socioeconomic pathways (SSP1-2.6, SSP3-7.0 and SSP5-8.5), we analyzed the variations in the standardized precipitation evapotranspiration index in three-month steps (SPEI-3) within the growing seasons from May to August during the period from 2021 to 2090 and simulated the changes in cotton yields under meteorological drought conditions using the APSIM-Cotton model considering CO2 fertilization. The results showed that the APSIM-Cotton model accurately simulated the cotton yield in Tashkent, and the relative errors between the simulated and measured yields were lower than 10.4% in both the calibration and validation years. Both temperature and drought frequency are expected to increase in the future during the cotton growing period in Tashkent. For the SSP3-7.0 and SSP5-8.5 scenarios, the percentages of severe drought are 36.7% and 40.0% from 2021 to 2050, respectively, and the percentages of extreme drought are 66.7% and 86.7% from 2061 to 2090, respectively. Severe meteorological droughts under three emission scenarios (SSP1-2.6, SSP3-7.0, and SSP5-8.5) would cause reductions of 28.0%, 29.6%, and 32.1% in cotton yields from 2021 to 2050, respectively, compared with the period 1961-1990. Severe meteorological droughts under the SSP1-2.6 scenario would result in a reduction of 31.5% in cotton yield from 2061-2090. Under the SSP3-7.0 and SSP5-8.5 scenarios, severe meteorological droughts would result in reductions of 33.1% and 35.7% in cotton yield, respectively, and extreme meteorological droughts would cause reductions of 41.3% and 54.2% in cotton yields, respectively. CO2 has a certain fertilization effect. The rise in CO2 concentration would increase the cotton yield by 14.9% to 25.0%; however, the increase in yields will not be sustained at concentrations above 750 µmol/mol. The results will provide scientific data for planting strategies for cotton in Central Asia that account for climate change and a reference for the future cooperation mode of the cotton industry between China and Central Asian countries.
表1 ISIMIP提供的5个气候模式基本信息Tab. 1 Brief information on the five GCMs from ISIMIP |
| 模式名称 | 所属机构及国家 | 分辨率(°N×°E) |
|---|---|---|
| GFDL-ESM4 | NOAA-GFDL 美国 | 1°×1.25° |
| UKESM1-0-LL | MOHC 英国 | 1.25°×1.875° |
| MPI-ESM1-2-HR | MPI-M 德国 | 0.9375°×0.9375° |
| IPSL-CM6A-LR | IPSL 法国 | 1.26°×2.5° |
| MRI-ESM2-0 | MRI 日本 | 1.125°×1.125° |
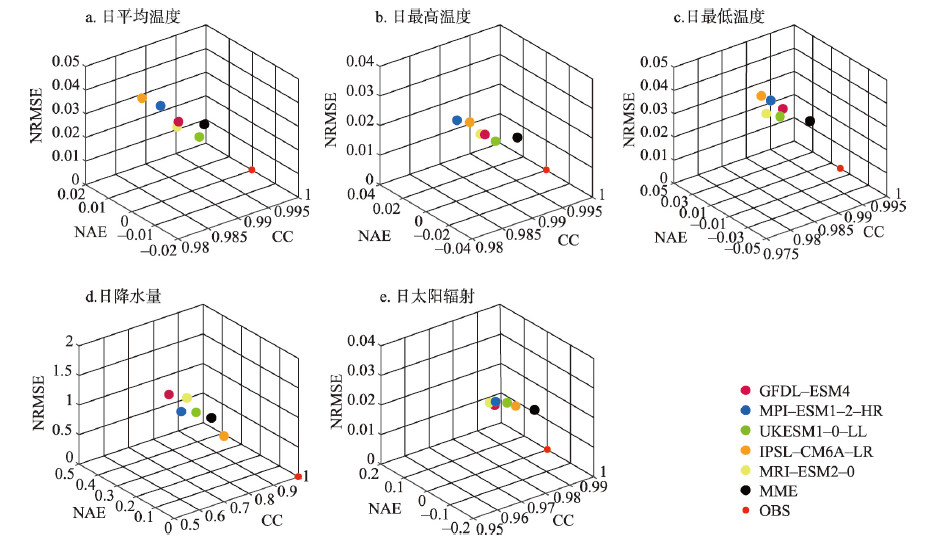
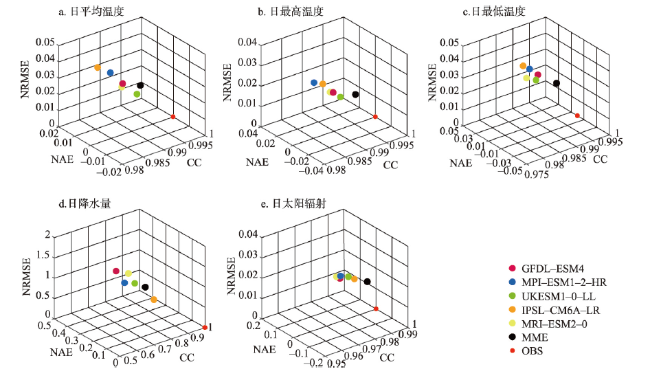
图1 1961—1990年5个气候模式模拟的塔什干地区日平均温度、日最高温度、日最低温度、日降水量和日太阳辐射变化相对于观测数据的DISO指数注:OBS代表观测场;点到OBS的距离代表DISO指数。 Fig. 1 DISO index program for daily mean temperature, daily maximum temperature, daily minimum temperature, daily precipitation, and daily solar radiation for the historical period of 1961-1990 |
表2 APSIM-Cotton模型调整的主要品种特征参数Tab. 2 Main calibrated cultivar parameters for APSIM-Cotton |
| 参数名称 | 定义 | 单位 | 校准值范围 | 参数值 |
|---|---|---|---|---|
| PERCENT_L | 衣分 | % | 35~45 | 42 |
| SCBOLL | 单铃籽棉重量 | g/boll | 3.8~7.0 | 6 |
| BCKGNDRETN | 棉铃保留的比例 | - | 0.2~1.0 | 0.9 |
| RESPCON | 呼吸常数 | - | 0.015~0.025 | 0.02306 |
| SQCON | 果节产生经验系数 | - | 0.01~0.03 | 0.0206 |
| FLAI | 叶面积指数修正值 | - | 0.5~1.0 | 0.87 |
| DDISQ | 播种到现蕾的有效积温(日温≥12 ℃) | d∙℃ | 300~450 | 450 |
| FRUDD1~8 | 蕾铃生长不同阶段所对应的有效积温(日温≥12 ℃) | d∙℃ | 与生育时段相关 | 60、210、380、405、510、620、795、930 |
表3 未来气候情景下2021—2090年大气CO2浓度设定(µmol/mol)Tab. 3 Atmospheric CO2 concentration settings for 2021-2090 under future climate scenarios (µmol/mol) |
| 时段 | SSP1-2.6 | SSP3-7.0 | SSP5-8.5 |
|---|---|---|---|
| 2021—2030年 | 430 | 437 | 437 |
| 2031—2040年 | 452 | 477 | 480 |
| 2041—2050年 | 466 | 522 | 537 |
| 2061—2070年 | 474 | 628 | 703 |
| 2071—2080年 | 471 | 690 | 815 |
| 2081—2090年 | 462 | 759 | 945 |
表4 塔什干棉花产量与生育期天数的验证结果Tab. 4 Calibration and validation results of cotton yield and growth period in Tashkent |
| 调参验证 | 播种密度 (万株/hm2) | 灌溉方式 | 灌溉量(mm) | 产量(kg/hm2) | 生育期天数(d) | ||||
|---|---|---|---|---|---|---|---|---|---|
| 实测值 | 模拟值 | 相对误差(%) | 实测值 | 模拟值 | 相对误差(%) | ||||
| 调参 | 9 | 滴灌 | 300 | 1750.0 | 1723.3 | -1.5 | 110 | 111 | 0.9 |
| 18 | 滴灌 | 300 | 2360.0 | 2114.9 | -10.4 | 109 | 110 | 0.9 | |
| 24 | 滴灌 | 300 | 2920.0 | 2799.0 | -4.1 | 110 | 113 | 2.7 | |
| 验证 | 14 | 沟灌 | 900 | 1386.2 | 1329.9 | -4.1 | 134 | 132 | -1.5 |
| 14 | 滴灌 | 275 | 1810.6 | 1950.5 | +7.7 | 127 | 124 | -2.4 | |
| 14 | 滴灌 | 160 | 1102.0 | 1063.6 | -3.5 | 124 | 125 | +0.8 | |
| 26 | 滴灌 | 275 | 2914.4 | 2739.4 | -6.0 | 127 | 121 | -4.7 | |
| 26 | 滴灌 | 160 | 1772.4 | 1882.7 | +6.2 | 124 | 121 | -2.4 | |
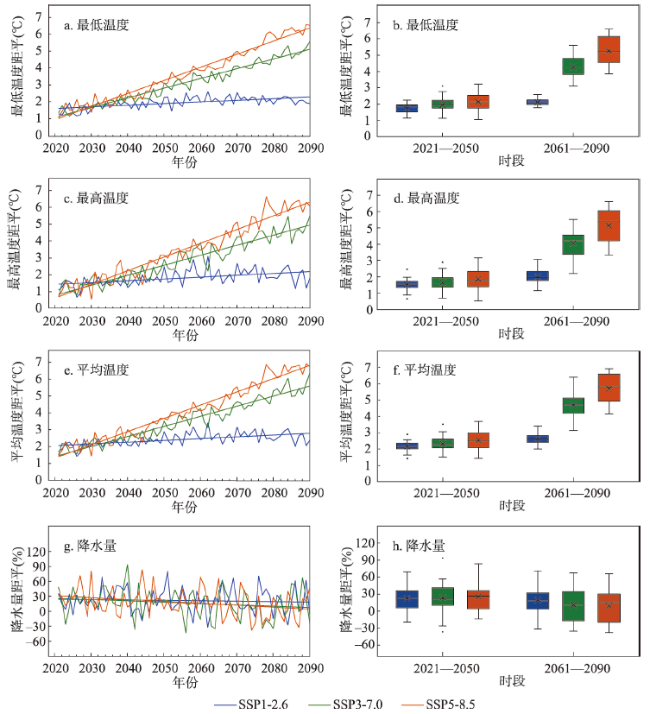
图3 1961—1990年和2021—2090年共享社会经济路径下棉花生育期最低、最高、平均温度和降水量变化注:图中粗实线为线性趋势;盒须图为2021—2050年和2061—2090年两个时段各变量的第1/4分位数、3/4分位数、最高值、最低值、中位数(—)、平均值(×)及异常值;每个盒须图包含样本量30个。 Fig. 3 Minimum temperature, maximum temperature, mean temperature and precipitation during the cotton growing season in the historical period of 1961-1990 and shared socioeconomic pathways of 2021-2090 |
表5 气候变量与棉花产量的逐步回归分析Tab. 5 Multiple linear regression analysis of climatic factors and cotton yield |
| 时段 | 1961—1990年 | 2021—2090年 | ||
|---|---|---|---|---|
| SSP1-2.6 | SSP3-7.0 | SSP5-8.5 | ||
| 回归预测方程 | Y=10820.5-351.3tas | Y=16598.5-419.7tas-8.5CO2 | Y=7392.1-166.1tasmax | Y=7972.7-231.3tas |
| 方差解释量(%) | 40.61 | 41.89 | 64.41 | 76.75 |
| 显著性 | P<0.001 | P<0.001 | P<0.001 | P<0.001 |
注:tas、tasmax分别表示棉花生育期内平均温度和最高温度,CO2表示相应年份的CO2浓度。 |
| [1] |
|
| [2] |
[陈亚宁, 李稚, 方功焕, 等. 气候变化对中亚天山山区水资源影响研究. 地理学报, 2017, 72(1): 18-26.]
|
| [3] |
[王力, 苗海民, 温雅. 中国与中亚五国棉花合作潜力分析及模式探究. 新疆大学学报(哲学·人文社会科学版), 2016, 44(5): 64-69.]
|
| [4] |
|
| [5] |
|
| [6] |
|
| [7] |
|
| [8] |
|
| [9] |
|
| [10] |
|
| [11] |
|
| [12] |
|
| [13] |
|
| [14] |
|
| [15] |
[陈玉梁, 石有太, 罗俊杰, 等. 干旱胁迫对彩色棉花农艺、品质性状和水分利用效率的影响. 作物学报, 2013, 39(11): 2074-2082.]
|
| [16] |
|
| [17] |
|
| [18] |
|
| [19] |
|
| [20] |
|
| [21] |
[陈超, 潘学标, 张立祯, 等. 气候变化对石羊河流域棉花生产和耗水的影响. 农业工程学报, 2011, 27(1): 57-65.]
|
| [22] |
|
| [23] |
|
| [24] |
|
| [25] |
|
| [26] |
|
| [27] |
|
| [28] |
|
| [29] |
|
| [30] |
|
| [31] |
|
| [32] |
|
| [33] |
|
| [34] |
|
| [35] |
|
| [36] |
|
| [37] |
|
| [38] |
|
| [39] |
|
| [40] |
[张乐园, 王弋, 陈亚宁. 基于SPEI指数的中亚地区干旱时空分布特征. 干旱区研究, 2020, 37(2): 331-340.]
|
| [41] |
|
| [42] |
|
| [43] |
|
| [44] |
|
| [45] |
|
| [46] |
|
| [47] |
|
| [48] |
[刘肖瑜, 张豆豆, 焦进宇, 等. 冬小麦—夏玉米周年农田资源高效利用限制因素分析. 中国农业科学, 2020, 53(19): 3900-3914.]
|
| [49] |
[王钧, 李广, 闫丽娟, 等. 旱地春小麦产量对不同生育阶段温度变化的响应模拟. 中国农业科学, 2020, 53(5): 904-916.]
|
| [50] |
|
| [51] |
|
| [52] |
|
| [53] |
|
| [54] |
|
| [55] |
|
| [56] |
|
| [57] |
[刘玉洁, 陶福禄. 气候变化对小麦生物量影响的概率预测和不确定性分析. 地理学报, 2012, 67(3): 337-345.]
|
| [58] |
[熊伟, 林而达, 蒋金荷, 等. 中国粮食生产的综合影响因素分析. 地理学报, 2010, 65(4): 397-406.]
|
| [59] |
|
| [60] |
|
| [61] |
|
/
| 〈 |
|
〉 |