
城市群水污染物排放的驱动因素及尺度效应
|
周侃(1986-), 男, 云南丽江人, 博士, 副研究员, 硕士生导师, 研究方向为资源环境承载力与空间治理。E-mail: zhoukan2008@126.com |
收稿日期: 2021-03-24
修回日期: 2022-03-15
网络出版日期: 2022-11-03
基金资助
国家自然科学基金项目(41971164)
中国科学院战略性先导科技专项(XDA23020101)
Driving factors and scale effects of water pollutant discharge in the urban agglomeration
Received date: 2021-03-24
Revised date: 2022-03-15
Online published: 2022-11-03
Supported by
National Natural Science Foundation of China(41971164)
Strategic Priority Research Program of the Chinese Academy of Sciences(XDA23020101)
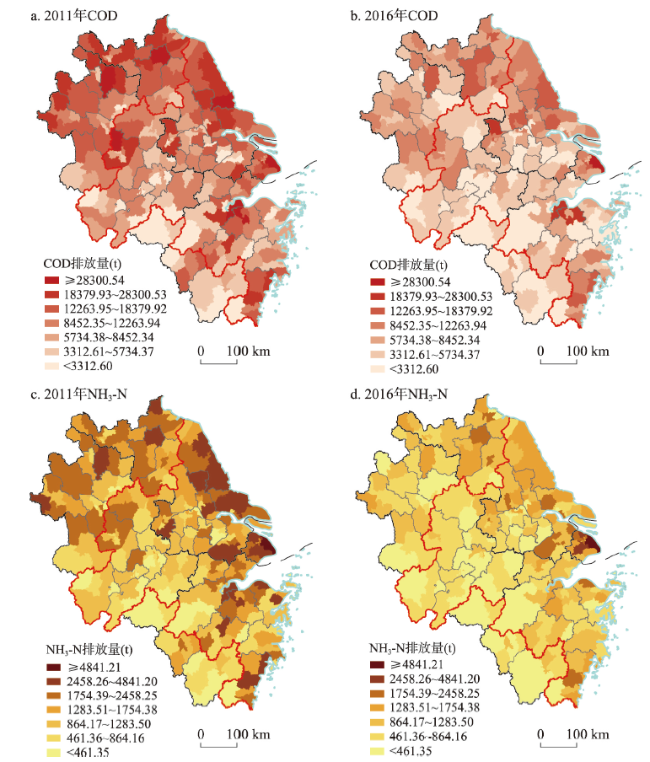
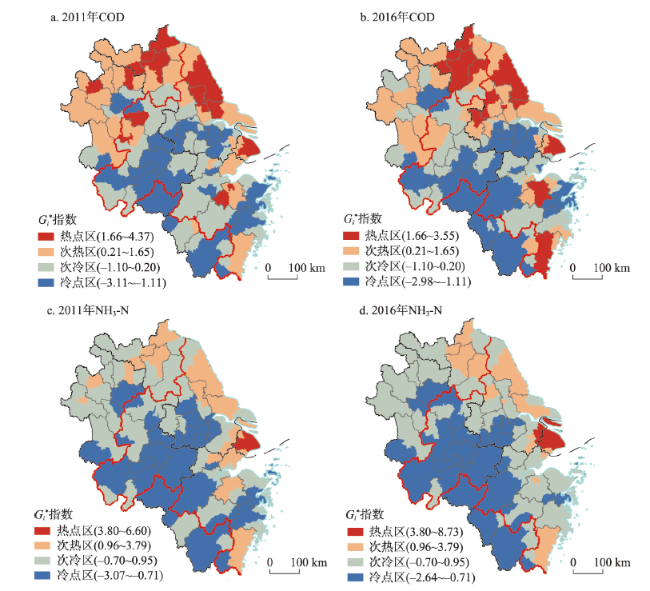
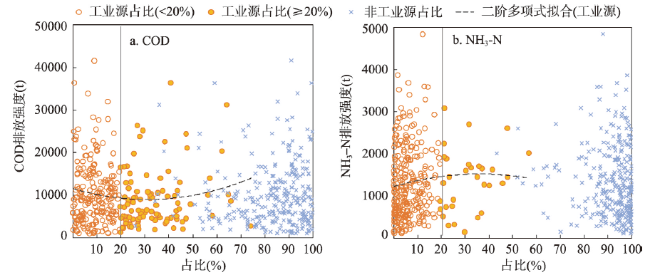
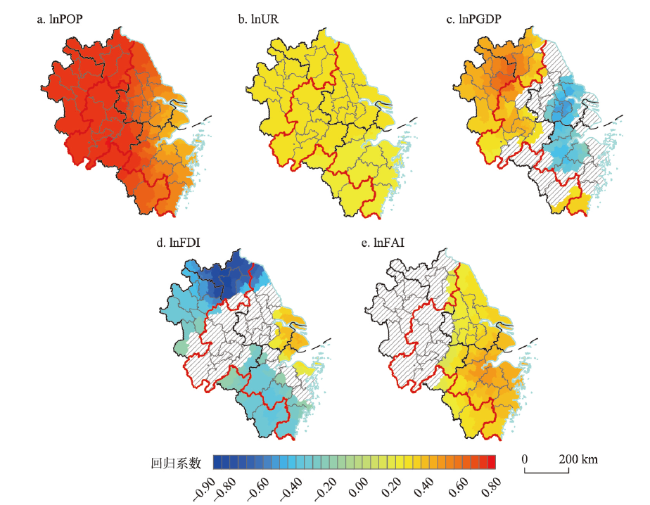
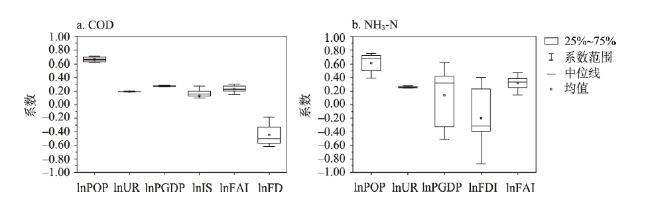
揭示水污染物排放的驱动因素及尺度效应是研究城市群演化环境效应的重要议题,也是实现城市群水污染物协同减排和水环境协同治理的重要前提。以长三角城市群的305个县域为例,选取化学需氧量(COD)和氨氮(NH3-N)两项特征污染物指标,在2011—2016年水污染物排放时空格局分析基础上,采用空间滞后模型(SLM)和空间误差模型(SEM)评估城市群水污染物排放的驱动因素,构建多尺度地理加权回归(MGWR)模型诊断驱动力的尺度效应及空间异质性。结果显示:常住人口规模、城镇化水平和经济发展水平对水污染物排放呈现全域层面的正向驱动,而工业化水平、社会固定资产投资、外商直接投资、地方财政分权程度以局部的微观作用为主;固定资产投资在杭嘉湖及沿海地区对COD和NH3-N排放均呈较强正向驱动,工业化水平在太湖流域及浙江全域对COD排放呈正向驱动;外商直接投资对NH3-N排放呈局部抑制作用,外资投入的“污染光环”效应在苏北、皖北、浙南等城市群边缘区较为突出;地方财政分权在城市群中心区对COD排放具有明显抑制作用,反映出地方环保意识提升和多层级环境规制强约束的积极影响。建议引导绿色生产生活方式以降低水污染物排放基数,在工业生产、资本投入和财政收支等领域嵌入环境倒逼机制,系统构建与水环境承载力相适应的城市群高质量发展格局。

周侃 , 殷悦 , 陈妤凡 . 城市群水污染物排放的驱动因素及尺度效应[J]. 地理学报, 2022 , 77(9) : 2219 -2235 . DOI: 10.11821/dlxb202209006
Revealing the driving factors and scale effects of water pollutant discharges is of great importance in the study of the environmental consequences of urban agglomeration evolution. It is also a prerequisite for ensuring collaborative water pollutant reduction and environmental governance in urban agglomerations. This study, taking 305 counties in the Yangtze River Delta (YRD) as an example, selects Chemical Oxygen Demand (COD) and Ammonia Nitrogen (NH3-N) as two distinctive pollutant indicators, and uses the Spatial Lag Model (SLM) and Spatial Error Model (SEM) to estimate the driving factors of water pollutant discharges in 2011 and 2016. Then the Multiscale Geographically Weighted Regression (MGWR) model is constructed to diagnose the scale effect and spatial heterogeneity of the driving factors. The findings show that the size of permanent population, the level of urbanization, and economic development level show positive global-scale impacts on water pollutant discharges, while the level of industrialization, social fixed assets investment, foreign direct investment, and local fiscal decentralization are dominated by micro impacts at the local scale. The spatial heterogeneity of local influencing factors mainly presents the following characteristics. Social fixed assets investment has a strong positive effect on both COD and NH3-N discharges in the Hangzhou-Jiaxing-Huzhou region and coastal area of the YRD; industrialization has a positive effect on COD discharges in the Taihu Lake basin and Zhejiang province; foreign direct investment has a local inhibitory effect on NH3-N discharge, and the "pollution halo" effect of foreign investment is more prominent in the marginal areas of the YRD such as northern Jiangsu, northern Anhui, and southern Zhejiang; local fiscal decentralization has a noticeable inhibitory effect on COD discharge in the central part of the YRD, reflecting the positive impacts of improved local environmental awareness and stronger constraints of multi-level environmental regulations in the urban agglomeration. Therefore, it is recommended to take green production and living style to reduce the discharge base of water pollutants, to embed environmental push-back mechanism in the fields of industrial production, capital investment and financial income and expenditure, and to establish systematically a high-quality development pattern of urban agglomerations that is compatible with the carrying capacity of the water environment.
表1 2016年长三角城市群水污染物排放量的区域比较Tab. 1 Regional comparison of water pollutant discharge in the Yangtze River Delta in 2016 |
| 地区 | COD | NH3-N | |||||
|---|---|---|---|---|---|---|---|
| 地区排放总量 (×104 t) | 全国排放总量占比(%) | 县域排放强度(t) | 地区排放总量 (×104 t) | 全国排放总量占比(%) | 县域排放强度(t) | ||
| 上海市 | 14.75 | 1.41 | 9219.18 | 3.84 | 2.71 | 2397.84 | |
| 江苏省 | 74.65 | 7.13 | 6785.98 | 10.28 | 7.25 | 934.24 | |
| 浙江省 | 46.14 | 4.41 | 4394.73 | 7.30 | 5.15 | 695.30 | |
| 安徽省 | 49.63 | 4.74 | 4205.99 | 5.63 | 3.97 | 477.51 | |
| 长三角 | 185.17 | 17.69 | 6071.21 | 27.05 | 19.08 | 886.84 | |
| 京津冀 | 60.16 | 5.75 | 3007.81 | 8.27 | 5.83 | 413.43 | |
| 珠三角 | 96.42 | 9.21 | 7903.33 | 14.39 | 10.15 | 1179.16 | |
表2 2016年主要解释变量的描述性统计Tab. 2 Descriptive statistics of the main explanatory variables in 2016 |
| 变量代码 | 变量说明 | 均值 | 标准差 | 最大值 | 最小值 | 预期正负向作用 |
|---|---|---|---|---|---|---|
| POP | 常住人口规模(×104人) | 68.37 | 41.54 | 295.77 | 7.62 | 正向 |
| UR | 城镇化水平(%) | 68.20 | 21.29 | 100.00 | 24.18 | 正向 |
| PGDP | 经济发展水平(元/人) | 85966.22 | 69992.29 | 422517.88 | 7544.21 | 正向或负向 |
| IS | 工业化水平(%) | 43.08 | 13.66 | 80.10 | 2.84 | 正向 |
| FDI | 外商直接投资额(万美元) | 258452.59 | 416389.60 | 1851378.00 | 6109.00 | 正向或负向 |
| FAI | 社会固定资产投资额(亿元) | 335.12 | 230.41 | 1825.74 | 8.98 | 正向 |
| FD | 地方财政分权程度(%) | 74.09 | 39.27 | 244.10 | 13.22 | 正向或负向 |
表3 模型空间相关性检验结果Tab. 3 Results of the spatial correlation test |
| 检验指标 | COD | NH3-N | ||||||||
|---|---|---|---|---|---|---|---|---|---|---|
| 2011年 | 2016年 | 2011年 | 2016年 | |||||||
| 统计量 | P值 | 统计量 | P值 | 统计量 | P值 | 统计量 | P值 | |||
| Moran's I (error) | 0.385 | <0.001 | 0.273 | <0.001 | 0.384 | <0.001 | 0.196 | <0.001 | ||
| LM-lag | 36.545 | <0.001 | 34.502 | <0.001 | 36.786 | <0.001 | 18.034 | <0.001 | ||
| Robust LM-lag | 5.547 | 0.019 | 8.728 | 0.003 | 4.415 | 0.036 | 3.539 | <0.001 | ||
| LM-error | 98.779 | <0.001 | 49.791 | <0.001 | 98.097 | <0.001 | 25.616 | <0.001 | ||
| Robust LM-error | 67.781 | <0.001 | 24.017 | <0.001 | 65.727 | <0.001 | 11.121 | 0.001 | ||
表4 SLM和SEM模型的检验与参数估计结果Tab. 4 Tests and parameter estimation of SLM and SEM models |
| 变量 | SLM(COD) | SEM(COD) | SLM(NH3-N) | SEM(NH3-N) | |||||||
|---|---|---|---|---|---|---|---|---|---|---|---|
| 2011年 | 2016年 | 2011年 | 2016年 | 2011年 | 2016年 | 2011年 | 2016年 | ||||
| lnPOP | 0.915*** | 0.756*** | 0.987*** | 0.904*** | 0.893*** | 0.738*** | 0.953*** | 0.851*** | |||
| (16.251) | (10.510) | (19.320) | (12.628) | (18.168) | (10.729) | (21.345) | (12.451) | ||||
| lnUR | 0.097 | 0.507*** | 0.103 | 0.587*** | 0.122* | 0.431*** | 0.152** | 0.516*** | |||
| (1.337) | (7.494) | (1.366) | (7.780) | (1.939) | (6.691) | (2.319) | (7.269) | ||||
| lnPGDP | 0.244** | 0.060** | 0.371*** | 0.077*** | 0.194*** | 0.072*** | 0.277*** | 0.077*** | |||
| (4.800) | (2.351) | (6.867) | (2.599) | (4.429) | (2.895) | (5.887) | (2.742) | ||||
| lnIS | 0.329*** | 0.099 | 0.292*** | 0.276*** | 0.012 | -0.153** | 0.033 | -0.051 | |||
| (5.181) | (1.498) | (4.676) | (3.840) | (0.218) | (-2.479) | (0.601) | (-0.748) | ||||
| lnFAI | 0.079 | 0.292*** | 0.068 | 0.190*** | 0.056 | 0.252*** | 0.098** | 0.211*** | |||
| (1.423) | (4.298) | (1.278) | (2.589) | (1.216) | (3.854) | (2.122) | (2.976) | ||||
| lnFDI | -0.094*** | -0.092*** | -0.076** | -0.037 | -0.072** | -0.076*** | -0.085*** | -0.060* | |||
| (-3.584) | (-3.346) | (-2.174) | (-1.074) | (-3.173) | (-2.863) | (-2.845) | (-1.895) | ||||
| lnFD | -0.231*** | -0.378*** | -0.184** | -0.313*** | -0.005 | -0.142** | -0.010 | -0.111 | |||
| (-3.487) | (-5.088) | (-2.424) | (-3.693) | (-0.089) | (-1.982) | (-0.155) | (-1.392) | ||||
| 空间滞后项(ρ) | 0.187*** | 0.211*** | 0.199*** | 0.177*** | |||||||
| (6.023) | (5.791) | (5.993) | (4.188) | ||||||||
| 空间误差项(λ) | 0.621*** | 0.482*** | 0.616*** | 0362*** | |||||||
| (13.119) | (7.739) | (11.897) | (5.186) | ||||||||
| R2 | 0.643 | 0.518 | 0.736 | 0.559 | 0.711 | 0.588 | 0.778 | 0.606 | |||
| 对数似然函数值(logL) | -196.091 | -228.885 | -165.174 | -216.408 | -156.995 | -222.573 | -127.067 | -221.332 | |||
| 赤池信息量准则(AIC) | 410.181 | 475.770 | 346.348 | 448.815 | 330.708 | 463.146 | 270.135 | 452.261 | |||
| 施瓦兹准则(SC) | 443.664 | 509.253 | 376.111 | 478.578 | 364.191 | 496.629 | 299.897 | 482.023 | |||
注:*** p < 0.01, ** p < 0.05, * p < 0.1,括号内为t统计量。 |
表5 GWR和MGWR模型性能对比Tab. 5 Comparison of model performance of GWR and MGWR |
| 模型指标 | GWR(COD) | MGWR(COD) | GWR(NH3-N) | MGWR(NH3-N) |
|---|---|---|---|---|
| 拟合优度 | 0.597 | 0.649 | 0.657 | 0.683 |
| AICc值 | 625.636 | 592.088 | 579.324 | 556.884 |
| 残差平方和 | 110.933 | 94.264 | 93.571 | 86.361 |
表6 MGWR模型估计的驱动因素带宽Tab. 6 Bandwidth of the driving factors estimated by MGWR model |
| 变量 | MGWR(COD) | 变量 | MGWR(NH3-N) | ||||
|---|---|---|---|---|---|---|---|
| 带宽 | 全局占比(%) | 指示尺度 | 带宽 | 全局占比(%) | 指示尺度 | ||
| lnPOP | 297 | 97.38 | 全局 | lnPOP | 178 | 58.36 | 全局 |
| lnUR | 304 | 99.67 | 全局 | lnUR | 304 | 99.67 | 全局 |
| lnPGDP | 304 | 99.67 | 全局 | lnPGDP | 51 | 16.72 | 局部 |
| lnIS | 140 | 45.90 | 局部 | lnFDI | 75 | 24.59 | 局部 |
| lnFAI | 116 | 38.03 | 局部 | lnFAI | 137 | 44.92 | 局部 |
| lnFD | 95 | 31.15 | 局部 | GWR固定带宽 | 89 | 29.18 | - |
| GWR固定带宽 | 155 | 50.82 | - | ||||
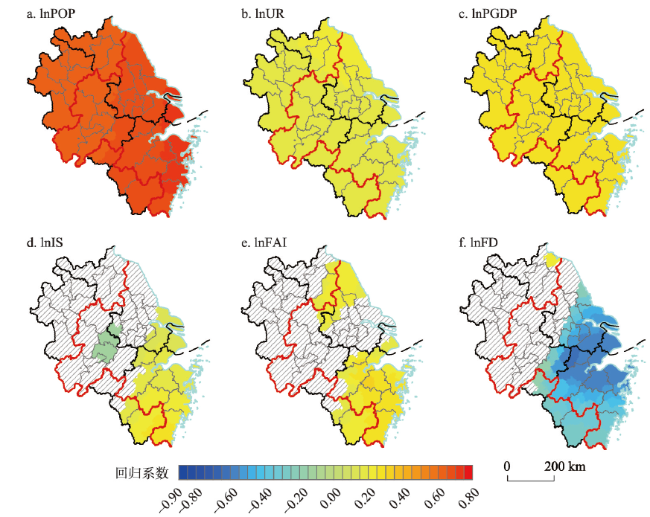
图5 COD排放驱动因素的回归系数空间分布注:将各因素回归系数不显著(p>0.1)的县域用斜线填充显示。 Fig. 5 Spatial distribution of regression coefficients of the driving factors of COD discharge |
| [1] |
[方创琳. 中国城市群研究取得的重要进展与未来发展方向. 地理学报, 2014, 69(8): 1130-1144.]
|
| [2] |
[樊杰, 赵艳楠. 面向现代化的中国区域发展格局: 科学内涵与战略重点. 经济地理, 2021, 41(1): 1-9.]
|
| [3] |
|
| [4] |
|
| [5] |
[周侃, 李会, 申玉铭. 京津冀地区县域环境胁迫时空格局及驱动因素. 地理学报, 2020, 75(9): 1934-1947.]
|
| [6] |
|
| [7] |
|
| [8] |
[方创琳, 王振波, 马海涛. 中国城市群形成发育规律的理论认知与地理学贡献. 地理学报, 2018, 73(4): 651-665.]
|
| [9] |
[姚士谋, 周春山, 王德, 等. 中国城市群新论. 北京: 科学出版社, 2016.]
|
| [10] |
|
| [11] |
|
| [12] |
[彭梦杰, 柳力玮, 周毓文, 等. 山东半岛城市群空间结构演化的大气环境效应研究. 环境与发展, 2020, 32(5): 8-9, 11.]
|
| [13] |
|
| [14] |
|
| [15] |
[陆小成. 世界级城市群、雾霾治理与京津冀低碳发展研究进展: 基于中国知网文献的计量分析. 企业经济, 2021, 40(2): 14-23.]
|
| [16] |
|
| [17] |
|
| [18] |
[范志平, 刘建治, 赵悦, 等. 蒲河水质空间异质性特征及其对流域土地利用方式的响应. 生态学杂志, 2018, 37(4): 1144-1151.]
|
| [19] |
|
| [20] |
[程曦. 太湖水质变化与经济发展关系研究: 基于环境库兹涅茨曲线(EKC)方法. 环境与可持续发展, 2012, 37(5): 73-77.]
|
| [21] |
|
| [22] |
[郭承龙, 张智光. 长三角地区环境库兹涅茨曲线探讨: 基于苏浙沪的分析. 科技管理研究, 2017, 37(24): 227-233.]
|
| [23] |
|
| [24] |
|
| [25] |
|
| [26] |
|
| [27] |
|
| [28] |
[于忠华, 李文青, 刘海滨, 等. 快速发展地区经济增长与资源环境协调性分析: 以南京为例. 长江流域资源与环境, 2015, 24(10): 1698-1704.]
|
| [29] |
|
| [30] |
|
| [31] |
[廖显春, 夏恩龙. 为什么中国会对FDI具有吸引力? 基于环境规制与腐败程度视角. 世界经济研究, 2015(1): 112-119, 129.]
|
| [32] |
[金春雨, 王伟强. “污染避难所假说”在中国真的成立吗: 基于空间VAR模型的实证检验. 国际贸易问题, 2016(8): 108-118.]
|
| [33] |
|
| [34] |
[盛斌, 吕越. 外国直接投资对中国环境的影响: 来自工业行业面板数据的实证研究. 中国社会科学, 2012(5): 54-75, 205-206.]
|
| [35] |
[周杰琦, 夏南新, 梁文光. 外资进入、 自主创新与雾霾污染: 来自中国的证据. 研究与发展管理, 2019, 31(2): 78-90.]
|
| [36] |
State Council of the People's Republic of China. Outline of the Yangtze River Delta Regional Integrated Development Plan. 2019-12-01.
[中华人民共和国国务院. 长江三角洲区域一体化发展规划纲要. 2019-12-01.]
|
| [37] |
|
| [38] |
[蒋伟, 赖明勇. 空间相关与外商直接投资区位决定: 基于中国城市数据的空间计量分析. 财贸研究, 2009, 20(6): 1-6.]
|
| [39] |
|
| [40] |
|
| [41] |
|
| [42] |
|
| [43] |
[罗谷松, 李涛. 碳排放影响下的中国省域土地利用效率差异动态变化与影响因素. 生态学报, 2019, 39(13): 4751-4760.]
|
| [44] |
[文贯中, 柴毅. 政府主导型城市化的土地利用效率: 来自中国的实证结果. 学术月刊, 2015, 47(1): 11-23.]
|
| [45] |
[沈坤荣, 付文林. 中国的财政分权制度与地区经济增长. 管理世界, 2005(1): 31-39, 171-172.]
|
| [46] |
|
| [47] |
[张华, 丰超, 刘贯春. 中国式环境联邦主义: 环境分权对碳排放的影响研究. 财经研究, 2017, 43(9): 33-49.]
|
| [48] |
[徐辉, 杨烨, 聂都. 财政分权对中国十大城市群环境污染的影响路径. 城市问题, 2017(6): 14-24.]
|
| [49] |
[薄文广, 徐玮, 王军锋. 地方政府竞争与环境规制异质性: 逐底竞争还是逐顶竞争? 中国软科学, 2018(11): 76-93.]
|
/
| 〈 |
|
〉 |