
长三角工业经济规模与污染排放异速关系及互动机制
|
尹上岗(1993-), 男, 安徽太和人, 博士生, 研究方向为城市地理与区域发展。E-mail: yinshanggang@163.com |
收稿日期: 2021-04-06
修回日期: 2022-03-31
网络出版日期: 2022-11-03
基金资助
国家自然科学基金项目(42171200)
国家自然科学基金项目(41771171)
The allometric relationship and interactive mechanism between the size of industrial economies and the emissions of industrial pollution in the Yangtze River Delta
Received date: 2021-04-06
Revised date: 2022-03-31
Online published: 2022-11-03
Supported by
National Natural Science Foundation of China(42171200)
National Natural Science Foundation of China(41771171)
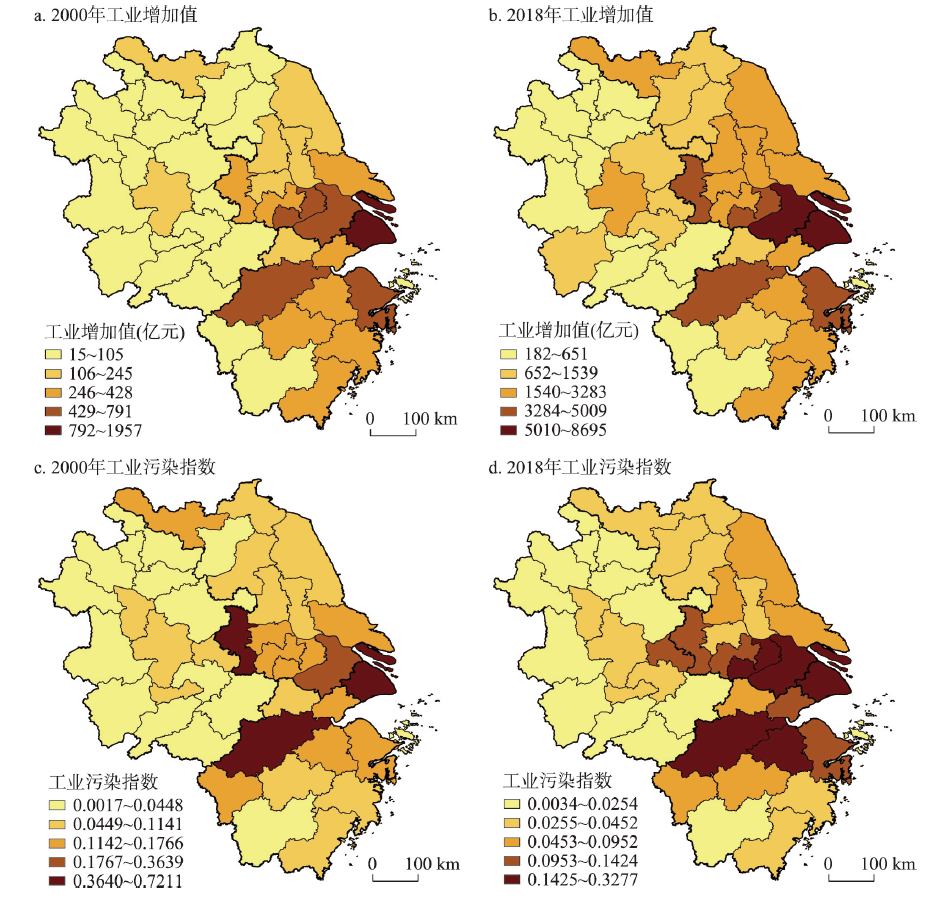
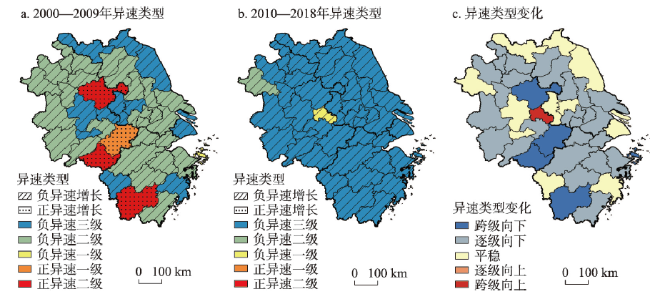
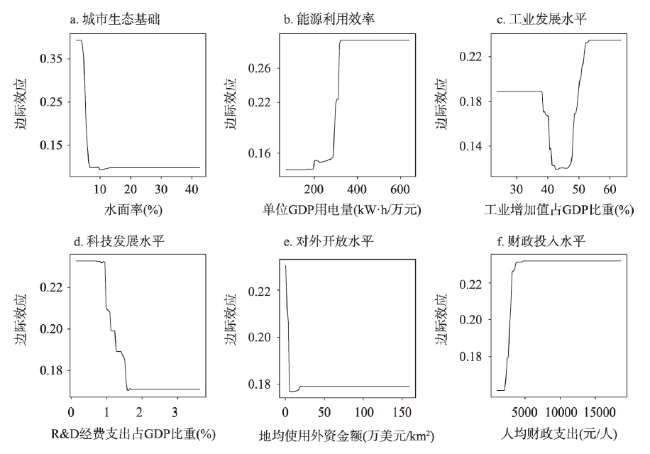
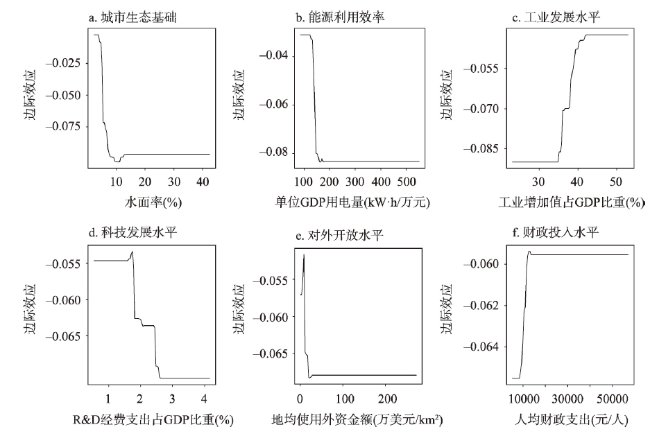
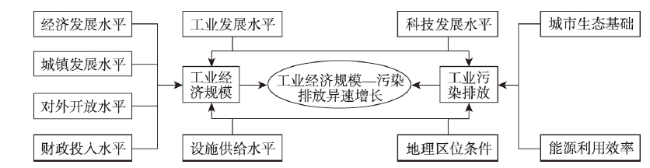
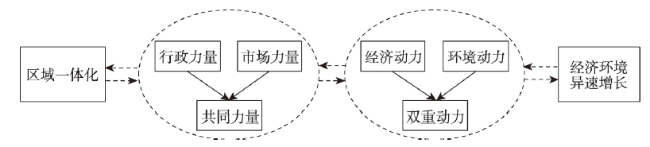
正确处理经济增长与环境污染关系是实现区域高质量发展和构建“双循环”新发展格局的关键问题。本文以2000—2018年长三角地区工业经济规模与工业污染指数为研究对象,构建工业经济规模—污染排放异速增长模型,分析两者关系的时空变化规律,并借助增强回归树模型探究异速增长的影响机制。结果表明:① 长三角地区工业经济规模与工业污染指数空间格局具有较强的稳定性和较高的相似性,呈现出由东向西递减的空间态势;随着工业经济规模的扩大,工业污染指数总体呈下降趋势。② 在纵向异速上,长三角地区总体沿着经济环境基本协调—经济扩张弱型—经济环境基本协调变化;在横向异速上,多数城市工业污染指数相对增速低于工业经济规模增速,标度指数多呈下降趋势。③ 城市生态基础、能源利用效率、工业发展水平、科技发展水平、对外开放水平和财政投入水平是影响异速增长的主导因子,这些因素在前期对异速增长具有正向影响,后期转变为负向影响。④ 经济增长的市场主导与环境保护的政府主导间的错位关系产生经济环境异速增长,并促使区域一体化出现,区域一体化与经济环境异速增长相互促进、相互影响。推动长三角地区经济生态一体化建设,实现绿水青山与金山银山的有机统一,是实现区域高质量发展的必由之路。
尹上岗 , 杨山 , 龚海波 . 长三角工业经济规模与污染排放异速关系及互动机制[J]. 地理学报, 2022 , 77(9) : 2202 -2218 . DOI: 10.11821/dlxb202209005
Clarifying the link between economic growth and environmental pollution is an essential issue to achieve regional high-quality development and establish "dual circulation" development patterns. Using the size of industrial economies and industrial pollution index in the Yangtze River Delta (YRD) region during 2000-2018 as the research object, this study constructs allometric growth models based on the size of industrial economies and industrial pollution index to reveal their spatio-temporal changes. We also investigate the influence mechanism of allometric growth using a boosted regression tree model. The results showed that: (1) The spatial pattern of the size of industrial economies and industrial pollution index in the study region has strong stability and high similarity, demonstrating a decreasing trend from east to west. Moreover, the industrial pollution index shows a decreasing trend with the increase in the size of industrial economies. (2) In terms of the vertical direction, the allometric growth in the YRD changes along with the pattern of the economic environment coordinated basically-the weak economic expansion-the economic environment coordinated basically. For the horizontal direction, the rate of industrial pollution index is lower than the size growth rate of the industrial economy and shows a downward trend in most of the cities. (3) Urban ecological foundation, energy efficiency, industrial development level, technological development level, opening-up level and financial investment level are the main factors affecting allometric growth, and these factors have positive impacts on allometric growth in the early stage, while turn into negative impacts during the later stage. (4) The misaligned relationship between market-driven economic growth and government-driven environmental protection induces the allometric growth of the economy and environment, and promotes regional integration. Regional integration and the allometric growth of the economic environment promote each other. Promoting economic and ecological integration in the YRD, as well as realizing the coordination of lucid waters-lush mountains and mountains of gold and silver, is the only way to accomplish regional high-quality development.
表1 工业经济规模—污染排放异速关系的协调性分级表Tab. 1 The coordination classification of allometric growth relationship between the size of industrial economies and the emissions of industrial pollution |
| 异速增长类型 | 异速级别 | 划分标准 | 异速关系类型 | 异速关系特征 |
|---|---|---|---|---|
| 正异速生长 | 正异速3级 | 3 ≤ b | 污染扩张强型 | 污染排放相对增长速度远远高于工业经济规模相对增长速度 |
| 正异速2级 | 1 ≤ b<3 | 污染扩张弱型 | 污染排放相对增长速度高于工业经济规模相对增长速度 | |
| 正异速1级 | 0.85 ≤ b<1 | 经济环境基本协调 | 污染排放相对增长速度稍高于工业经济规模相对增长速度 | |
| 负异速生长 | 负异速1级 | 0.5 ≤ b<0.85 | 经济扩张弱型 | 污染排放相对增长速度低于工业经济规模相对增长速度 |
| 负异速2级 | 0 ≤ b<0.5 | 经济扩张强型 | 污染排放相对增长速度远远低于工业经济规模相对增长速度 | |
| 负异速3级 | b<0 | 经济环境有所收缩 | 污染排放和工业经济规模其中一个减少或同时减少 |
表2 2000—2018年长三角工业经济规模—污染排放异速增长拟合模型Tab. 2 Fitting model of allometric growth between the size of industrial economies and the emissions of industrial pollution in the Yangtze River Delta during 2000-2018 |
| 年份 | 拟合方程 | 标度指数 | 拟合优度 | 异速级别 |
|---|---|---|---|---|
| 2000 | lnD=-3.3321+0.8611lnE | 0.8611 | 0.7067 | 正异速1级 |
| 2001 | lnD=-3.6933+0.8869lnE | 0.8869 | 0.7248 | 正异速1级 |
| 2002 | lnD=-3.4535+0.8654lnE | 0.8654 | 0.7365 | 正异速1级 |
| 2003 | lnD=-3.7496+0.8735lnE | 0.8735 | 0.7623 | 正异速1级 |
| 2004 | lnD=-3.1888+0.8250lnE | 0.8250 | 0.7630 | 负异速1级 |
| 2005 | lnD=-3.2923+0.8289lnE | 0.8289 | 0.7738 | 负异速1级 |
| 2006 | lnD=-2.9271+0.7977lnE | 0.7977 | 0.7584 | 负异速1级 |
| 2007 | lnD=-3.1206+0.8008lnE | 0.8008 | 0.7731 | 负异速1级 |
| 2008 | lnD=-3.8566+0.7956lnE | 0.7956 | 0.7379 | 负异速1级 |
| 2009 | lnD=-3.2194+0.7903lnE | 0.7903 | 0.6744 | 负异速1级 |
| 2010 | lnD=-4.4946+0.8627lnE | 0.8627 | 0.7312 | 正异速1级 |
| 2011 | lnD=-4.3899+0.8462lnE | 0.8462 | 0.7423 | 负异速1级 |
| 2012 | lnD=-5.5241+0.9085lnE | 0.9085 | 0.7561 | 正异速1级 |
| 2013 | lnD=-5.2054+0.8835lnE | 0.8835 | 0.7597 | 正异速1级 |
| 2014 | lnD=-4.6676+0.8434lnE | 0.8434 | 0.7230 | 负异速1级 |
| 2015 | lnD=-4.3140+0.8216lnE | 0.8216 | 0.7210 | 负异速1级 |
| 2016 | lnD=-6.7816+0.9558lnE | 0.9558 | 0.7716 | 正异速1级 |
| 2017 | lnD=-6.9398+0.9497lnE | 0.9497 | 0.7297 | 正异速1级 |
| 2018 | lnD=-7.6318+0.9852lnE | 0.9852 | 0.7368 | 正异速1级 |
表3 异速增长的影响因素Tab. 3 Driving factors of allometric growth |
| 影响因素 | 具体指标 | 计算方法 | 单位 |
|---|---|---|---|
| 经济发展水平 | 人均GDP | 地区生产总值/常住人口 | 元/人 |
| 工业发展水平 | 工业增加值占GDP比重 | 工业增加值/地区生产总值 | % |
| 科技发展水平 | R&D经费支出占GDP比重 | R&D经费支出/地区生产总值 | % |
| 城镇发展水平 | 常住人口城镇化率 | 城镇人口/常住人口 | % |
| 对外开放水平 | 地均使用外资金额 | 实际使用外资金额/行政区面积 | 万美元/km2 |
| 城市生态基础 | 水面率 | 城市水域面积/行政区面积 | % |
| 设施供给水平 | 市政公用设施建设投资比重 | 市政公用设施建设投资/社会固定资产投资 | % |
| 财政投入水平 | 人均财政支出 | 地方财政支出/常住人口 | 元/人 |
| 能源利用效率 | 单位GDP用电量 | 全社会用电量/地区生产总值 | kW·h/万元 |
| 地理区位条件 | 地理相对位置 | 核心区①、中心区②和非中心区③分别赋值1、2、3 | - |
注:① 2010年颁布的《长江三角洲地区区域规划》指出,长三角核心区为上海、南京、苏州、无锡、常州、镇江、扬州、泰州、南通、杭州、宁波、湖州、嘉兴、绍兴、舟山、台州16个城市;② 2019年印发的《长江三角洲区域一体化发展规划纲要》指出,长三角中心区为上海、南京、无锡、常州、苏州、南通、扬州、镇江、盐城、泰州、杭州、宁波、温州、湖州、嘉兴、绍兴、金华、舟山、台州、合肥、芜湖、马鞍山、铜陵、安庆、滁州、池州、宣城27个城市,本文中心区(不含核心区)为27个城市除核心区外的11个城市;③ 非中心区为三省一市除核心区、中心区(不含核心区)外剩余的14个城市。 |
表4 各因素对异速增长的贡献率及其排名Tab. 4 Relative contribution and its ranking of each factor to allometric growth |
| 影响因素 | 2000—2009年 | 2010—2018年 | 2000—2018年 | |||||
|---|---|---|---|---|---|---|---|---|
| 贡献率(%) | 贡献率排名 | 贡献率(%) | 贡献率排名 | 贡献率(%) | 贡献率排名 | |||
| 经济发展水平 | 1.69 | 9 | 1.57 | 7 | 1.49 | 9 | ||
| 工业发展水平 | 15.81 | 3 | 16.33 | 2 | 15.76 | 3 | ||
| 科技发展水平 | 6.37 | 4 | 6.82 | 4 | 5.86 | 5 | ||
| 城镇发展水平 | 2.99 | 7 | 2.62 | 6 | 3.72 | 6 | ||
| 对外开放水平 | 5.91 | 5 | 6.01 | 5 | 6.14 | 4 | ||
| 城市生态基础 | 42.56 | 1 | 47.72 | 1 | 44.36 | 1 | ||
| 设施供给水平 | 2.19 | 8 | 0.95 | 9 | 1.58 | 8 | ||
| 财政投入水平 | 5.22 | 6 | 1.39 | 8 | 3.66 | 7 | ||
| 能源利用效率 | 16.70 | 2 | 16.07 | 3 | 16.75 | 2 | ||
| 地理区位条件 | 0.56 | 10 | 0.52 | 10 | 0.68 | 10 | ||
| [1] |
[方创琳. 中国城市群研究取得的重要进展与未来发展方向. 地理学报, 2014, 69(8): 1130-1144.]
|
| [2] |
[金春雨, 吴安兵. 工业经济结构、经济增长对环境污染的非线性影响. 中国人口·资源与环境, 2017, 27(10): 64-73.]
|
| [3] |
|
| [4] |
[张国俊, 王珏晗, 吴坤津, 等. 中国三大城市群经济与环境协调度时空特征及影响因素. 地理研究, 2020, 39(2): 272-288.]
|
| [5] |
|
| [6] |
|
| [7] |
|
| [8] |
[盖美, 胡杭爱, 柯丽娜. 长江三角洲地区资源环境与经济增长脱钩分析. 自然资源学报, 2013, 28(2): 185-198.]
|
| [9] |
[邹辉, 段学军. 长江经济带经济—环境协调发展格局及演变. 地理科学, 2016, 36(9): 1408-1417.]
|
| [10] |
|
| [11] |
[周静, 杨桂山. 江苏省工业废水排放与经济增长的动态关系. 地理研究, 2007, 26(5): 931-939.]
|
| [12] |
[陈桂月, 李海涛, 梁涛. 山西省工业废弃物排放与经济增长之间的关系分析. 资源科学, 2013, 35(6): 1184-1193.]
|
| [13] |
|
| [14] |
[闫兰玲, 徐海岚, 唐伟, 等. 城市大气污染物排放与产业发展关系研究: 基于杭州市EKC曲线的实证分析. 中国人口·资源与环境, 2014, 24(增刊2): 147-150.]
|
| [15] |
[樊庆锌, 丁达, 冯喆, 等. 哈尔滨市人均GDP和大气污染的关系研究. 干旱区资源与环境, 2016, 30(5): 71-77.]
|
| [16] |
|
| [17] |
[魏龙, 潘安. 出口贸易和FDI加剧了资源型城市的环境污染吗? 基于中国285个地级城市面板数据的经验研究. 自然资源学报, 2016, 31(1): 17-27.]
|
| [18] |
|
| [19] |
|
| [20] |
[周侃, 樊杰. 中国环境污染源的区域差异及其社会经济影响因素: 基于339个地级行政单元截面数据的实证分析. 地理学报, 2016, 71(11): 1911-1925.]
|
| [21] |
[李花, 赵雪雁, 王伟军, 等. 基于多尺度的中国城市工业污染时空分异及影响因素. 地理研究, 2019, 38(8): 1993-2007.]
|
| [22] |
|
| [23] |
[贾卓, 强文丽, 王月菊, 等. 兰州—西宁城市群工业污染集聚格局及其空间效应. 经济地理, 2020, 40(1): 68-75, 84.]
|
| [24] |
[张同斌, 李金凯, 程立燕. 经济结构、 增长方式与环境污染的内在关联研究: 基于时变参数向量自回归模型的实证分析. 中国环境科学, 2016, 36(7): 2230-2240.]
|
| [25] |
|
| [26] |
[章渊, 吴凤平. 基于LMDI方法我国工业废水排放分解因素效应考察. 产业经济研究, 2015, 14(6): 99-110.]
|
| [27] |
[段晓峰, 许学工. 山东省污染物排放与经济发展水平的关系. 地理科学进展, 2010, 29(3): 342-346.]
|
| [28] |
[王兵, 刘光天. 节能减排约束下经济增长动力探究: 基于BDDFM的实证研究. 经济问题, 2015, 37(10): 7-13, 39.]
|
| [29] |
[张郴, 黄震方, 张捷, 等. 基于机器学习的南京市旅游地个性及其文化景观表征. 地理学报, 2017, 72(10): 1886-1903.]
|
| [30] |
[张跃, 王图展, 刘莉. 中国市域工业污染对劳动力集聚的影响研究. 地理科学, 2019, 39(10): 1654-1662.]
|
| [31] |
[吴加伟, 陈雯, 耿佩, 等. 经济转型背景下工业污染时空格局演变及其驱动因素研究: 以长江三角洲地区为例. 长江流域资源与环境, 2020, 29(3): 535-546.]
|
| [32] |
[姜晓艳, 吴相利. 林业资源型城市生态—经济—社会协调发展的定量测度: 以黑龙江省伊春市为例. 生态学报, 2021, 41(21): 8396-8407.]
|
| [33] |
|
| [34] |
[陈彦光. 城市异速标度研究的起源、困境和复兴. 地理研究, 2013, 32(6): 1033-1045.]
|
| [35] |
|
| [36] |
|
| [37] |
[李郇, 陈刚强, 许学强. 中国城市异速增长分析. 地理学报, 2009, 64(4): 399-407.]
|
| [38] |
[孙在宏, 袁源, 王亚华, 等. 基于分形理论的江苏省城市规模分布与异速生长特征. 地理研究, 2011, 30(12): 2163-2172.]
|
| [39] |
[马玉香, 张军民, 王莉红. 基于分形理论的新疆城市规模分布及异速生长特征研究. 干旱区地理, 2018, 41(3): 661-667.]
|
| [40] |
|
| [41] |
[李春林, 刘淼, 胡远满, 等. 基于增强回归树和Logistic回归的城市扩展驱动力分析. 生态学报, 2014, 34(3): 727-737.]
|
| [42] |
[葛跃, 王明新, 孙向武, 等. 基于增强回归树的城市PM2.5日均值变化分析: 以常州为例. 环境科学, 2017, 38(2): 485-494.]
|
| [43] |
[魏后凯, 王颂吉. 中国“过度去工业化”现象剖析与理论反思. 中国工业经济, 2019, 37(1): 5-22.]
|
| [44] |
[张永芳. 中国城市人地异速关系演变特征及其驱动因素. 城市问题, 2019, 38(5): 65-70.]
|
| [45] |
[邵帅, 张曦, 赵兴荣. 中国制造业碳排放的经验分解与达峰路径: 广义迪氏指数分解和动态情景分析. 中国工业经济, 2017, 35(3): 44-63.]
|
| [46] |
[尹上岗, 杨山, 陈艳如, 等. 长三角房价收入比时空演变格局及收敛性研究. 地理研究, 2020, 39(11): 2521-2536.]
|
| [47] |
[贺灿飞, 胡绪千. 1978年改革开放以来中国工业地理格局演变. 地理学报, 2019, 74(10): 1962-1979.]
|
| [48] |
[刘志彪. 长三角区域市场一体化与治理机制创新. 学术月刊, 2019, 51(10): 31-38.]
|
| [49] |
[王珏, 陈雯. 全球化视角的区域主义与区域一体化理论阐释. 地理科学进展, 2013, 32(7): 1082-1091.]
|
| [50] |
[宋伟轩, 陈艳如, 孙洁, 等. 长三角一体化区域城市房价空间分异的模式与效应. 地理学报, 2020, 75(10): 2109-2125.]
|
/
| 〈 |
|
〉 |
