
滇中城市群不透水表面时空变化与反常气候现象研究
|
刘志林(1990-), 男, 宁夏吴忠人, 博士生, 主要从事自然环境要素、耕地、聚落景观演变及效应研究。E-mail: zhilin2015@foxmail.com |
收稿日期: 2021-07-14
修回日期: 2022-05-20
网络出版日期: 2022-09-13
基金资助
国家重点研发计划(2018YFE0184300)
国家自然科学基金项目(41761115)
国家自然科学基金项目(41271203)
云南师范大学研究生科研创新重点项目(ysdyjs2019166)
Spatiotemporal variation of impervious surface and abnormal climate phenomenon in central Yunnan Urban Agglomeration
Received date: 2021-07-14
Revised date: 2022-05-20
Online published: 2022-09-13
Supported by
National Key R&D Program of China(2018YFE0184300)
National Natural Science Foundation of China(41761115)
National Natural Science Foundation of China(41271203)
Key Research Projects of Graduate Students in Yunnan Normal University(ysdyjs2019166)
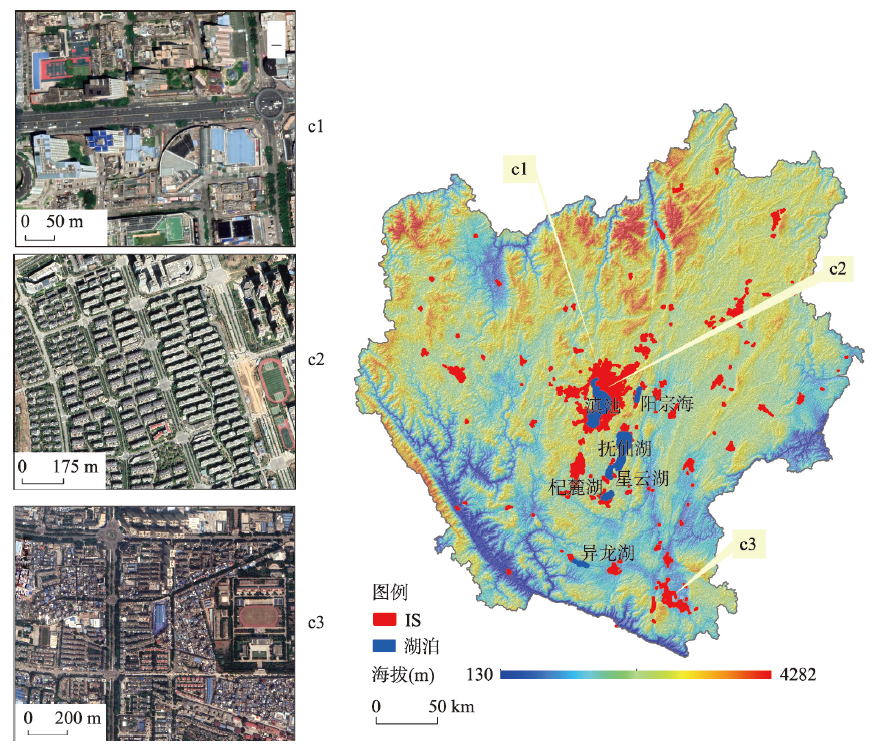
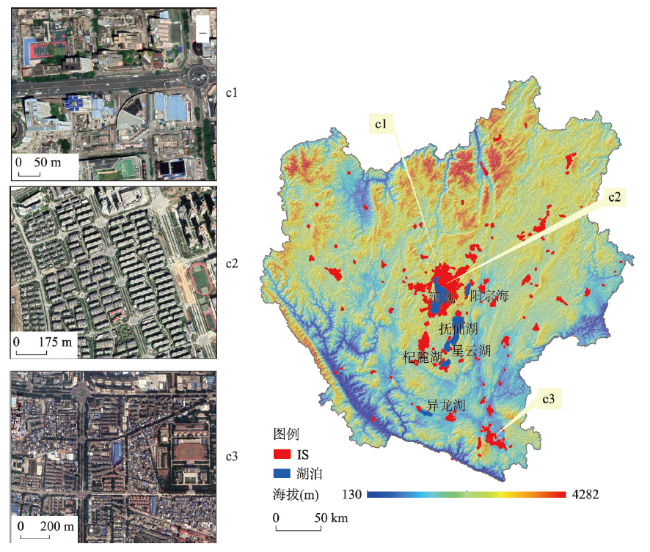
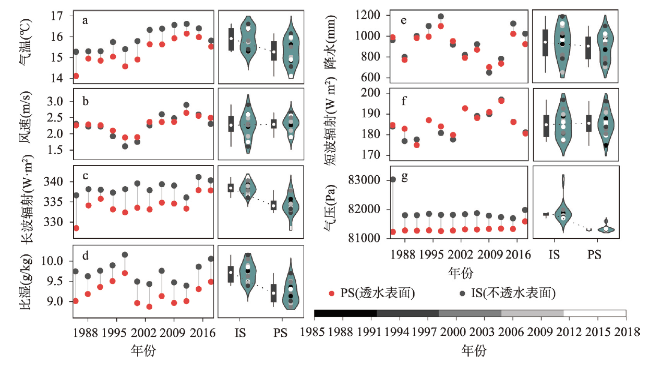
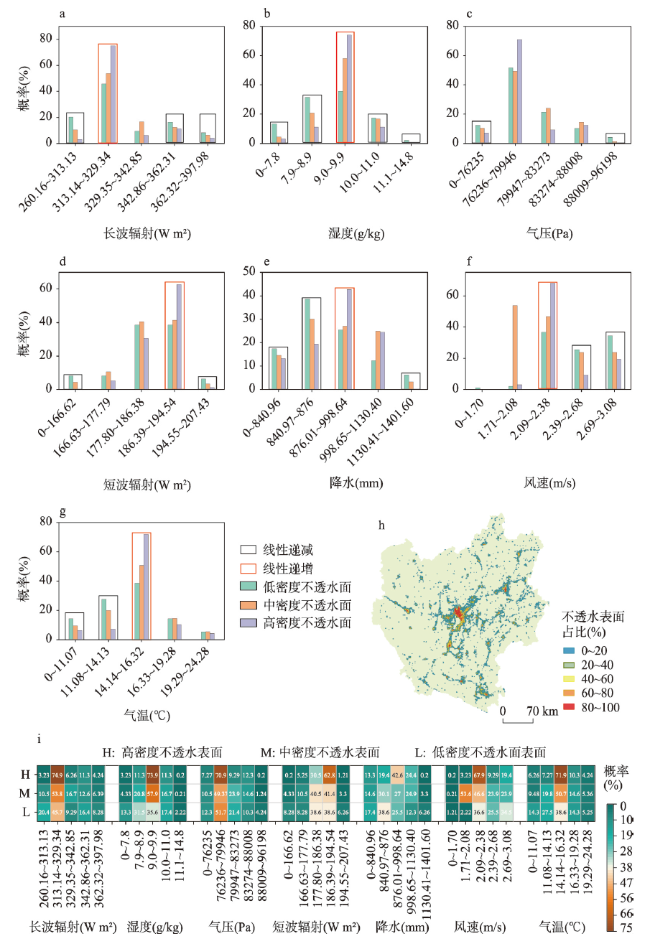
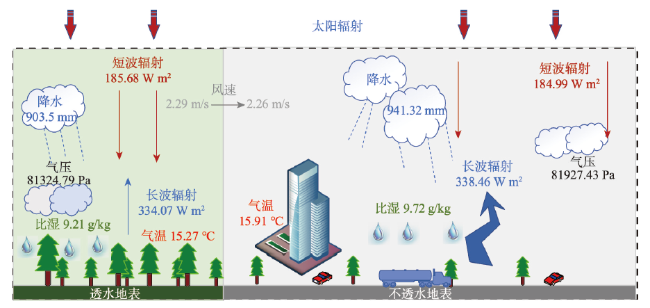
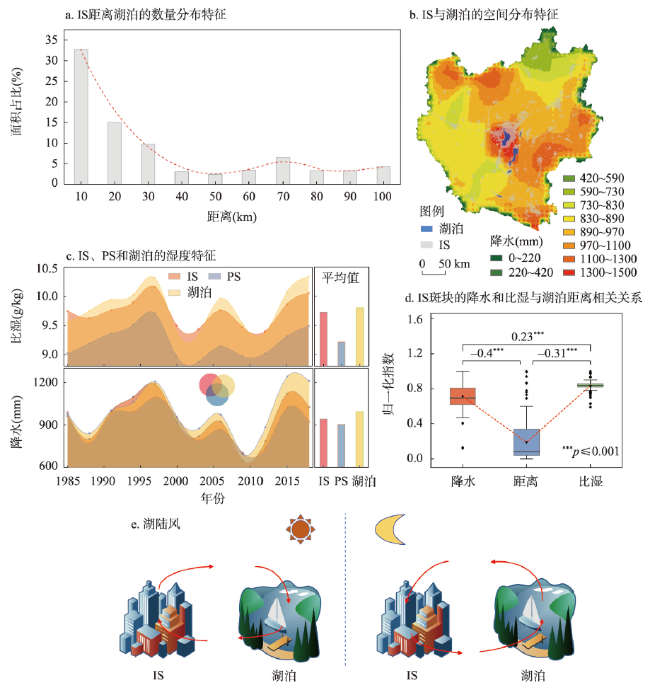
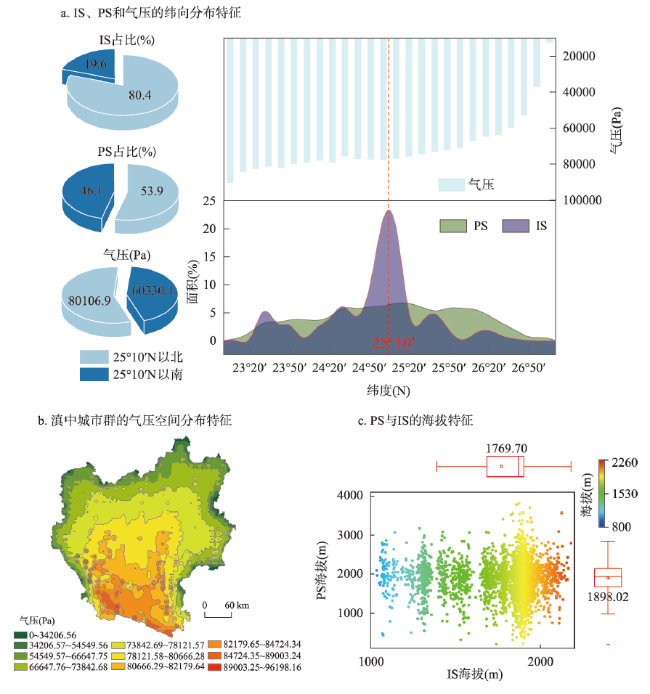
人类活动对全球气候变化的影响是学科前沿也是热点和难点,其中城市不透水表面(IS)的热岛、雨岛等气候现象是研究重点,但有关其他气候要素的研究尚有待开展。本文以全球30 m IS数据集(GAIA)和中国区0.1°地面气象要素数据集为数据源,通过Mann-Kendall(M-K)突变检验法和贝叶斯模型等方法,对滇中高原湖滨城市群在1985—2018年间IS的时空变化特征、气象要素变化与IS的关系,以及反常气候现象进行了刻画。结果表明,相较1985年滇中城市群的IS面积增加了227.56%,2007—2018年增长速度达到最快(89.85 km2/a),主要在S、NE、SE、W 4个方向扩张;34 a滇中城市群气候整体经历冷湿(1985—1995年)、暖湿(1996—2006年)、暖干(2007—2018年)3个快速转化阶段;IS具有显著的“热岛现象(气温+0.63 ℃,长波+4.49 W m²)”“雨岛现象(降水+38.27 mm)”“湿岛现象(比湿+0.51 g/kg)”“风速低岛现象(风速-0.025 m/s)”和“气压高岛现象(气压+602.64 Pa)”;滇中城市群的长波辐射主要分布在313~329 W m²、比湿8.9~9.9 g/kg、气压76235~79946 Pa、短波186~194 W m²、降水840~876 mm和876~998 mm、风速2.08~2.38 m/s、气温13.85~15.85 ℃区间内,且显著受IS分布影响。IS对气压和湿度的影响具有“气压反温度现象”和“湿度反常现象”,这可能与副热带高压带控制、海拔和大型湖泊(湖陆风)影响有关。
刘志林 , 丁银平 , 角媛梅 , 王金亮 , 刘澄静 , 徐秋娥 . 滇中城市群不透水表面时空变化与反常气候现象研究[J]. 地理学报, 2022 , 77(7) : 1775 -1793 . DOI: 10.11821/dlxb202207014
Research on the impact of human activities on global climate change is not only the frontier of the discipline, but also the hotspot and difficulty. At present, the research focuses on the climate phenomena of urban impervious surface (IS), such as heat island and rain island effects, while the research on other climate factors has not yet to be carried out. Based on the Global IS Data Set (GAIA) and the China Region High-resolution Surface Meteorological Element Data Set, though the Mann-Kendall (M-K) mutation test and Bayesian model, this paper studied the spatiotemporal variation of IS, the relationship between meteorological elements and IS, and abnormal climatic phenomena for the 34 lakeside urban agglomerations in the Central Yunnan Plateau controlled by the subtropical high from 1985 to 2018. The results showed that the IS area increased by 227.56% compared with that in 1985, with the highest growth rate (89.85 km2/a) in the past 10 years (2007-2018), mainly expanding in S, NE, SE and W directions. During the past 34 years, the climate of the Central Yunnan urban agglomeration experienced three rapid transformation stages: cold and humid (1985-1995), warm and humid (1996-2006), and warm and dry (2007-2018). Compared with the permeable surface, IS had some significant climatic phenomena, including heat island (air temperature increases by 0.63 ℃, long wave increases by 4.49 W m²), rain island (precipitation increased by 38.27 mm), wet island (specific humidity increases by 0.51 g/kg), wind speed low island (wind speed decreased by 0.025 m/s) and air pressure high island (air pressure increased by 602.64 Pa). The spatial distribution of IS has a significant relationship with meteorological elements in a specific interval, such as long wave of 313~329 W m², specific humidity of 8.9~9.9 g/kg, air pressure of 76235~79946 Pa, short wave of 186~194 W m², precipitation of 840~876 mm and 876~998 mm, wind speed of 2.08~2.38 m/s and air temperature of 13.85~15.85 ℃. In that interval, meteorological elements respond significantly with the increase of the proportion of IS distribution. The impact of IS on air pressure and humidity has the abnormal characteristics of air pressure-temperature and humidity, which may be caused by subtropical high, elevation and large lakes (lake-land breeze).
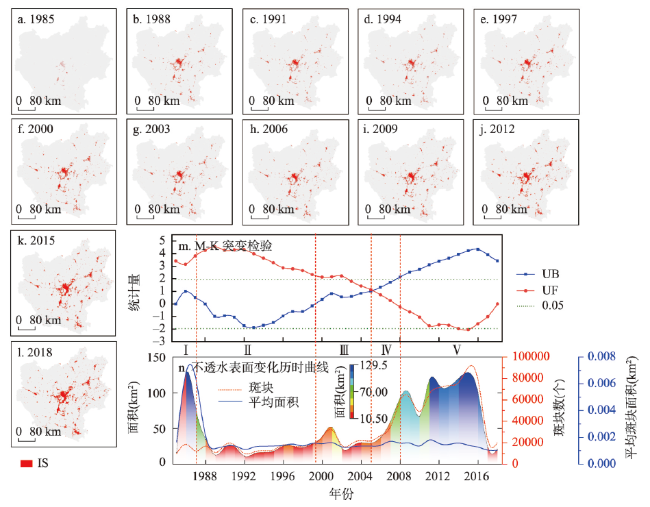
图2 1985—2018年滇中城市群不透水表面时空变化特征注:Ⅰ~Ⅴ分别为滇中不透水表面变化不同的阶段,见表1。 Fig. 2 Spatial and temporal changes of IS in the Central Yunnan urban agglomeration from 1985 to 2018 |
表1 1985—2018年滇中不透水表面变化特征Tab. 1 Characteristics of IS changes in Central Yunnan urban agglomeration from 1985 to 2018 |
| 阶段 | 时段 | 平均扩张速度(km2/a) | UF值特征 |
|---|---|---|---|
| Ⅰ快速扩张 | 1985—1987 | 73.87 | ≥ 0 |
| Ⅱ增长停滞 | 1988—1999 | 21.59 | ≤ 0 |
| Ⅲ增长恢复 | 2000—2005 | 32.92 | ≥ 0 |
| Ⅳ增长加速 | 2006—2008 | 63.66 | ≥ 0且持续增加,接近1.96 |
| Ⅴ增长高位 | 2009—2018 | 89.85 | ≥ 1.96 |
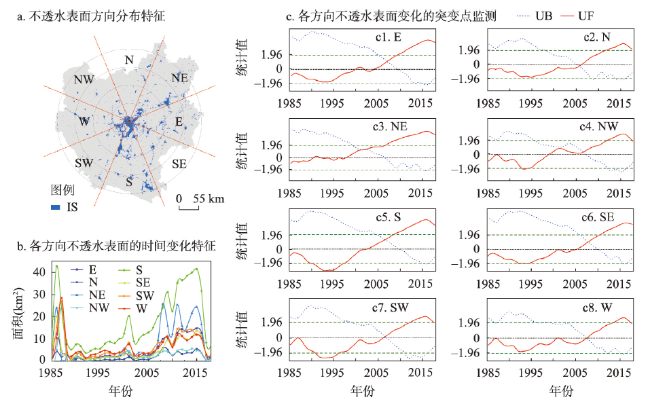
图3 滇中城市群不透水表面在各方向的增长特征与突变检验Fig. 3 The growth characteristics and mutation test of IS in various directions in the Central Yunnan urban agglomeration |
表2 滇中城市群不透水表面在8个方向的增长特征Tab. 2 The growth characteristics of IS in the eight directions of the Central Yunnan urban agglomeration |
| 方向 | 平均增速(km2/a) | 突变点时间(a) | 突变点前速度(km2/a) | 突变点后速度(km2/a) | 增幅(%) |
|---|---|---|---|---|---|
| E | 5.30 | 2007 | 2.85 | 10.40 | 264.39 |
| N | 1.98 | 2006 | 1.13 | 3.54 | 214.36 |
| NE | 7.68 | 2003 | 3.41 | 13.91 | 283.63 |
| SE | 4.75 | 2008 | 3.01 | 8.91 | 195.67 |
| S | 17.28 | 2007 | 11.78 | 28.78 | 144.31 |
| SW | 6.79 | 2007 | 5.20 | 10.12 | 94.62 |
| W | 6.47 | 2007 | 5.33 | 8.86 | 66.45 |
| NW | 3.19 | 2006 | 2.89 | 3.75 | 29.56 |
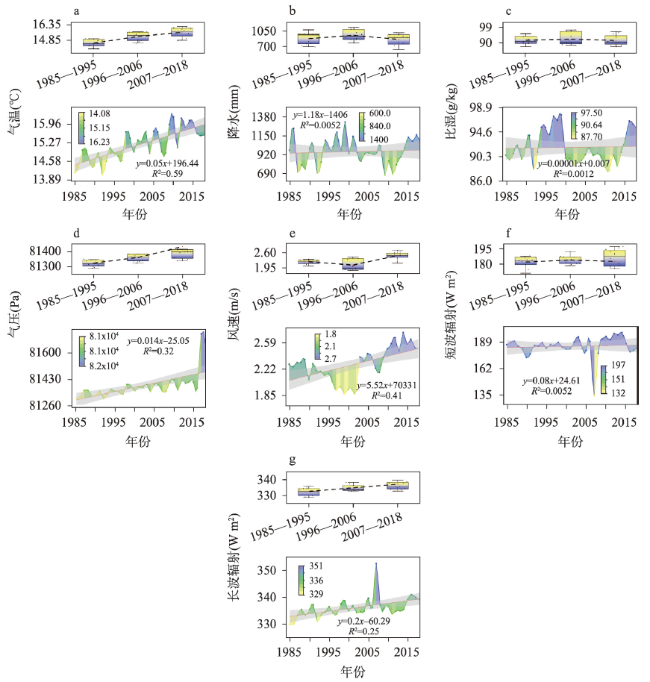
图4 1985—2018年滇中城市群各气象要素的变化特征Fig. 4 Change characteristics of meteorological elements in the Central Yunnan urban agglomeration during 1985-2018 |
表3 1985—2018年滇中城市群各气象要素的变化统计Tab. 3 Ten-year change statistics of various meteorological elements in the Central Yunnan urban agglomeration |
| 气象要素 | 1985—1995年 | 1996—2006年 | 2007—2018年 |
|---|---|---|---|
| 气温(℃) | 14.62 | 15.27 | 15.66 |
| 降水(mm) | 895.91 | 971.95 | 877.32 |
| 比湿(g/kg) | 9.16 | 9.22 | 9.15 |
| 风速(m/s) | 2.20 | 2.07 | 2.47 |
| 气压(Pa) | 81322.77 | 81360.67 | 81431.19 |
| 短波辐射(W m2) | 182.08 | 184.07 | 182.63 |
| 长波辐射(W m2) | 332.50 | 334.78 | 337.26 |
| [1] |
IPCC. Climate Change 2001:The Scientific Basis, Contribution of Working Group Ⅰ to the Third Assessment Report of International Panel on Climate Change. Cambridge: Cambridge University Press, 2001.
|
| [2] |
|
| [3] |
|
| [4] |
|
| [5] |
|
| [6] |
Science. Rise of the city. Science, 2016, 352(6288): 906-907.
|
| [7] |
|
| [8] |
|
| [9] |
|
| [10] |
|
| [11] |
|
| [12] |
|
| [13] |
|
| [14] |
|
| [15] |
|
| [16] |
|
| [17] |
|
| [18] |
|
| [19] |
|
| [20] |
|
| [21] |
[ 翟盘茂, 袁宇锋, 余荣, 等. 气候变化和城市可持续发展. 科学通报, 2019, 64(19): 1995-2001.]
|
| [22] |
|
| [23] |
|
| [24] |
|
| [25] |
|
| [26] |
|
| [27] |
|
| [28] |
|
| [29] |
|
| [30] |
|
| [31] |
|
| [32] |
|
| [33] |
|
| [34] |
|
| [35] |
|
| [36] |
|
| [37] |
|
| [38] |
|
| [39] |
|
| [40] |
|
| [41] |
|
| [42] |
|
| [43] |
|
| [44] |
|
| [45] |
|
| [46] |
|
| [47] |
|
| [48] |
|
| [49] |
|
| [50] |
|
| [51] |
|
| [52] |
|
| [53] |
|
| [54] |
|
| [55] |
|
| [56] |
|
| [57] |
[ 张茜, 杨军, 高雅. 博斯腾湖的湖陆风特征及其数值模拟研究. 高原气象, 2019, 38(1): 165-178.]
|
| [58] |
[ 杨伟, 刘擎, 王威, 等. 东洞庭湖湖陆风特征分析. 气象科技进展, 2020, 10(3): 107-116.]
|
| [59] |
|
| [60] |
|
| [61] |
|
| [62] |
|
/
| 〈 |
|
〉 |