
京津冀地区旅游经济增长的时空演化及影响因素
|
崔丹(1985-), 女, 河南漯河人, 博士, 助理研究员, 主要从事区域经济与区域创新发展研究。E-mail: cuidan1@istic.ac.cn |
收稿日期: 2021-05-06
修回日期: 2022-04-24
网络出版日期: 2022-08-19
基金资助
国家自然科学基金项目(41771128)
Spatiotemporal evolution and influencing factors of tourism economic growth in Beijing-Tianjin-Hebei region
Received date: 2021-05-06
Revised date: 2022-04-24
Online published: 2022-08-19
Supported by
National Natural Science Foundation of China(41771128)
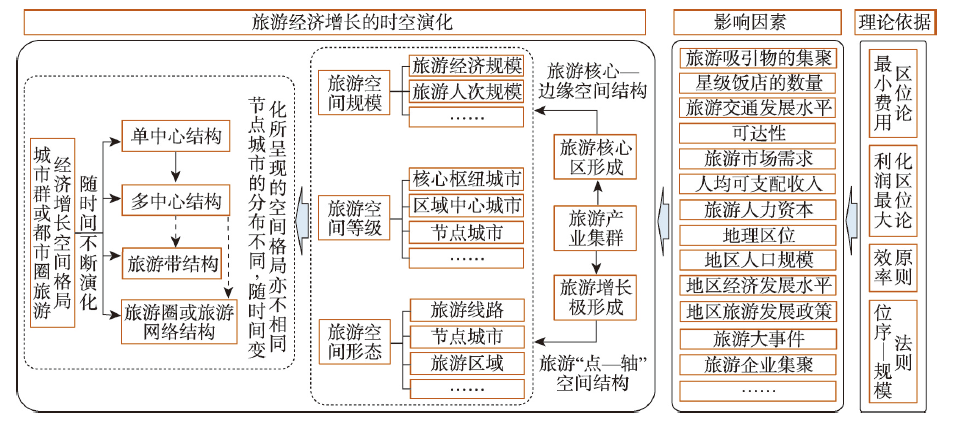
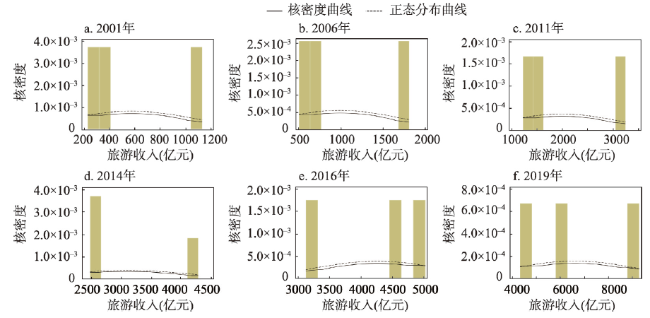
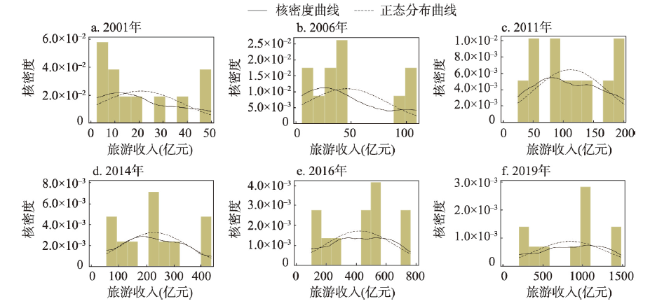
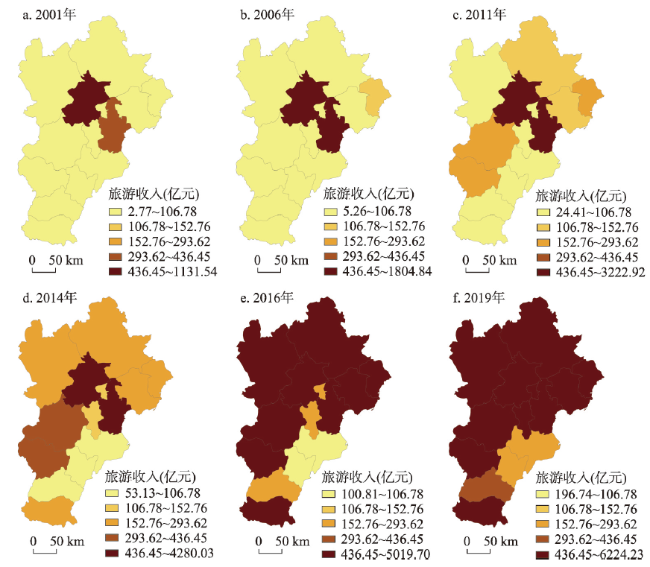
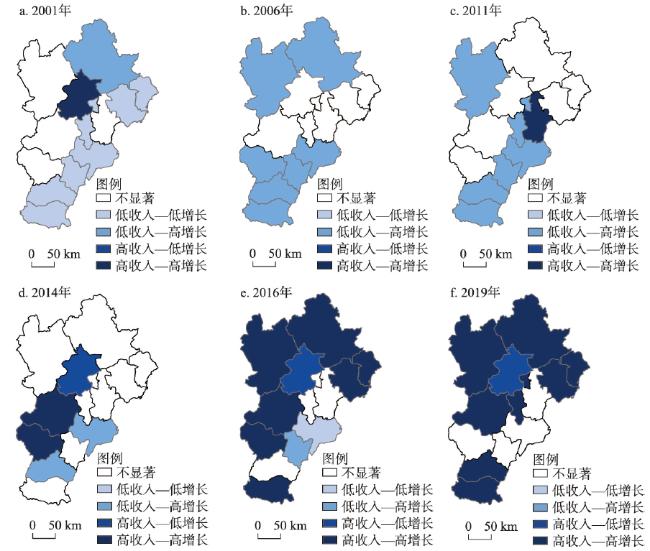
揭示区域旅游经济增长的时空演化特征并探究其影响因素有助于丰富区域旅游经济发展理论,也可为京津冀地区旅游协同发展政策的制定提供科学依据。在初步构建京津冀地区旅游经济增长时空演化研究框架及多因素分析模型的基础上,运用基尼系数、核密度曲线、双变量局域自相关等方法,从旅游空间的规模、等级和形态变化等方面考察京津冀地区2001—2019年旅游经济增长的空间格局及演化过程,并基于面板多元回归模型和空间计量模型对其影响因素进行深入剖析。结果表明:① 京津冀地区旅游经济增长的空间格局从双核心逐渐转为多核心,旅游区域中心城市和部分旅游节点城市逐步成为旅游经济增长的主要载体,京津冀旅游协同发展初见成效。② 京津冀地区旅游经济增长的时空演化过程大体可分为3个阶段:高速增长下的双核心极化缓解阶段;中速增长下的双核心向多核心转变阶段;快速增长下的多核心形成阶段。③ 影响京津冀地区旅游经济增长的主要因素有人均GDP、星级饭店的数量、到北京/天津高速公路距离、旅游发展政策和旅游大事件等,其中人均GDP对旅游经济增长有显著的空间溢出效应。④ 影响核心枢纽城市、旅游区域中心城市和节点城市的旅游经济增长因素有一定差异,星级饭店数量、旅游大事件和PM2.5浓度对核心枢纽城市和旅游区域中心城市旅游经济增长有较大影响,城市道路面积、到北京/天津高速公路距离、旅游发展政策、旅游大事件、年末实有出租车数量、PM2.5浓度等则是影响旅游节点城市旅游经济增长的主要因素。
崔丹 , 李沅曦 , 吴殿廷 . 京津冀地区旅游经济增长的时空演化及影响因素[J]. 地理学报, 2022 , 77(6) : 1391 -1410 . DOI: 10.11821/dlxb202206007
Revealing the spatiotemporal evolution of regional tourism economic growth and exploring its influencing factors will help enrich the theoretical and practical research on regional tourism economic development and formulate relevant policies. In terms of methodology, this study is based on the constructed research framework and multivariate analysis model of the spatiotemporal evolution of tourism economic growth in the Beijing-Tianjin-Hebei region, and employs the methods including Gini coefficient, kernel density estimation, and bivariate local autocorrelation. The spatial pattern and its evolution process of tourism economic growth in the study region from 2001 to 2019 are investigated from the scale, level and pattern changes of the tourism space. The influencing factors are deeply analyzed based on the panel multiple regression model and spatial econometric model. The results show that: (1) The spatial pattern of tourism economic growth gradually shifted from dual cores to multi-cores. Regional tourism central cities and some peripheral tourism node cities became the main areas of tourism economic growth. (2) The spatiotemporal evolution process of tourism economic growth can be divided into three stages, namely, the dual core polarization alleviation stage under high-speed growth, the transition stage from dual cores to multi-cores under medium speed growth, and the multi-core formation stage under fast-speed growth. (3) The main factors affecting the tourism economic growth are per capita GDP, the number of star grade hotels, the length of expressway to Beijing or Tianjin, tourism development policies, and tourism events. Among them, the per capita GDP had a significant spatial spillover effect on the growth of tourism economy in this region. (4) There are some differences in tourism economic growth factors among core hub cities, regional tourism central cities and node cities. The number of star grade hotels, tourism events and PM2.5 concentration have great influence on tourism economic growth of core hub cities and regional tourism central cities, while the urban road area, the length of expressway to Beijing or Tianjin, tourism development policies, tourism events, the number of taxis and PM2.5 concentration are the main influencing factors on the tourism economic growth in tourism node cities.
表1 自变量描述性说明Tab. 1 The descriptive statement of independent variables |
| 变量名 | 单位 | 指标释义与影响性质 |
|---|---|---|
| 地理区位(Location) | km | 到核心枢纽城市(北京/天津)的距离 |
| 经济规模(Pgdp) | 元/人 | 人均GDP,衡量城市经济发展水平 |
| 地区人口规模(Pop) | 人 | 衡量城市的旅游市场需求 |
| 人均可支配收入(Lcost) | 元 | 衡量城市的旅游市场需求 |
| 4A级及以上景区数量(Scenic) | 个 | 衡量城市的旅游吸引物数量 |
| 星级饭店的数量(Retn) | 个 | 衡量城市旅游接待和服务设施情况 |
| 到核心枢纽城市(北京/天津)高速公路距离(Highr) | km | 衡量城市旅游交通发展水平 |
| 年末实有道路面积(Road) | km | 衡量城市旅游交通发展水平 |
| 年末实有公共营运汽电车数量(Bus) | 个 | 衡量城市旅游交通发展水平 |
| 年末实有出租车数量(Taxi) | 个 | 衡量城市旅游交通发展水平 |
| 是否通高铁(Train) | - | 衡量城市可达性 |
| 住宿餐饮业从业人员数量(Hotel) | 万人 | 衡量城市旅游人力资本情况 |
| 文化、体育和娱乐业从业人员数量(Cultp) | 万人 | 衡量城市旅游人力资本情况 |
| 地区旅游发展政策(Policy) | - | 衡量城市旅游政策支持环境 |
| 旅游大事件(赛事活动)(Activity) | - | 衡量城市旅游发展契机 |
| PM2.5浓度(PM) | μg/m³ | 衡量城市生态环境 |
| 建成区绿化面积(Green) | 万m2 | 衡量城市生态环境 |
注:由于北京和天津的旅游收入占京津冀地区旅游收入的占比始终在20%以上,且北京和天津的旅游资源丰富,交通非常便利,因此,将北京和天津作为京津冀地区的旅游核心枢纽城市。高铁、地区旅游发展政策和旅游大事件均采用虚拟变量进行量化。其中旅游大事件包含国际国内重大赛事及地市级以上的旅游发展大会等,这些事件都会对旅游经济增长产生一定影响,但是它们对旅游经济增长产生影响的程度是难以事先预知的,而赛事活动本身有无就变得更为重要,因此本文将旅游大事件用虚拟变量进行量化。 |
表2 2001—2019年京津冀地区旅游收入描述性统计Tab. 2 The descriptive statistics of tourism revenue in Beijing-Tianjin-Hebei region in 2001-2019 |
| 年份 | 城市数量(个) | 均值(亿元) | 标准差(亿元) | 最小值(亿元) | 最大值(亿元) | 基尼系数 |
|---|---|---|---|---|---|---|
| 2001 | 13 | 132.59 | 314.80 | 2.77 | 1131.54 | 0.80 |
| 2006 | 13 | 228.45 | 504.08 | 5.25 | 1804.84 | 0.76 |
| 2011 | 13 | 457.38 | 917.15 | 24.41 | 3222.92 | 0.71 |
| 2014 | 13 | 713.40 | 1244.90 | 53.13 | 4280.03 | 0.66 |
| 2016 | 13 | 982.31 | 1440.95 | 100.81 | 5019.70 | 0.58 |
| 2019 | 13 | 1524.29 | 1755.46 | 196.74 | 6224.23 | 0.50 |
表3 京津冀地区旅游经济增长影响因素的多元线性回归模型及结果Tab. 3 The multiple linear regression models and results of the factors affecting the tourism economic growth in Beijing-Tianjin-Hebei region |
| 自变量 | 京津冀地区 (模型1) | 核心枢纽和旅游区域中心城市(模型2) | 旅游节点城市 (模型3) | |||||
|---|---|---|---|---|---|---|---|---|
| OLS | FGLS | OLS | FGLS | OLS | FGLS | |||
| Pgdp | 0.2188 (1.14) | 0.1568** (2.11) | 0.2157 (0.47) | 0.1713 (0.90) | 0.1888 (0.95) | 0.0666 (0.81) | ||
| Pop | -0.1030 (-0.66) | -0.1076 (-1.39) | 0.1432 (0.44) | 0.0205 (0.13) | -0.4933** (-2.50) | -0.3569*** (-3.78) | ||
| Lcost | -0.0846 (-0.43) | -0.0965 (-1.21) | 0.0009 (0.00) | 0.2839 (1.03) | -0.2745 (-1.22) | -0.2439* (-1.82) | ||
| Scenic | -0.2171 (-1.12) | -0.1880** (-2.50) | -0.5152 (-1.01) | -0.6971*** (-2.93) | -0.0750 (-0.46) | -0.0385 (-0.51) | ||
| Retn | 0.2095 (1.01) | 0.1597** (2.20) | 0.2828 (0.60) | 0.5133** (2.34) | 0.0530 (0.46) | 0.0778** (2.03) | ||
| Highr | 0.0923 (1.11) | 0.0722** (1.96) | 0.1665 (0.60) | 0.0654 (0.47) | 0.1948 (1.58) | 0.1548*** (2.75) | ||
| Road | 0.0014 (0.01) | -0.0570 (-1.17) | -0.0225 (-0.07) | -0.1541 (-1.22) | 0.3017 (1.52) | 0.2223*** (2.64) | ||
| Taxi | -0.1552 (-0.56) | -0.0424 (-0.58) | -0.1681 (-0.30) | -0.1671 (-0.72) | 0.1565 (1.19) | 0.1466*** (2.92) | ||
| Policy | 0.2086** (2.33) | 0.1609*** (3.77) | 0.1511 (1.01) | 0.0862 (1.19) | 0.2242* (1.90) | 0.2007** (1.98) | ||
| Activity | 0.1059 (1.35) | 0.1516*** (3.19) | 0.1274 (0.92) | 0.1241* (1.74) | 0.1050 (1.07) | 0.1457* (1.88) | ||
| PM | 0.0423 (0.54) | 0.0524 (1.63) | -0.0142 (-0.08) | 0.2155** (2.05) | 0.1867* (1.69) | 0.1481** (2.53) | ||
| Constant | -1.62×10⁻⁸ (-0.00) | -0.0601 (-0.78) | -5.66×10⁻⁸ (-0.00) | -0.1467 (-1.09) | 3.04×10⁻⁸ (0.00) | -0.0049 (-0.04) | ||
| LM test | 0.00 | 0.00 | 0.00 | |||||
| Hausman test | 13.79 | 4.40 | 6.34 | |||||
| Modified Wald statistic test | 329.74*** | 386.88*** | 36.66*** | |||||
| LR test | 63.70*** | 42.27*** | 25.97*** | |||||
| Wooldridge test | 10.80*** | 0.06 | 26.70*** | |||||
| Pesaran test | 22.50*** | 8.83*** | 12.74*** | |||||
| Friedman test | 115.26*** | 49.45*** | 65.84** | |||||
| Frees test | 0.58 | 0.64 | 0.55 | |||||
| Wald chi2/F值 | 26.17*** | 121.19*** | 6.86 | 39.21*** | 22.34** | 54.31*** | ||
| 观测量 | 247 | 247 | 95 | 95 | 152 | 152 | ||
| 城市数 | 13 | 13 | 5 | 5 | 8 | 8 | ||
注:① 考虑到核心枢纽城市由于样本数量偏少容易造成面板数据容量偏小等问题,将核心枢纽城市和区域中心城市一起研究;括号中的数字为FGLS和OLS估计的z值;② ***表示1%置信水平上显著;**表示5%置信水平上显著;*表示10%置信水平上显著;③ Hausman test用于检验面板回归中随机效应是否比固定效应更合适;④ LM test用于检验面板回归中混合回归是否比随机效应更合适;⑤ LR test和Modified Wald statistic test在面板回归模型中检测组间异方差;⑥ Wooldridge test在面板数据回归中检测组内自相关;⑦ Pesaran's test、Friedman's test和Frees' test用于检验短面板回归中组间同期自相关。 |
表4 京津冀地区旅游经济增长影响因素的空间面板回归模型及结果Tab. 4 The spatial panel regression models and results of the factors affecting the tourism economic growth in Beijing-Tianjin-Hebei region |
| 自变量 | 京津冀地区 | 核心枢纽城市和旅游区域中心城市 | 旅游节点城市 | ||||||||
|---|---|---|---|---|---|---|---|---|---|---|---|
| (1)SDM | (2)SAC | (3)SEM | (1)SDM | (2)SAC | (3)SEM | (1)SDM | (2)SAC | (3)SEM | |||
| Pgdp | 0.2266 (0.77) | 0.3814* (1.52) | 0.3340 (1.37) | 0.5389 (1.06) | 0.7288* (1.73) | 0.7400 (1.61) | -0.1403 (-0.40) | 0.1677 (1.31) | 0.1882 (0.83) | ||
| Pop | -1.0871* (-1.90) | -0.8934* (-1.80) | -0.9026* (-1.87) | 0.1368 (0.11) | -0.5912 (-0.78) | -0.5901 (-0.68) | -0.6537 (-0.40) | 0.5180 (0.68) | -1.3309 (-1.14) | ||
| Lcost | -0.0146 (-0.05) | -0.1314 (-0.54) | -0.1227 (-0.54) | 0.0861 (0.15) | -0.1943 (-0.54) | -0.1899 (-0.46) | -0.0184 (-0.04) | -0.2095 (-1.51) | -0.0686 (-0.23) | ||
| Scenic | -0.0155 (-0.06) | -0.1345 (-0.56) | -0.1294 (-0.53) | -1.1437** (-1.93) | -0.6129 (-1.32) | -0.6625 (-1.30) | -0.2940 (-1.00) | -0.0426 (-0.53) | -0.2750 (-1.24) | ||
| Retn | -0.0531 (-0.17) | -0.0264 (-0.10) | -0.0768 (-0.30) | -0.0798 (-0.14) | -0.0332 (-0.08) | -0.0537 (-0.12) | -0.1288 (-0.96) | -0.0029 (-0.06) | 0.0099 (0.09) | ||
| Highr | 0.1415 (0.67) | 0.1813 (1.09) | 0.1527 (0.93) | 2.7637 (0.98) | 0.3273 (0.87) | 0.3972 (0.93) | -0.3139 (-0.82) | 0.0262 (0.26) | 0.0566 (0.25) | ||
| Road | 0.2024 (1.13) | 0.1111 (0.72) | 0.1131 (0.73) | -0.0355 (-0.13) | 0.0054 (0.02) | -0.0074 (-0.03) | 0.6284 (1.20) | 0.1692 (1.17) | 0.6546* (1.80) | ||
| Taxi | 1.3673 (1.40) | 0.1044 (0.13) | 0.3036 (0.40) | -0.5203 (-0.27) | -0.4035 (-0.28) | -0.2124 (-0.13) | 0.1149 (0.51) | 0.0120 (0.17) | 0.0843 (0.56) | ||
| Policy | 0.1664 (1.37) | 0.2105* (1.94) | 0.1971** (1.98) | 0.0105 (0.05) | 0.1501 (1.28) | 0.1675 (1.19) | 0.2689 (0.61) | 0.0228 (0.66) | 0.2246 (1.55) | ||
| Activity | 0.1458 (1.34) | 0.1891** (2.01) | 0.1471* (1.74) | 0.2124* (1.65) | 0.1708* (1.69) | 0.1924* (1.71) | 0.0152 (0.06) | 0.0229 (0.87) | 0.1043 (0.90) | ||
| PM | 0.4721** (2.40) | 0.5185*** (3.03) | 0.4422*** (2.85) | -0.0820 (-0.22) | 0.1244 (0.69) | 0.1063 (0.46) | 0.7385** (2.54) | 0.0069 (0.08) | 0.4962** (2.40) | ||
| W×Pgdp | -0.2697** (-2.08) | 0.7967 (1.33) | 0.6754*** (2.68) | ||||||||
| W×Pop | 0.1949 (0.70) | -1.4459 (-1.57) | 1.8952 (1.48) | ||||||||
| W×Lcost | 0.1704* (1.73) | -0.5659 (-1.24) | -0.6594** (-2.49) | ||||||||
| W×Scenic | -0.1137 (-0.85) | 0.6074 (1.52) | 0.1499 (0.94) | ||||||||
| W×Retn | 0.0821 (0.73) | -0.2508 (-0.80) | 0.0606 (0.73) | ||||||||
| W×Highr | -0.1554 (-1.29) | -2.5294 (-0.90) | 0.0442 (0.15) | ||||||||
| W×Road | 0.0399 (0.34) | -0.1227 (-0.53) | -0.2050 (-0.58) | ||||||||
| W×Taxi | 0.0630 (0.18) | -0.7890 (-0.65) | -0.0096 (-0.08) | ||||||||
| W×Policy | -0.0413 (-1.47) | 0.1147 (0.97) | -0.1126 (-0.66) | ||||||||
| W×Activity | -0.0385 (-1.51) | -0.0133 (-0.16) | 0.0147 (0.14) | ||||||||
| W×PM | -0.0558 (-0.94) | 0.2159 (1.01) | -0.5055*** (-3.07) | ||||||||
| lambda | 0.1573 (p=0.000) | 0.1203 (p=0.000) | 0.1518 (p=0.078) | 0.2241 (p=0.000) | -0.5743 (p=0.000) | 0.1715 (p=0.000) | |||||
| rho | 0.2843 (p=0.000) | -0.1858 (p=0.000) | 0.2221 (p=0.000) | 0.1373 (p=0.123) | 0.1561 (p=0.000) | 0.3127 (p=0.000) | |||||
| R2 | 0.0764 | 0.2819 | 0.2668 | 0.2412 | 0.5944 | 0.5585 | 0.2628 | 0.1823 | 0.1593 | ||
| logL | -357.4596 | -278.5376 | -285.9555 | -114.5471 | -116.8932 | -117.7648 | -182.0591 | -179.2381 | -188.7497 | ||
| 观测量 | 247 | 247 | 247 | 95 | 95 | 95 | 152 | 152 | 152 | ||
| 城市数 | 13 | 13 | 13 | 5 | 5 | 5 | 8 | 8 | 8 | ||
注:① 括号中的数字为SDM、SAC和SEM估计的t值;② ***表示1%置信水平上显著;**表示5%置信水平上显著;*表示10%置信水平上显著。 |
表5 空间计量模型间稳健检验Tab. 5 The robust test between spatial econometric models |
| 地区 | 模型 | 原假设 | 备择假设 | 检验方法 | P值 |
|---|---|---|---|---|---|
| 京津冀地区 | 模型1 | SEM | SAC | Likelihood-ratio test | 0.0000 |
| SEM | SDM | Wald test | 0.6321 | ||
| 核心枢纽城市和 旅游区域中心城市 | 模型2 | SEM | SAC | Likelihood-ratio test | 0.1867 |
| SEM | SDM | Wald test | 0.8544 | ||
| 旅游节点城市 | 模型3 | SEM | SAC | Likelihood-ratio test | 0.0000 |
| SEM | SDM | Wald test | 0.3316 |
表6 京津冀地区旅游经济增长影响因素的空间溢出效应Tab. 6 The spatial spillover effect of the factors affecting the tourism economic growth in Beijing-Tianjin-Hebei region |
| 自变量 | 京津冀地区 | 核心枢纽城市和旅游区域中心城市 | 旅游节点城市 | |||||
|---|---|---|---|---|---|---|---|---|
| SDM | SDM | SDM | ||||||
| 直接效应 | 间接效应 | 直接效应 | 间接效应 | 直接效应 | 间接效应 | |||
| Pgdp | 0.7731* (1.76) | 1.1676** (2.09) | 2.4183** (2.09) | 2.9530 (1.46) | 0.9065** (2.23) | 1.7224*** (2.93) | ||
| Pop | -0.7834 (-0.89) | 0.6597 (0.45) | -2.7654* (-1.79) | -4.5361 (-1.57) | 2.2138 (1.00) | 4.6669 (1.41) | ||
| Lcost | -0.4427 (-1.31) | -0.9222** (-2.09) | -1.0536 (-1.64) | -1.8061 (-1.41) | -1.0851** (-2.40) | -1.7664*** (-3.05) | ||
| Scenic | 0.2955 (0.67) | 0.6612 (0.88) | -0.4341 (-0.57) | 1.1236 (0.93) | -0.1356 (-0.60) | 0.2741 (0.79) | ||
| Retn | -0.2033 (-0.59) | -0.3387 (-0.61) | -0.6492 (-1.04) | -0.9065 (-1.20) | -0.0640 (-0.50) | 0.0966 (0.55) | ||
| Highr | 0.4566 (1.23) | 0.6576 (1.21) | -1.1546 (-0.61) | -6.1313 (-0.86) | -0.3235 (-1.15) | 0.0069 (0.01) | ||
| Road | -0.0791 (-0.23) | -0.6136 (-0.97) | -0.2633 (-0.59) | -0.3695 (-0.53) | 0.4976 (1.30) | -0.2339 (-0.30) | ||
| Taxi | 0.0661 (0.05) | -2.6274 (-1.28) | -2.2925 (-0.92) | -2.6398 (-0.79) | 0.1283 (0.61) | 0.0376 (0.15) | ||
| Policy | 0.1516 (1.60) | -0.0328 (-0.28) | 0.2471 (1.62) | 0.3690 (1.38) | 0.1531 (0.54) | -0.1906 (-0.68) | ||
| Activity | 0.1372 (1.48) | -0.0187 (-0.20) | 0.2874** (2.10) | 0.1192 (0.56) | 0.0403 (0.23) | 0.0470 (0.26) | ||
| PM | 0.2673 (1.26) | -0.4318 (-1.63) | 0.3133 (1.08) | 0.5996 (1.19) | 0.0902 (0.37) | -1.0502*** (-2.83) | ||
注:① 括号中的数字为SDM估计的t值;② ***表示1%置信水平上显著;**表示5%置信水平上显著;*表示10%置信水平上显著。 |
| [1] |
[唐承财, 孙孟瑶, 万紫微. 京津冀城市群高等级景区分布特征及影响因素. 经济地理, 2019, 39(10): 204-213.]
|
| [2] |
[张坤, 苏欣蕾, 苏凯红, 等. 基于POI大数据的京津冀旅游资源空间分异研究. 地域研究与开发, 2021, 40(1): 103-108, 114.]
|
| [3] |
[刘思敏. 京津冀一体化旅游发展的问题与对策. 旅游学刊, 2014, 29(10): 16-18.]
|
| [4] |
[李晶晶, 苗长虹. 长江经济带人口流动对区域经济差异的影响. 地理学报, 2017, 72(2): 197-212.]
|
| [5] |
[张学波, 于伟, 张亚利, 等. 京津冀地区经济增长的时空分异与影响因素. 地理学报, 2018, 73(10): 1985-2000.]
|
| [6] |
|
| [7] |
[戴斌, 黄璜. 区域旅游一体化的理论建构与战略设计: 以京津冀为例. 人文地理, 2016, 31(3): 128-135.]
|
| [8] |
|
| [9] |
[陈浩, 陆林, 郑嬗婷. 珠江三角洲城市群旅游空间格局演化. 地理学报, 2011, 66(10): 1427-1437.]
|
| [10] |
[阎守邕, 丁纪, 濮静娟, 等. 中国旅游资源分区的初步研究. 自然资源学报, 1989, 4(2): 112-122.]
|
| [11] |
[苏伟忠, 杨英宝, 顾朝林. 城市旅游竞争力评价初探. 旅游学刊, 2003, 18(3): 39-42.]
|
| [12] |
[史小珍. 浙江省旅游产业区域结构优化研究. 国土与自然资源研究, 2008(3): 80-82.]
|
| [13] |
[马仁锋, 倪欣欣, 张文忠, 等. 浙江旅游经济时空差异的多尺度研究. 经济地理, 2015, 35(7): 176-182.]
|
| [14] |
|
| [15] |
[赵磊, 毛润泽. 旅游发展、门槛效应与经济增长: 来自中国的经验证据. 山西财经大学学报, 2013(12): 69-83.]
|
| [16] |
|
| [17] |
[李锋, 孙根年, 付琦. 基于抗周期性角度的我国旅游产业政策效用评估研究: 以四次旅游产业政策为例. 经济地理, 2013, 33(6): 162-169.]
|
| [18] |
[宋子千, 韩元军. 中国旅游产业的增长方式与面向现代服务业的转型: 基于2005—2009年22个旅游城市面板数据的实证分析. 经济地理, 2013, 33(10): 163-167.]
|
| [19] |
[刘晓萌, 胡叶星寒, 刘妮雅. 京津冀城市群旅游经济联系分析: 基于改进引力模型. 中国流通经济, 2020, 34(2): 121-128.]
|
| [20] |
[殷平, 杨寒胭, 张同颢. 高速铁路网与京津冀旅游: 空间作用与结构演化. 旅游学刊, 2019, 34(3): 102-112.]
|
| [21] |
[陆相林, 马凌波, 孙中伟, 等. 基于能级提升的京津冀城市群旅游空间结构优化. 地域研究与开发, 2018, 37(4): 98-103.]
|
| [22] |
[喻琦, 马仁锋, 叶持跃, 等. 长三角城市群旅游空间结构分析. 统计与决策, 2018, 34(13): 113-116.]
|
| [23] |
[李国平, 席强敏. 京津冀协同发展下北京人口有序疏解的对策研究. 人口与发展, 2015, 21(2): 28-33.]
|
| [24] |
|
| [25] |
|
| [26] |
[安虎森. 区域经济学通论. 北京: 经济科学出版社, 2004: 58-131.]
|
| [27] |
|
| [28] |
[魏守华, 杨阳, 陈珑隆. 城市级、人口增长差异与城镇体系演变. 中国工业经济, 2020(7): 5-23.]
|
| [29] |
[王波, 甄峰. 互联网下的我国城市等级体系及其作用机制: 基于百度搜索的实证分析. 经济地理, 2016, 36(1): 46-52.]
|
| [30] |
[陈志钢, 保继刚. 典型旅游城市游憩商业区空间形态演变及影响机制: 以广西阳朔县为例. 地理研究, 2012, 31(7): 1339-1351.]
|
| [31] |
[侯兵, 黄震方, 徐海军. 文化旅游的空间形态研究: 基于文化空间的综述与启示. 旅游学刊, 2011, 26(3): 70-77.]
|
| [32] |
[唐林俊, 杨虎, 张洪阳. 核密度估计在预测风险价值中的应用. 数学的实践与认识, 2005, 35(10): 29-35.]
|
| [33] |
[王承云, 孙飞翔. 长三角城市创新空间的集聚与溢出效应. 地理研究, 2017, 36(6): 1042-1052.]
|
| [34] |
|
| [35] |
|
| [36] |
|
| [37] |
|
| [38] |
|
| [39] |
[徐祯, 李国平, 席强敏, 等. 北京市建筑设计产业空间分布与区位选择. 地理科学, 2021, 41(5): 804-814.]
|
| [40] |
[罗金阁, 张博, 刘嗣明. 粤港澳大湾区交通可达性与旅游经济联系空间关系. 经济地理, 2020, 40(10): 213-220.]
|
| [41] |
[保继刚, 楚义芳. 旅游地理学. 北京: 高等教育出版社, 1999: 23-25.]
|
/
| 〈 |
|
〉 |