
2015—2020年中国土地利用变化遥感制图及时空特征分析
|
匡文慧(1978-), 男, 研究员, 博士生导师, 主要从事土地利用/覆盖变化、城市生态学研究。E-mail: kuangwh@igsnrr.ac.cn |
收稿日期: 2022-03-25
修回日期: 2022-04-18
网络出版日期: 2022-07-20
基金资助
中国科学院战略性先导科技专项(XDA23100201)
国家重点研发计划(2018YFC1800103)
第二次青藏高原综合科学考察研究(2019QZKK0608)
Remotely sensed mapping and analysis of spatio-temporal patterns of land use change across China in 2015-2020
Received date: 2022-03-25
Revised date: 2022-04-18
Online published: 2022-07-20
Supported by
The Strategic Priority Research Program of Chinese Academy of Sciences(XDA23100201)
National Key R&D Program of China(2018YFC1800103)
The Second Tibetan Plateau Scientific Expedition and Research Program(2019QZKK0608)
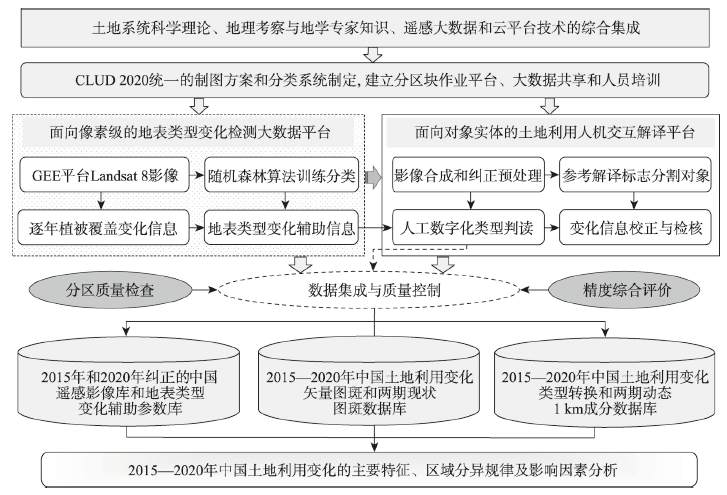
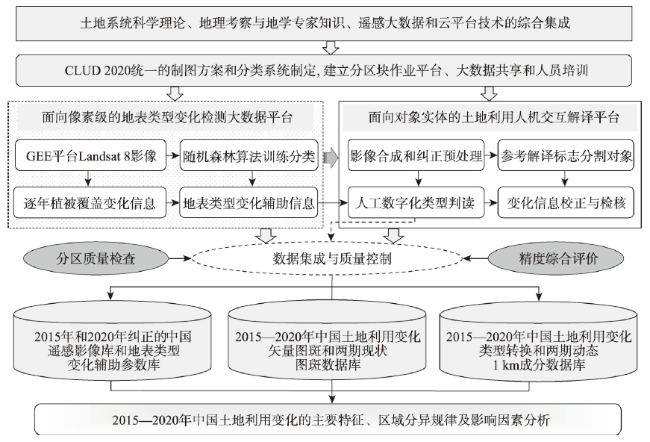
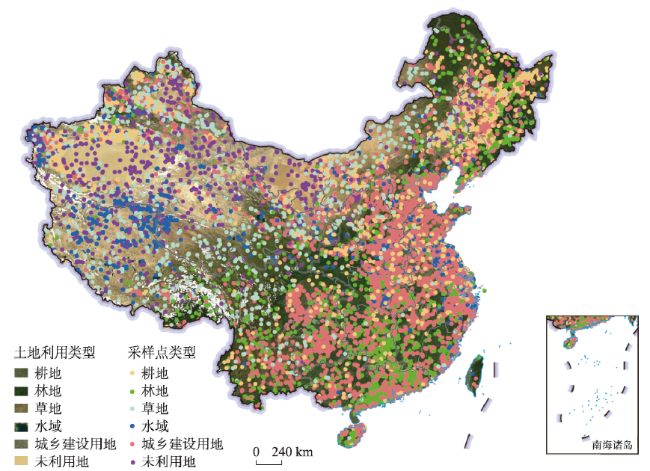
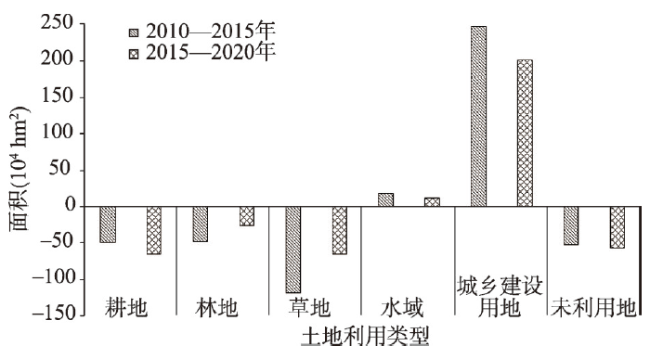
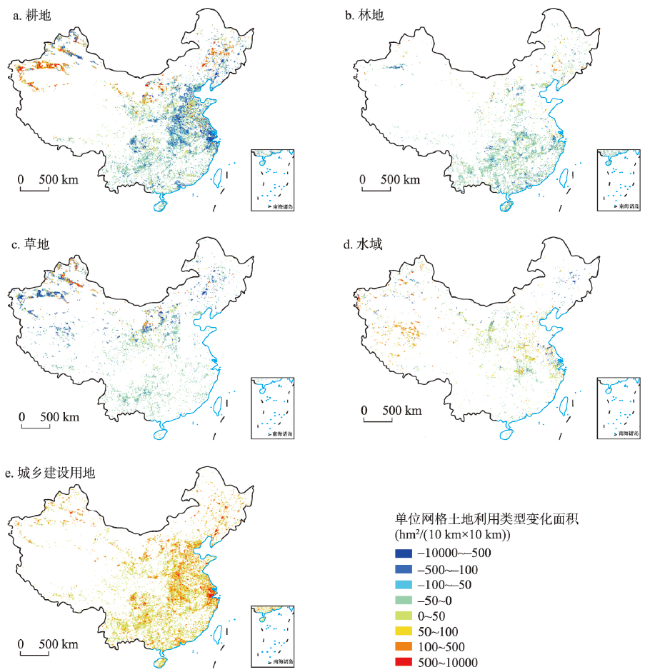
持续地开展国家尺度土地利用/覆盖变化遥感监测对于新时代国土空间规划和“美丽中国”蓝图绘制具有重要的科学价值。本文采用Landsat 8 OLI、GF-2等卫星遥感数据,融合遥感大数据云计算和专家知识辅助人机交互解译方法,研发了中国土地利用变化(2015—2020年)和2020年土地利用现状矢量数据(CLUD 2020),建立了完整的30 a(20世纪80年代末—2020年)每隔5 a的30 m分辨率中国土地利用动态数据库。基于CLUD 2020数据,从全国和区域两个尺度揭示了2015—2020年中国土地利用变化的总体规律、区域分异和主要特征。研究表明:将遥感大数据云计算生成的30 m分辨率植被覆盖变化和地表类型变化检测信息融入到人机交互遥感解译方法,可有效地提高大范围土地利用变化遥感制图的效率和变化图斑辨识的准确性;精度评价表明,CLUD 2020一级类型制图的综合精度达95%。总体上,全国范围内国土空间开发强度与2010—2015年比较进入相对稳定状态。期间全国耕地面积仍保持减少态势,空间分异特征为耕地南减北增,东北松嫩平原及其与三江平原交界区大规模的旱地向水田转移,西北新疆南部开垦和北部退耕/撂荒并存;全国城乡建设用地持续增加,空间分异特征表现为由以往的沿海地区和超大、大城市集聚转向中西部地区的大中小城镇周边蔓延为主。全国范围的林草自然生态用地面积持续减少,但强度与2010—2015年比较有所下降;受气候变化的持续影响,青藏高原地区的河流湖泊等水域面积显著增加。以上土地利用变化格局与“十三五”期间国家高质量发展、生态文明建设宏观战略和气候变化的影响密切相关。
匡文慧 , 张树文 , 杜国明 , 颜长珍 , 吴世新 , 李仁东 , 陆灯盛 , 潘涛 , 宁静 , 郭长庆 , 董金玮 , 包玉海 , 迟文峰 , 窦银银 , 侯亚丽 , 尹哲睿 , 常丽萍 , 杨久春 , 谢家丽 , 邱娟 , 张汉松 , 张宇博 , 杨仕琪 , 萨日盖 , 刘纪远 . 2015—2020年中国土地利用变化遥感制图及时空特征分析[J]. 地理学报, 2022 , 77(5) : 1056 -1071 . DOI: 10.11821/dlxb202205002
The continuous remote sensing monitoring of land use/cover change at the national scale is of great scientific significance for land spatial planning and blueprint drawing of "Beautiful China" in the new era. Landsat 8 OLI, GF-2 and other satellite remote sensing data were used to develop the data of land use change across China during 2015-2020 and China Land Use/Cover Dataset in 2020 (CLUD 2020) by integrating remote sensing big data and expert knowledge-assisted human-computer interaction interpretation methods. Long time series land use dynamic database at a 30-m resolution in China was established at 5-year interval in the end of 1980s-2020. On this basis, the general trend, regional differences and main characteristics of land use change in 2015-2020 were revealed from national and regional scales. The research indicated that integrating vegetation cover change at a 30-m resolution and land change information generated by remotely sensed big-data cloud calculation into the expert human-computer interaction interpretation can effectively improve the efficiency of mapping and the accuracy of land use change detection. The overall accuracy of CLUD 2020 first-level type mapping reaches 95%. In general, the intensity of territorial development entered a stable state compared with 2010-2015. During the period, the cropland continued to decrease. Nationwide farmland was encroached by urban development and construction, paddy fields in Northeast China continued to decrease, and cultivated land in Xinjiang was reclaimed in the south and abandoned in the north. The built-up land continued to increase, showing a spatial pattern that "the expansion of built-up land changed from the agglomeration of coastal areas and mega and large cities in 2010-2015 to the surrounding sprawl of large, medium and small towns in the central and western regions in 2015-2020". Although the area of natural ecological land for forest and grass continued to decrease nationwide, the intensity decreased compared with 2010-2015. Under the continuous impact of climate change, the area of water in the Qinghai-Tibet Plateau increased significantly. The pattern of land use change is closely related to the national macro strategy for high-quality development during the "13th Five-Year Plan" period (2016-2020) and ecological civilization construction, as well as the impact of climate change.
Key words: land use; spatial pattern; cultivated land; urban expansion; cloud computation; remote sensing; China
表1 2020年中国土地利用精度一级类型混淆矩阵Tab. 1 The confusion matrix on the accuracy of 1st level classification from CLUD 2020 |
| 一级类型 | 真实样本数量(个) | 分类样本总数(个) | 用户 精度(%) | ||||||
|---|---|---|---|---|---|---|---|---|---|
| 耕地 | 林地 | 草地 | 水域 | 城乡建设用地 | 未利用地 | ||||
| 分类样本数量 | 耕地 | 5990 | 22 | 97 | 21 | 26 | 47 | 6203 | 96.57 |
| 林地 | 15 | 1123 | 3 | 3 | 0 | 11 | 1155 | 97.23 | |
| 草地 | 27 | 2 | 1292 | 17 | 1 | 13 | 1352 | 95.56 | |
| 水域 | 34 | 1 | 30 | 1836 | 4 | 21 | 1926 | 95.33 | |
| 城乡建设用地 | 294 | 58 | 43 | 20 | 7382 | 19 | 7816 | 94.45 | |
| 未利用地 | 18 | 0 | 3 | 2 | 0 | 565 | 588 | 96.09 | |
| 真实样本总数(个) | 6378 | 1206 | 1468 | 1899 | 7413 | 676 | 19040 | - | |
| 生产者精度(%) | 93.92 | 93.12 | 88.01 | 96.68 | 99.58 | 83.58 | 综合精度 | 95.53 | |
表2 2015—2020年中国土地利用转移矩阵(104 hm2)Tab. 2 Area of land use change across China during 2015-2020 (104 hm2) |
| 2015年 | 2020年 | ||||||
|---|---|---|---|---|---|---|---|
| 耕地 | 林地 | 草地 | 水域 | 城乡建设用地 | 未利用地 | 总计 | |
| 耕地 | - | 6.31 | 26.92 | 9.94 | 142.08 | 5.19 | 190.44 |
| 林地 | 6.39 | - | 0.54 | 1.31 | 28.80 | 0.51 | 37.55 |
| 草地 | 60.30 | 3.03 | - | 13.73 | 23.26 | 3.29 | 103.61 |
| 水域 | 16.80 | 0.90 | 5.30 | - | 6.63 | 4.26 | 33.89 |
| 城乡建设用地 | 8.36 | 0.81 | 1.49 | 1.31 | - | 1.50 | 13.47 |
| 未利用地 | 33.47 | 1.25 | 4.56 | 19.01 | 13.10 | - | 71.39 |
| 总计 | 125.32 | 12.30 | 38.81 | 45.30 | 213.87 | 14.75 | - |
表3 2015—2020年中国不同分区主要土地利用类型转移矩阵(104 hm2)Tab. 3 Area of dominant land use change types in different regions of China during 2015-2020 (104 hm2) |
| 土地利用 转换类型 | 旱地↔ 水田 | 耕地→ 林草 | 水域 扩大 | 城乡建设用地扩张 | 林地→ 耕地 | 林地→ 草地 | 草地→ 耕地 | 草地→ 林地 | 水域 收缩 |
|---|---|---|---|---|---|---|---|---|---|
| 东北区 | 49.55 | 3.74 | 0.61 | 22.05 | 0.56 | 0.13 | 3.56 | 0.55 | 4.33 |
| 华北区 | 1.64 | 4.84 | 2.91 | 29.61 | 1.11 | 0.19 | 11.57 | 1.59 | 1.59 |
| 华东区 | 0.72 | 1.14 | 5.50 | 58.85 | 0.58 | 0.03 | 0.79 | 0.13 | 11.31 |
| 华南区 | 0.02 | 0.25 | 0.38 | 17.71 | 1.06 | 0.04 | 0.06 | 0.05 | 0.05 |
| 华中区 | 0.26 | 0.42 | 4.04 | 32.98 | 0.28 | 0.01 | 0.01 | 0.17 | 0.41 |
| 西北区 | 0.01 | 22.55 | 23.19 | 27.15 | 2.23 | 0.12 | 43.75 | 0.41 | 8.41 |
| 西南区 | 0.00 | 0.30 | 8.67 | 25.52 | 0.58 | 0.02 | 0.56 | 0.12 | 1.08 |
| 总计 | 52.20 | 33.24 | 45.30 | 213.87 | 6.40 | 0.54 | 60.30 | 3.02 | 27.18 |
表4 2010—2015年和2015—2020年不同区域土地利用类型面积变化比较(104 hm2)Tab. 4 The comparison of land use change area in different regions of China between 2010-2015 and 2015-2020 (104 hm2) |
| 区域 | 2010—2015年 | 2015—2020年 | |||||||||||
|---|---|---|---|---|---|---|---|---|---|---|---|---|---|
| 耕地 | 林地 | 草地 | 水域 | 城乡建设用地 | 未利用地 | 耕地 | 林地 | 草地 | 水域 | 城乡建设用地 | 未利用地 | ||
| 东北区 | 5.02 | -4.29 | -2.76 | -0.07 | 10.39 | -8.29 | -6.99 | 0.49 | -3.49 | -4.19 | 21.74 | -7.52 | |
| 华北区 | -12.76 | 1.30 | -8.64 | 1.74 | 40.41 | -15.85 | -8.06 | 0.01 | -14.91 | 0.57 | 25.82 | -3.44 | |
| 华东区 | -65.04 | -9.35 | 1.71 | 5.39 | 67.74 | -0.10 | -33.78 | -4.11 | -2.72 | -9.43 | 50.41 | -0.13 | |
| 华南区 | -10.59 | -13.05 | 3.17 | -0.35 | 20.77 | 0.04 | -8.17 | -8.33 | -0.91 | -0.06 | 17.44 | 0.03 | |
| 华中区 | -25.74 | -10.12 | -1.45 | 0.71 | 33.54 | 0.00 | -28.74 | -5.23 | -1.53 | 2.72 | 32.64 | 0.11 | |
| 西北区 | 88.07 | -3.37 | -99.73 | 5.88 | 42.59 | -28.74 | 35.52 | -1.49 | -32.32 | 14.36 | 26.90 | -43.16 | |
| 西南区 | -27.97 | -8.43 | -10.01 | 5.37 | 31.38 | 1.48 | -14.90 | -6.59 | -8.92 | 7.44 | 25.45 | -2.53 | |
| 总计 | -49.01 | -47.31 | -117.71 | 18.67 | 246.82 | -51.46 | -65.12 | -25.25 | -64.80 | 11.41 | 200.40 | -56.64 | |
表5 2010—2015年和2015—2020年中国土地利用类型转换分区特征及比较Tab. 5 Regional characteristics and comparison of land use change across China between 2010-2015 and 2015-2020 |
| 分区 | 分区面积(106 hm2) | 2010—2015年 | 2015—2020年 | 空间差异 |
|---|---|---|---|---|
| 东北区 | 78.79 | 以耕地转为城乡建设用地(约8×10⁴ hm2)和未利用地转为耕地(约6×10⁴ hm2)为主,林地和草地转为耕地(均约4×10⁴ hm2)次之 | 以耕地转为城乡建设用地(约18×104 hm2)和未利用地转为耕地为主(约7×10⁴ hm2),水域和草地转为耕地(均约4×10⁴ hm2)次之 | 主要土地利用变化类型有一定改变,耕地转为城乡建设用地面积增加,水域转为耕地面积增加,林地转为耕地面积减少。旱地向水田转换的面积进一步缩小,空间范围由三江平原向松嫩平原及与其交界区转移 |
| 华北区 | 155.51 | 以耕地转为城乡建设用地(约17×104 hm2)为主,草地转为城乡建设用地(约16×104 hm2)次之 | 以耕地转为城乡建设用地(约18×104 hm2)为主,草地转为城乡建设用地(约12×104 hm2)次之 | 主要土地利用变化类型基本未变,草地转为城乡建设用地面积减少1/4。空间上生态退耕面积进一步缩小,耕地开垦面积略有增加 |
| 华东区 | 79.54 | 以耕地转为城乡建设用地(约64×104 hm2)为主,耕地转为水域和林地转为城乡建设用地(均约8×10⁴ hm2)次之 | 以耕地转为城乡建设用地(约48×104 hm2)为主,耕地转为水域(约11×104 hm2)次之 | 主要土地利用变化类型有一定改变,耕地转为城乡建设用地面积减少1/4,耕地转为水域面积增加,林地转为城乡建设用地面积减少。空间上城市化占用优质耕地趋势减弱 |
| 华南区 | 44.78 | 以耕地转为城乡建设用地(约11×104 hm2)为主,林地转为草地和城乡建设用地(均约8×10⁴ hm2)次之 | 以耕地转为城乡建设用地(约9×10⁴ hm2)为主,林地转为城乡建设用地(约8×10⁴ hm2)次之 | 主要土地利用变化类型有一定改变,耕地转为城乡建设用地面积减少,林地转为城乡建设用地面积基本未变,林地转为草地面积大幅减少。空间上森林采伐或干扰程度减弱 |
| 华中区 | 56.47 | 以耕地转为城乡建设用地(约24×104 hm2)为主,林地转为城乡建设用地(约10×104 hm2)次之 | 以耕地转为城乡建设用地(约26×104 hm2)为主,林地转为城乡建设用地(约5×10⁴ hm2)次之 | 主要土地利用变化类型基本未变,耕地转为城乡建设用地面积增加,林地转为城乡建设用地面积减少1/2。空间上城市化占用优质耕地趋势略有上升 |
| 西北区 | 308.26 | 以草地转为耕地(约87×104 hm2)为主,未利用地转为耕地(约26×104 hm2)次之 | 以草地转为耕地(约44×104 hm2)为主,未利用地转为耕地(约22×104 hm2)次之 | 主要土地利用变化类型基本未变,发生土地利用变化的区域有所缩小,草地转为耕地面积减少1/2,未利用地转为耕地面积减少。空间上表现为新疆由开垦为主向南部开垦和北部退耕/撂荒并存的空间分异特征 |
| 西南区 | 236.65 | 以耕地转为城乡建设用地(约24×104 hm2)为主,水域转为未利用地和草地转为水域(均约6×10⁴ hm2)次之 | 以耕地转为城乡建设用地(约16×104 hm2)为主,林地转为城乡建设用地(约6×10⁴ hm2)和草地转为水域(约5×10⁴ hm2)次之 | 主要土地利用变化类型有一定改变,耕地转为城乡建设用地面积减少1/3,水域转为未利用地大幅减少,林地转为城乡建设用地面积增加,草地转为水域面积减少。空间上青藏高原水域扩大明显增强 |
感谢CLUD2020遥感解译团队各位成员在数据采集方面的贡献;感谢审稿人提出的宝贵修改意见。
| [1] |
|
| [2] |
[刘纪远, 张增祥, 张树文, 等. 中国土地利用变化遥感研究的回顾与展望: 基于陈述彭学术思想的引领. 地球信息科学学报, 2020, 22(4): 680-687.]
|
| [3] |
|
| [4] |
|
| [5] |
IGBP. Science Plan and Implementation Strategy. Stockholm: IGBP Secretariat, 2005.
|
| [6] |
[刘纪远, 宁佳, 匡文慧, 等. 2010-2015年中国土地利用变化的时空格局与新特征. 地理学报, 2018, 73(5): 789-802.]
|
| [7] |
|
| [8] |
[刘纪远, 张增祥, 徐新良, 等. 21世纪初中国土地利用变化的空间格局与驱动力分析. 地理学报, 2009, 64(12): 1411-1420.]
|
| [9] |
Global Land Programme (GLP). Science plan and implementation strategy, 2016. https://www.glp.earth/our-science/science-plan.
|
| [10] |
[何春阳, 张金茜, 刘志锋, 等. 1990-2018年土地利用/覆盖变化研究的特征和进展. 地理学报, 2021, 76(11): 2730-2748.]
|
| [11] |
|
| [12] |
|
| [13] |
|
| [14] |
|
| [15] |
|
| [16] |
|
| [17] |
|
| [18] |
|
| [19] |
|
| [20] |
|
| [21] |
|
| [22] |
|
| [23] |
|
| [24] |
|
| [25] |
|
| [26] |
|
| [27] |
[刘纪远. 中国资源环境遥感宏观调查与动态研究. 北京: 中国科学技术出版社, 1996.]
|
| [28] |
|
| [29] |
[刘纪远, 匡文慧, 张增祥, 等. 20世纪80年代末以来中国土地利用变化的基本特征与空间格局. 地理学报, 2014, 69(1): 3-14.]
|
| [30] |
[刘纪远, 张增祥, 庄大方, 等. 20世纪90年代中国土地利用变化时空特征及其成因分析. 地理研究, 2003, 22(1): 1-12.]
|
| [31] |
|
| [32] |
|
| [33] |
|
| [34] |
|
| [35] |
|
| [36] |
National Bureau of Statistics of China. China Statistical Yearbook 2021. Beijing: China Statistics Press, 2021.
[中国国家统计局. 中国统计年鉴2021. 北京: 中国统计出版社, 2021.]
|
/
| 〈 |
|
〉 |

