
京津冀地区光伏开发空间适宜性及减排效益评估
|
刘立程(1994-), 男, 甘肃民勤人, 博士生, 研究方向为资源与环境政策评估。E-mail: liulicheng@cau.edu.cn |
收稿日期: 2021-04-19
要求修回日期: 2021-12-31
网络出版日期: 2022-05-23
基金资助
国家自然科学基金项目(71774151)
国家自然科学基金项目(51861125101)
中国科学院战略性先导科技专项(XDA23070402)
版权
Evaluation of suitability and emission reduction benefits of photovoltaic development in Beijing-Tianjin-Hebei region
Received date: 2021-04-19
Request revised date: 2021-12-31
Online published: 2022-05-23
Supported by
National Natural Science Foundation of China(71774151)
National Natural Science Foundation of China(51861125101)
Strategic Priority Research Program of Chinese Academy of Sciences(XDA23070402)
Copyright
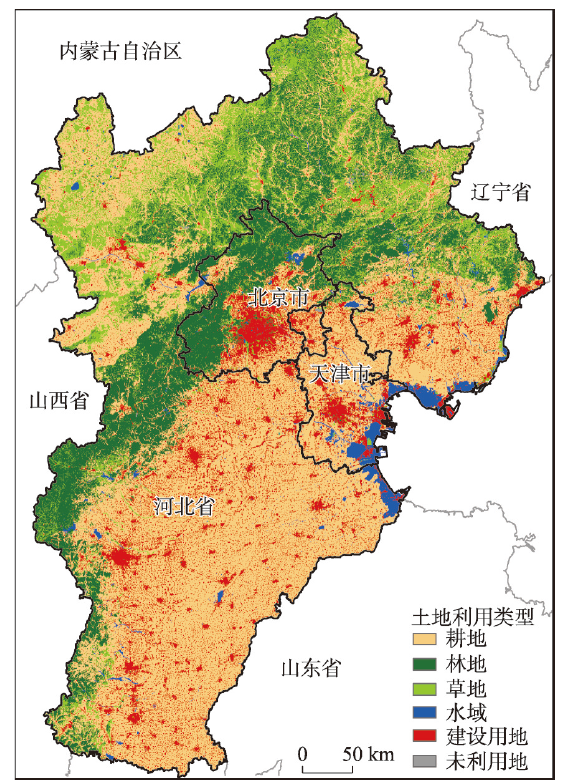
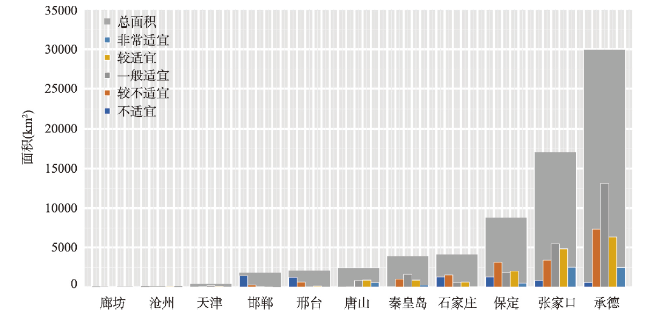
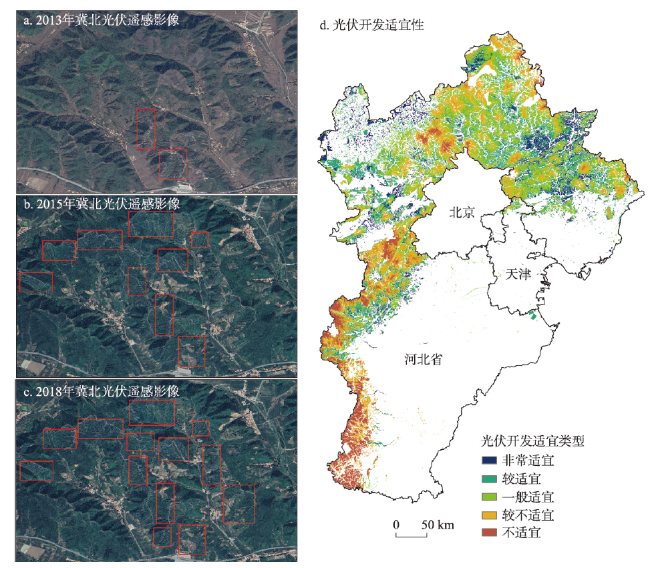
京津冀地区作为中国重要的能源消费基地,近年在产业转型与发展中对清洁能源的需求不断增加。光伏发电是中国“十四五”期间加速能源结构转型,早日实现碳中和目标的关键举措与重要抓手。本文以京津冀为研究区,通过构建“地形—气象—成本”光伏开发适宜性综合评价指标体系,计算了光伏开发适宜性指数,刻画出京津冀地区2018年光伏开发适宜性的空间格局特征,进而定量评估不同开发适宜性情景下光伏发电潜力与减排效益。研究表明:① 京津冀地区光伏开发适宜区占到区域总面积的22%,一般适宜区面积最广,“燕山—太行山”一线是适宜区与不适宜区的主要分界线,各类适宜区主要分布在承德、张家口和保定市3个市。 ② 京津冀地区光伏发电发展潜力巨大,开发非常适宜区和较适宜区的年发电潜力是2018年京津冀地区电力消耗的3倍。③ 光伏发电节能减排效果显著。在将非常适宜区和较适宜区全部开发情景下碳减排量为京津冀2018年排放量的47%。④ 土地利用限制、大型输电网络和储能系统是制约光伏发展的主要因素。总体来看,虽然大规模光伏开发仍存在一定的限制条件与技术瓶颈,但在全球气候变化加剧和社会经济发展进入“低碳脱碳”新常态的背景下,京津冀地区的大规模光伏开发仍是助力区域早日实现碳中和目标、优化能源结构和提升人民福祉的重要途径。

刘立程 , 孙中孝 , 吴锋 , 张雪靓 , 张倩 . 京津冀地区光伏开发空间适宜性及减排效益评估[J]. 地理学报, 2022 , 77(3) : 665 -678 . DOI: 10.11821/dlxb202203012
As a fundamental energy consumption base in China, the Beijing-Tianjin-Hebei (BTH) region has experienced an increasing demand for clean energy in recent years. Photovoltaic power generation is a key for accelerating the transformation of energy infrastructure in China and achieving the goal of carbon neutrality during the 14th Five-Year Plan period (2021-2025). Taking the BTH region as a study area, we construct a comprehensive evaluation index system of "terrain-weather-cost" to calculate a photovoltaic development suitability index. We subsequently analyze the spatial pattern characteristics of photovoltaic development suitability in the study area in 2018 and quantitatively examine power generation potential and emission reduction effect under different scenarios of photovoltaic development suitability. Results indicate that: (1) The suitable areas for photovoltaic development account for 22% of the total area of this region, and the largest portion of this area is moderately suitable for photovoltaic development. The "Yanshan-Taihang mountains" line geographically divides the areas that are suitable and unsuitable for photovoltaic development, and a range of potential areas are distributed in prefecture-level cities of Chengde, Zhangjiakou and Baoding. (2) Photovoltaic power generation in the BTH region has great potential. Specifically, the annual power generation potential of the extremely and highly suitable areas is about three times more than the total power consumption in the same year of 2018. (3) The energy-saving and emission reduction effects of photovoltaic power generation are remarkable. If the extremely and highly suitable areas are used for photovoltaic development, there will be an approximate 47% reduction in carbon emissions across the whole region, according to the data of 2018. (4) Despite being restricted by limited land resources and the absence of an advanced transmission network or energy storage system, large-scale photovoltaic development is still a viable solution to energy supply issues. It still improves energy infrastructure, achieves the goal of carbon neutrality, and enhances the well-being of citizens in the context of global climate change and the new low-carbon economy.
表1 评价指标数据及其预处理Tab. 1 Evaluation indicators and data pre-processing |
| 指标名称 | 处理方法 | 数据来源 |
|---|---|---|
| 年太阳总辐射 | 站点数据Anusplin插值为百米栅格数据 | 中国气象数据网 |
| 年日照时数 | 站点数据Anusplin插值为百米栅格数据 | 中国气象数据网 |
| 数字高程模型 | 拼接(Mosaic)后重采样(Resample)为百米栅格数据 | 地理空间数据云 |
| 坡度 | 采用坡度(Slope)工具计算得到百米栅格数据 | 根据DEM数据计算 |
| 土地利用类型 | LUCC 100×100 m栅格数据 | 中国科学院资源环境科学与数据中心 |
| 地貌类型 | 中国1:100万地貌类型重采样(Resample)为百米栅格数据 | 中国科学院资源环境科学与数据中心 |
| 距城镇距离 | 欧式距离(Euclidean distance)计算得到百米栅格数据 | 国家基础地理信息中心 |
| 距道路距离 | 欧式距离(Euclidean distance)计算得到百米栅格数据 | 国家基础地理信息中心 |
表2 多重共线性检验结果Tab. 2 Results of multicollinearity test |
| 指标名称 | 方差膨胀因子 (VIF) | 容忍度 (TOL) |
|---|---|---|
| 年太阳总辐射(ASR) | 3.93 | 0.25 |
| 数字高程模型(DEM) | 3.54 | 0.28 |
| 年日照时数(ASH) | 2.6 | 0.38 |
| 坡度(SLO) | 1.88 | 0.53 |
| 距城镇距离(DFC) | 1.74 | 0.57 |
| 土地利用类型(STY) | 1.5 | 0.66 |
| 距道路距离(DFR) | 1.42 | 0.70 |
| 地貌类型(GEO) | 1.11 | 0.89 |
表3 主成分的特征值及其贡献率Tab. 3 Characteristic values of principal components and their contribution rates |
| 主成分 | 特征值 | 方差贡献率(%) | 累计方差贡献率(%) |
|---|---|---|---|
| PC1 | 4.45 | 55.72 | 55.72 |
| PC2 | 1.18 | 14.77 | 70.50 |
| PC3 | 0.87 | 10.92 | 81.43 |
| PC4 | 0.57 | 7.23 | 88.66 |
| PC5 | 0.47 | 5.95 | 94.61 |
| PC6 | 0.22 | 2.80 | 97.42 |
| PC7 | 0.14 | 1.76 | 99.18 |
| PC8 | 0.06 | 0.81 | 100 |
表4 主成分载荷矩阵Tab. 4 Principal component load matrix |
| 指标 | PC1 | PC2 | PC3 | PC4 | PC5 | PC6 | PC7 | PC8 | 权重(%) |
|---|---|---|---|---|---|---|---|---|---|
| DFR | 0.49 | 0.15 | 0.78 | -0.31 | -0.10 | -0.07 | -0.01 | 0.01 | 11.36 |
| DFC | 0.65 | 0.30 | 0.25 | 0.63 | 0.08 | -0.08 | -0.03 | -0.01 | 12.52 |
| DEM | 0.86 | 0.26 | -0.02 | -0.05 | 0.08 | 0.40 | -0.02 | 0.02 | 12.05 |
| SLO | 0.82 | 0.46 | -0.03 | -0.05 | 0.25 | -0.07 | 0.03 | 0.18 | 12.73 |
| GEO | 0.86 | 0.35 | -0.01 | -0.06 | 0.26 | -0.04 | 0.10 | -0.18 | 12.69 |
| STY | 0.57 | 0.63 | 0.01 | 0.15 | -0.48 | 0.06 | -0.05 | -0.02 | 11.97 |
| ASH | -0.76 | 0.43 | 0.27 | 0.06 | 0.28 | 0.09 | -0.23 | -0.03 | 13.44 |
| ASR | -0.82 | 0.25 | 0.35 | 0.18 | 0.02 | 0.15 | 0.25 | 0.02 | 13.25 |
表5 光伏发电潜力估算参数设置Tab. 5 Parameters of photovoltaic power generation potential |
| 参数 | 设定依据 | 参数值 |
|---|---|---|
| AF | 承德市正北沟光伏发电厂实地调研 | 0.35 |
| ASR | 统计插值后的单位面积太阳总辐射 | 5621 |
| PE | 采用目前应用最为广泛的多晶硅电池板的发电转换率 | 16.5% |
| LO | Li等[33] | 7.5% |
| AP | 国家可再生能源中心(http://www.nea.gov.cn/) | 1.8% |
表6 京津冀不同光伏开发情景下的发电潜力Tab. 6 Power generation potential under different photovoltaic development scenarios in Beijing-Tianjin-Hebei region |
| 开发情景 | 情景释义 | 面积(km2) | 发电潜力(亿kWh) | |
|---|---|---|---|---|
| S1 | S1-Q1 | 非常适宜区开发25% | 1622.59 | 1337.09 |
| S1-Q2 | 非常适宜区开发50% | 3245.10 | 2674.17 | |
| S1-Q3 | 非常适宜区开发75% | 4867.64 | 4011.26 | |
| S1-Q4 | 非常适宜区开发100% | 6490.19 | 5348.34 | |
| S2 | S2-Q1 | 较适宜区开发25% | 4011.38 | 3305.64 |
| S2-Q2 | 较适宜区开发50% | 8022.76 | 6611.28 | |
| S2-Q3 | 较适宜区开发75% | 12034.13 | 9916.91 | |
| S2-Q4 | 较适宜区开发100% | 16045.51 | 13222.55 | |
注:S1景下,S1-Q1情景、S1-Q2情景、S1-Q3情景均已开发; S2情景下,S2-Q1情景、S2-Q2情景、S2-Q3情景均已开发。 |
表7 不同光伏开发强度下的减排效果Tab. 7 Emission reduction effect under different scenarios of photovoltaic development intensity |
| 开发情景 | 情景释义 | 减排物(万t) | |||||
|---|---|---|---|---|---|---|---|
| 氮氧化物 | 二氧化硫 | 粉尘 | 标准煤 | 二氧化碳 | |||
| S1 | S1-Q1 | 非常适宜区开发25% | 200.56 | 401.12 | 3636.87 | 5348.34 | 13330.74 |
| S1-Q2 | 非常适宜区开发50% | 401.12 | 802.25 | 7273.74 | 10696.68 | 26661.47 | |
| S1-Q3 | 非常适宜区开发75% | 601.68 | 1203.37 | 10910.61 | 16045.02 | 39992.21 | |
| S1-Q4 | 非常适宜区开发100% | 802.25 | 1604.50 | 14547.48 | 21393.36 | 53322.95 | |
| S2 | S2-Q1 | 较适宜区开发25% | 495.84 | 991.69 | 8991.33 | 13222.55 | 32957.21 |
| S2-Q2 | 较适宜区开发50% | 991.69 | 1983.38 | 17982.67 | 26445.1 | 65914.42 | |
| S2-Q3 | 较适宜区开发75% | 1487.53 | 2975.07 | 26974.01 | 39667.66 | 98871.63 | |
| S2-Q4 | 较适宜区开发100% | 1983.38 | 3966.76 | 35965.34 | 52890.21 | 131828.8 | |
| [1] |
|
| [2] |
[王少剑, 黄永源. 中国城市碳排放强度的空间溢出效应及驱动因素. 地理学报, 2019, 74(6): 1131-1148.]
|
| [3] |
|
| [4] |
|
| [5] |
|
| [6] |
[潘竟虎, 张永年. 中国能源碳足迹时空格局演化及脱钩效应. 地理学报, 2021, 76(1): 206-222.]
|
| [7] |
|
| [8] |
|
| [9] |
|
| [10] |
|
| [11] |
|
| [12] |
|
| [13] |
|
| [14] |
|
| [15] |
|
| [16] |
|
| [17] |
|
| [18] |
|
| [19] |
|
| [20] |
|
| [21] |
|
| [22] |
|
| [23] |
|
| [24] |
|
| [25] |
[袁小康, 谷晓平, 王济. 中国太阳能资源评估研究进展. 贵州气象, 2011, 35(5): 1-4.]
|
| [26] |
[肖建华, 姚正毅, 孙家欢. 并网太阳能光伏电站选址研究述评. 中国沙漠, 2011, 31(6): 1598-1605.]
|
| [27] |
[赵明智. 槽式太阳能热发电站微观选址的方法研究[D]. 呼和浩特: 内蒙古工业大学, 2009. ]
|
| [28] |
|
| [29] |
[郭泽呈, 魏伟, 庞素菲, 等. 基于SPCA和遥感指数的干旱内陆河流域生态脆弱性时空演变及动因分析: 以石羊河流域为例. 生态学报, 2019, 39(7): 2558-2572.]
|
| [30] |
[李青圃, 张正栋, 万露文, 等. 基于景观生态风险评价的宁江流域景观格局优化. 地理学报, 2019, 74(7): 1420-1437.]
|
| [31] |
[张乾, 辛晓洲, 张海龙, 等. 基于遥感数据和多因子评价的中国地区建设光伏电站的适宜性分析. 地球信息科学学报, 2018, 20(1): 119-127.]
|
| [32] |
|
| [33] |
|
| [34] |
|
| [35] |
|
| [36] |
|
| [37] |
|
| [38] |
Department of Energy, National Bureau of Statistics. China Energy Statistics Yearbook, 2019. Beijing: China Statistics Press, 2020.
[国家统计局能源司. 中国能源统计年鉴2019. 北京: 中国统计出版社, 2020.]
|
| [39] |
|
| [40] |
[翟波, 高永, 党晓宏, 等. 光伏电板对羊草群落特征及多样性的影响. 生态学杂志, 2018, 37(8): 2237-2243.]
|
| [41] |
|
| [42] |
|
| [43] |
|
| [44] |
|
| [45] |
|
| [46] |
|
/
| 〈 |
|
〉 |


