
雅鲁藏布江流域降水时空变化特征
|
张仪辉(1999-), 男, 山东烟台人, 硕士生, 主要从事流域水文过程对气候变化的响应机理研究。E-mail: 13671133021@163.com |
收稿日期: 2021-07-30
要求修回日期: 2021-12-26
网络出版日期: 2022-05-23
基金资助
第二次青藏高原综合科学考察研究(2019QZKK0903)
中国科学院青年创新促进会会员人才专项(2019054)
版权
Spatio-temporal variation of precipitation in the Yarlung Zangbo river basin
Received date: 2021-07-30
Request revised date: 2021-12-26
Online published: 2022-05-23
Supported by
The Second Tibetan Plateau Scientific Expedition and Research(2019QZKK0903)
Youth Innovation Promotion Association of the Chinese Academy of Sciences(2019054)
Copyright
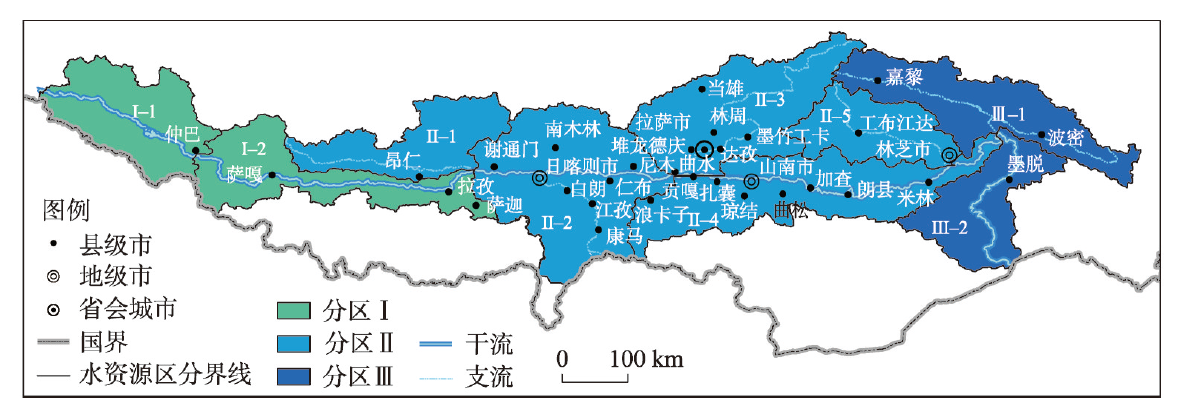
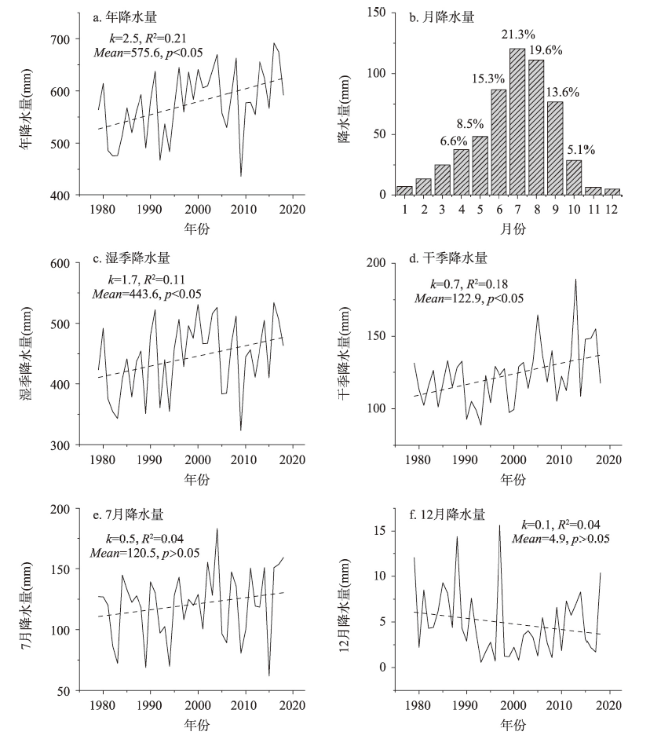
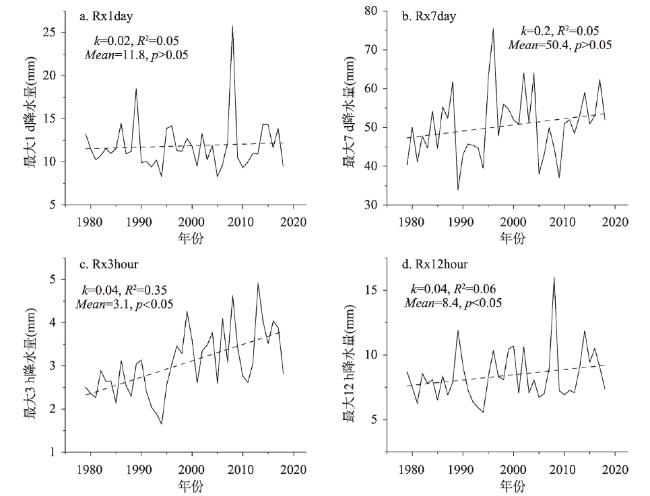
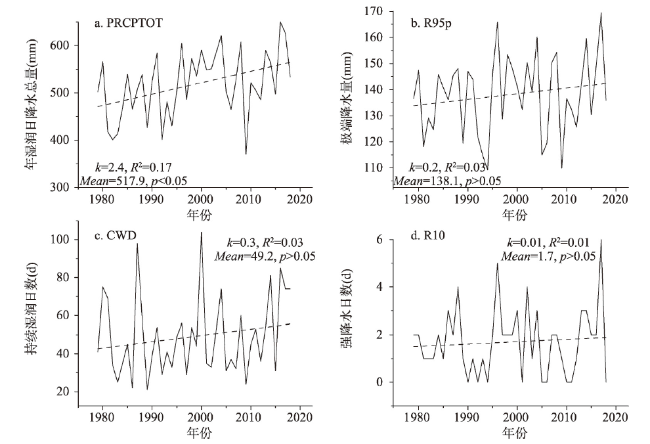
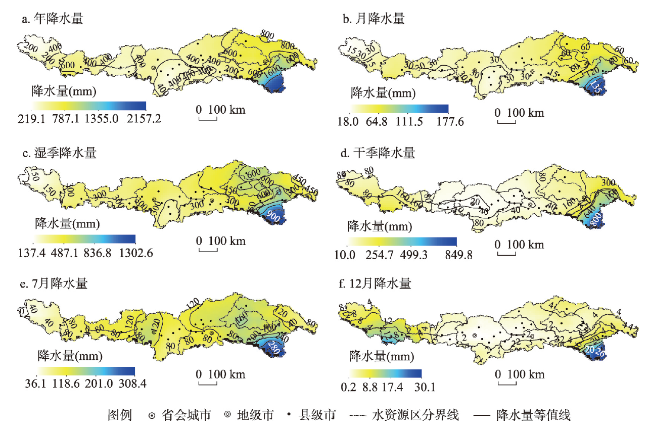
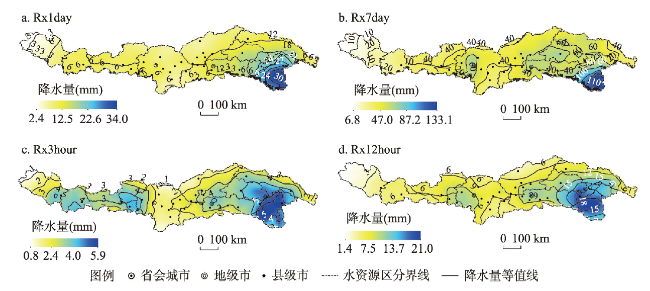
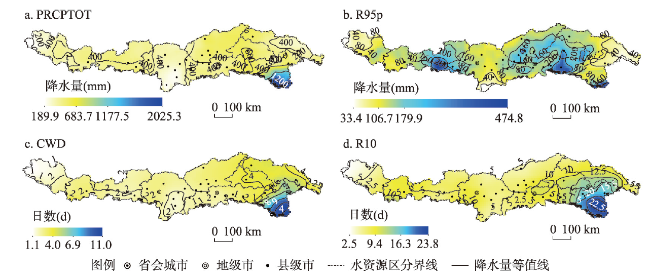
雅鲁藏布江流域是全球气候变化的敏感区,该流域降水变化对青藏高原的水系统、生态系统和山地灾害系统的演变具有重要影响。本文通过流域水文分析,将雅鲁藏布江流域的三大水资源区细分为9个分区。基于雅鲁藏布江流域1979—2018年降水数据,综合分析了雅鲁藏布江流域及9个分区的年、干湿季、月降水量以及日、小时尺度极端降水的时空变化特征,探讨了降水和典型大尺度大气环流因子的相关性。结果表明:① 1979—2018年间,在流域尺度上,各时间尺度降水整体上均呈上升趋势。其中,年降水量上升趋势最大,为2.5 mm·a-1;年、干湿季降水量以及典型小时尺度极端降水(Rx3hour、Rx12hour)均在95%信度水平下显著上升。在水资源分区尺度上,各分区不同时间尺度降水的变化趋势呈现更明显的非一致性,所有分区除小时尺度极端降水均呈上升趋势外,其余时间尺度降水的趋势变化方向各异。② 雅鲁藏布江流域降水存在明显的空间分异性,且降水空间分异性会随着降水指标时间尺度的缩短而增强。各时间尺度降水整体上均呈现出自东部向西部逐渐减少的趋势,流域东南部(分区Ⅲ-2)始终是高值中心,流域中西部(分区Ⅰ-2、Ⅱ-1)存在区域性高值中心。③ 北半球副热带高压和北半球极涡对雅鲁藏布江流域降水变化具有显著影响。研究结果有助于掌握当地降水的多尺度变化特征,可为雅鲁藏布江流域和青藏高原地区的水循环研究、水资源开发利用和山洪灾害防治等提供科学基础。
张仪辉 , 刘昌明 , 梁康 , 吕锦心 . 雅鲁藏布江流域降水时空变化特征[J]. 地理学报, 2022 , 77(3) : 603 -618 . DOI: 10.11821/dlxb202203008
The Yarlung Zangbo river basin (YZRB) is sensitive to global climate change. The precipitation changes in the YZRB have a great impact on the evolutions of water system, ecosystem and mountain disaster system on the Qinghai-Tibet Plateau. In this study, we divided three water resources regions of the YZRB into nine subregions through hydrological analysis. Based on precipitation data within the YZRB from 1979 to 2018, we examined the spatio-temporal variations of precipitation at annual, wet and dry seasons, monthly scales, daily and hourly extreme precipitation in the study area and its nine subregions. We further discussed the correlation between precipitation and typical large-scale atmospheric circulation factors. The results showed that: (1) From 1979 to 2018, at the whole basin scale, precipitation at each time scale showed an overall upward trend. Among them, annual precipitation showed the largest increasing trend of 2.5 mm·a-1. Annual precipitation, dry and wet precipitation, and typical hourly scale extreme precipitation (Rx3hour and Rx12hour) increased significantly at the 95% confidence level. At the regional scale, the variation trend of precipitation at different time scales in each subregion showed more obvious inconsistencies. Except for the increasing trend of hourly scale extreme precipitation, the trends of precipitation in all the subregions were different. (2) There was an obvious spatial heterogeneity of precipitation in the YZRB, and the spatial heterogeneity of precipitation did increase with the shortening of the precipitation time scale. The precipitation at each time scale showed a gradual decreasing trend from the east to the west. The southeastern part of the YZRB (i.e. subregion Ⅲ-2) had been the center of high value, and the central and western parts (i.e. subregions Ⅰ-2 and Ⅱ-1) had a regional high value center. (3) The Northern Hemisphere Subtropical High (NHSH) and the Northern Hemisphere Polar Vortex (NHPV) had significant effects on precipitation changes. The results can help us to understand the characteristics of local precipitation at multiple scales, and provide a scientific basis for water cycle research, water resources development and utilization, and prevention of flash flood disasters in the YZRB and the Qinghai-Tibet Plateau.
图1 雅鲁藏布江流域水资源分区及主要城镇分布注:基于自然资源部标准地图服务网站审图号为GS(2020)4619号标准地图制作,底图边界无修改。 Fig. 1 Distribution of water resources subregions and main towns in the Yarlung Zangbo river basin |
表1 雅鲁藏布江流域水资源分区概况Tab. 1 Overview of water resources subregions in the Yarlung Zangbo river basin |
| 水资源分区编号 | 分区内主要河流 | 集水面积(km2) | 长度(km) | 河口位置 | |
|---|---|---|---|---|---|
| 北纬 | 东经 | ||||
| Ⅰ-1 | 雅鲁藏布江 | 24189 | 311 | 29°56′ | 84°18′ |
| Ⅰ-2 | 雅鲁藏布江 | 24317 | 374 | 29°10′ | 87°99′ |
| Ⅱ-1 | 多雄藏布 | 19697 | 303 | 29°23′ | 87°58′ |
| Ⅱ-2 | 年楚河 | 11101 | 223 | 29°19′ | 88°54′ |
| 雅鲁藏布江 | 40832 | 241 | 29°24′ | 91°41′ | |
| Ⅱ-3 | 拉萨河 | 32471 | 551 | 29°19′ | 90°45′ |
| Ⅱ-4 | 雅鲁藏布江 | 35075 | 594 | 28°99′ | 94°56′ |
| Ⅱ-5 | 尼洋河 | 17732 | 286 | 29°25′ | 94°28′ |
| Ⅲ-1 | 帕隆藏布 | 28600 | 266 | 29°52′ | 95°07′ |
| Ⅲ-2 | 雅鲁藏布江 | 19988 | 496 | 28°01′ | 95°35′ |
表2 雅鲁藏布江流域极端降水指标Tab. 2 Extreme precipitation indexes in the Yarlung Zangbo river basin |
| 指标类别 | 指标 | 指标名称 | 定义 | 单位 |
|---|---|---|---|---|
| 极值指标 | Rx1day | 最大1 d降水量 | 年最大1 d降水量 | mm |
| Rx7day | 最大7 d降水量 | 年连续7 d最大降水总量 | mm | |
| Rx3hour | 最大3 h降水量 | 年最大3 h降水量 | mm | |
| Rx12hour | 最大12 h降水量 | 年最大12 h降水量 | mm | |
| 阈值指标 | PRCPTOT | 年湿润日降水总量 | 一年中降水量大于1 mm/d的降水总量 | mm |
| R95p | 极端降水量 | 一年中降水量超过序列中第95个百分位的降水量之和 | mm | |
| CWD | 持续湿润日数 | 一年中降水量大于1 mm/d的最大持续日数 | d | |
| R10 | 强降水日数 | 一年中降水量大于10 mm/d的总日数 | d |
表3 雅鲁藏布江流域各月份降水概况Tab. 3 Overview of monthly precipitation in the Yarlung Zangbo river basin |
| 月份 | 平均降水量(mm) | 变化趋势(mm·a-1) | 月最高降水量 | 月最低降水量 | 变差系数Cv | |||
|---|---|---|---|---|---|---|---|---|
| 年份 | 数值(mm) | 年份 | 数值(mm) | |||||
| 1 | 7.0 | 0.1 | 1989 | 25.8 | 2006 | 0.2 | 0.77 | |
| 2 | 13.5 | 0.1 | 2007 | 31.7 | 1985 | 5.0 | 0.40 | |
| 3 | 25.0 | 0.2* | 1998 | 39.2 | 1990 | 10.5 | 0.29 | |
| 4 | 37.6 | 0.3* | 2016 | 65.8 | 2009 | 21.3 | 0.28 | |
| 5 | 48.3 | 0.5* | 2000 | 72.1 | 1986 | 27.6 | 0.23 | |
| 6 | 86.8 | 0.4 | 2004 | 122.7 | 1987 | 46.0 | 0.24 | |
| 7 | 120.5 | 0.5 | 2004 | 183.4 | 2015 | 61.8 | 0.23 | |
| 8 | 111.2 | 0.4 | 1998 | 178.8 | 1982 | 53.4 | 0.26 | |
| 9 | 76.8 | -0.02 | 2016 | 122.5 | 2009 | 36.5 | 0.26 | |
| 10 | 28.7 | 0.01 | 2013 | 54.5 | 1981 | 8.9 | 0.39 | |
| 11 | 6.3 | 0.1 | 2006 | 16.1 | 1980 | 1.0 | 0.63 | |
| 12 | 4.9 | -0.1 | 1997 | 15.6 | 1993 | 0.6 | 0.14 | |
注:*表示通过95%置信水平检验,下同。 |
表4 雅鲁藏布江流域水资源分区年、干湿季和月降水量概况Tab. 4 Overview of annual, wet and dry season, and monthly precipitation in water resources subregions in the Yarlung Zangbo river basin |
| 水资源分区 | 年降水量 | 湿季降水量 | 干季降水量 | 月降水量 | |||||||||||
|---|---|---|---|---|---|---|---|---|---|---|---|---|---|---|---|
| 均值 (mm) | 趋势(mm·a-1) | 变差 系数 | 均值 (mm) | 趋势(mm·a-1) | 变差 系数 | 均值 (mm) | 趋势(mm·a-1) | 变差 系数 | 均值 (mm) | 趋势(mm·a-1) | 变差 系数 | ||||
| Ⅰ-1 | 330.9 | 3.3* | 0.24 | 211.5 | 1.9* | 0.29 | 115.4 | 1.3 | 0.47 | 27.2 | 0.3* | 0.24 | |||
| Ⅰ-2 | 472.0 | -1.8 | 0.16 | 343.7 | -2.2* | 0.18 | 121.0 | 0.4 | 0.38 | 38.7 | -0.1 | 0.16 | |||
| Ⅱ-1 | 413.6 | 2.0 | 0.18 | 356.5 | 1.0 | 0.20 | 49.5 | 0.9* | 0.37 | 33.8 | 0.2 | 0.18 | |||
| Ⅱ-2 | 394.2 | 2.3* | 0.21 | 357.4 | 1.5 | 0.22 | 29.3 | 0.7* | 0.48 | 32.2 | 0.2* | 0.21 | |||
| Ⅱ-3 | 528.6 | 3.5* | 0.18 | 456.9 | 2.3* | 0.18 | 62.9 | 1.1* | 0.33 | 43.3 | 0.3* | 0.18 | |||
| Ⅱ-4 | 530.2 | 4.5* | 0.18 | 434.5 | 2.9* | 0.20 | 86.9 | 1.5* | 0.29 | 43.4 | 0.4* | 0.18 | |||
| Ⅱ-5 | 698.5 | 3.4* | 0.16 | 574.0 | 2.0 | 0.17 | 113.6 | 1.4* | 0.23 | 57.3 | 0.3* | 0.16 | |||
| Ⅲ-1 | 759.1 | -4.1* | 0.14 | 546.5 | -3.7* | 0.16 | 201.6 | -0.3 | 0.18 | 62.3 | -0.3* | 0.14 | |||
| Ⅲ-2 | 1356.1 | 11.4* | 0.17 | 870.6 | 12.0* | 0.24 | 466.3 | -0.8 | 0.19 | 111.4 | 0.9* | 0.17 | |||
表5 雅鲁藏布江流域水资源分区降水极值指标概况Tab. 5 Overview of precipitation extremum indexes in water resources subregions in the Yarlung Zangbo river basin |
| 水资源分区 | Rx1day | Rx7day | Rx3hour | Rx12hour | |||||||||||
|---|---|---|---|---|---|---|---|---|---|---|---|---|---|---|---|
| 均值 (mm) | 趋势(mm·a-1) | 变差 系数 | 均值 (mm) | 趋势(mm·a-1) | 变差 系数 | 均值 (mm) | 趋势(mm·a-1) | 变差 系数 | 均值 (mm) | 趋势(mm·a-1) | 变差 系数 | ||||
| Ⅰ-1 | 19.6 | 0.03 | 0.59 | 40.4 | 0.3 | 0.39 | 7.8 | 0.2* | 0.54 | 14.9 | 0.4* | 0.50 | |||
| Ⅰ-2 | 21.3 | -0.2 | 0.64 | 53.7 | -0.4* | 0.30 | 8.0 | 0.2* | 0.55 | 15.8 | 0.3* | 0.43 | |||
| Ⅱ-1 | 16.5 | -0.1 | 0.30 | 55.8 | -0.3 | 0.24 | 7.1 | 0.1* | 0.42 | 16.2 | 0.3* | 0.37 | |||
| Ⅱ-2 | 13.5 | -0.1 | 0.17 | 55.8 | -0.2 | 0.20 | 5.1 | 0.1* | 0.37 | 13.1 | 0.2* | 0.31 | |||
| Ⅱ-3 | 14.9 | 0.03 | 0.18 | 57.1 | 0.2 | 0.14 | 6.1 | 0.1* | 0.37 | 16.1 | 0.3* | 0.32 | |||
| Ⅱ-4 | 16.4 | 0.2* | 0.28 | 61.3 | 0.5* | 0.23 | 5.2 | 0.1* | 0.32 | 13.6 | 0.3* | 0.34 | |||
| Ⅱ-5 | 18.8 | 0.1 | 0.20 | 72.0 | 0.3 | 0.21 | 7.2 | 0.1* | 0.31 | 19.9 | 0.3* | 0.28 | |||
| Ⅲ-1 | 19.5 | -0.1 | 0.31 | 69.7 | -0.6* | 0.28 | 6.3 | 0.1* | 0.43 | 15.4 | 0.1* | 0.24 | |||
| Ⅲ-2 | 41.8 | 0.9* | 0.50 | 130.9 | 4.5* | 0.26 | 12.8 | 0.4* | 0.48 | 30.3 | 0.9* | 0.40 | |||
表6 雅鲁藏布江流域水资源分区降水阈值指标概况Tab. 6 Overview of precipitation threshold indexes in water resources subregions in the Yarlung Zangbo river basin |
| 水资源分区 | PRCPTOT | R95p | CWD | R10 | |||||||||||
|---|---|---|---|---|---|---|---|---|---|---|---|---|---|---|---|
| 均值 (mm) | 趋势(mm·a-1) | 变差 系数 | 均值 (mm) | 趋势(mm·a-1) | 变差 系数 | 均值 (mm) | 趋势(mm·a-1) | 变差 系数 | 均值 (mm) | 趋势(mm·a-1) | 变差 系数 | ||||
| Ⅰ-1 | 274.5 | 2.8* | 0.28 | 129.2 | 1.0* | 0.28 | 11.8 | 0.1 | 0.37 | 2.6 | 0.04 | 0.77 | |||
| Ⅰ-2 | 421.6 | -2.3* | 0.18 | 163.8 | -0.7 | 0.21 | 23.8 | -0.03 | 0.51 | 4.5 | -0.1 | 0.66 | |||
| Ⅱ-1 | 365.8 | 1.6 | 0.21 | 156.8 | -0.1 | 0.17 | 23.6 | 0.2 | 0.41 | 4.9 | 0.01 | 0.63 | |||
| Ⅱ-2 | 352.2 | 2.0 | 0.24 | 152.6 | -0.03 | 0.17 | 21.4 | 0.02 | 0.42 | 4.5 | -0.1 | 0.68 | |||
| Ⅱ-3 | 482.4 | 3.2* | 0.20 | 167.6 | 0.5 | 0.13 | 24.6 | 0.3 | 0.44 | 5.5 | 0.1* | 0.53 | |||
| Ⅱ-4 | 469.0 | 4.4* | 0.22 | 168.6 | 1.1* | 0.19 | 28.4 | 0.3 | 0.39 | 5.8 | 0.1* | 0.64 | |||
| Ⅱ-5 | 650.1 | 3.4* | 0.17 | 210.7 | 0.6 | 0.14 | 27.3 | 0.2 | 0.37 | 12.1 | 0.1 | 0.42 | |||
| Ⅲ-1 | 710.5 | -4.2* | 0.15 | 204.0 | -1.9* | 0.21 | 33.0 | -0.1 | 0.39 | 9.7 | -0.2* | 0.55 | |||
| Ⅲ-2 | 1308.4 | 11.6* | 0.18 | 394.3 | 4.3* | 0.22 | 38.1 | 0.5* | 0.34 | 37.7 | 0.5* | 0.29 | |||
表7 雅鲁藏布江流域降水与大气环流因子的关系Tab. 7 Relationships between precipitation and atmospheric circulation factors in the Yarlung Zangbo river basin |
| 降水指标 | 北半球副高北界 | 北半球副高脊线 | 北半球极涡面积 | 北半球极涡强度指数 |
|---|---|---|---|---|
| 年降水量 | 0.38* | 0.40* | -0.44** | -0.44** |
| 湿季降水量 | 0.34* | 0.42** | -0.34* | -0.32* |
| 干季降水量 | 0.15 | -0.01 | -0.33* | -0.40* |
| 月降水量 | 0.43** | 0.42** | -0.49** | -0.48** |
| Rx1day | 0.01 | 0.18 | -0.21 | 0.01 |
| Rx7day | 0.16 | 0.18 | -0.06 | -0.13 |
| Rx3hour | 0.26 | 0.40* | -0.61** | -0.45** |
| Rx12hour | 0.16 | 0.37* | -0.46** | -0.15 |
| PRCPTOT | 0.40* | 0.42** | -0.39* | -0.42** |
| R95p | 0.33* | 0.28 | -0.22 | -0.19 |
| CWD | 0.33* | 0.19 | -0.07 | -0.24 |
| R10 | 0.18 | 0.17 | -0.03 | -0.03 |
注:*表示通过95%置信水平检验,**表示通过99%置信水平检验。 |
| [1] |
[郑度, 姚檀栋. 青藏高原形成演化及其环境资源效应研究进展. 中国基础科学, 2004, 6(2): 17-23.]
|
| [2] |
[姚檀栋, 陈发虎, 崔鹏, 等. 从青藏高原到第三极和泛第三极. 中国科学院院刊, 2017, 32(9): 924-931.]
|
| [3] |
[姚檀栋, 朱立平. 青藏高原环境变化对全球变化的响应及其适应对策. 地球科学进展, 2006, 21(5): 459-464.]
|
| [4] |
[陈德亮, 徐柏青, 姚檀栋, 等. 青藏高原环境变化科学评估: 过去、现在与未来. 科学通报, 2015, 60(32): 3025-3035.]
|
| [5] |
|
| [6] |
|
| [7] |
|
| [8] |
[杨浩, 崔春光, 王晓芳, 等. 气候变暖背景下雅鲁藏布江流域降水变化研究进展. 暴雨灾害, 2019, 38(6): 565-575.]
|
| [9] |
[汤秋鸿, 刘星才, 周园园, 等. “亚洲水塔”变化对下游水资源的连锁效应. 中国科学院院刊, 2019, 34(11): 1306-1312.]
|
| [10] |
[张寅生, 马颖钊, 郭燕红, 等. 青藏高原50年来水循环要素变化趋势及其区域差异性. 第四纪研究, 2012, 32(1): 95-102.]
|
| [11] |
[程国栋, 金会军. 青藏高原多年冻土区地下水及其变化. 水文地质工程地质, 2013, 40(1): 1-11.]
|
| [12] |
[姚檀栋, 秦大河, 沈永平, 等. 青藏高原冰冻圈变化及其对区域水循环和生态条件的影响. 自然杂志, 2013, 35(3): 179-186.]
|
| [13] |
[张建云, 刘九夫, 金君良, 等. 青藏高原水资源演变与趋势分析. 中国科学院院刊, 2019, 34(11): 1264-1273.]
|
| [14] |
[崔鹏, 郭晓军, 姜天海, 等. “亚洲水塔”变化的灾害效应与减灾对策. 中国科学院院刊, 2019, 34(11): 1313-1321.]
|
| [15] |
[刘业森, 杨振山, 黄耀欢, 等. 建国以来中国山洪灾害时空演变格局及驱动因素分析. 中国科学: 地球科学, 2019, 49(2): 408-420.]
|
| [16] |
|
| [17] |
[刘江涛, 徐宗学, 赵焕, 等. 1973—2016年雅鲁藏布江流域极端降水事件时空变化特征. 山地学报, 2018, 36(5): 750-764.]
|
| [18] |
|
| [19] |
[聂宁, 张万昌, 邓财. 雅鲁藏布江流域1978—2009年气候时空变化及未来趋势研究. 冰川冻土, 2012, 34(1): 64-71.]
|
| [20] |
|
| [21] |
[何静, 范广洲, 张永莉, 等. 气候变化背景下陆地季风与非季风区极端降水特征对比. 高原气象, 2021, 40(2): 324-332.]
|
| [22] |
|
| [23] |
[孔锋, 方建, 乔枫雪, 等. 透视中国小时极端降水强度和频次的时空变化特征(1961—2013年). 长江流域资源与环境, 2019, 28(12): 3051-3067.]
|
| [24] |
[杨志刚, 卓玛, 路红亚, 等. 1961—2010年西藏雅鲁藏布江流域降水量变化特征及其对径流的影响分析. 冰川冻土, 2014, 36(1): 166-172.]
|
| [25] |
|
| [26] |
|
| [27] |
|
| [28] |
|
| [29] |
[高志友, 王小丹, 尹观. 雅鲁藏布江径流水文规律及水体同位素组成. 地理学报, 2007, 62(9): 1002-1007.]
|
| [30] |
[张武龙, 张井勇, 范广洲. 我国西南地区干湿季降水的主模态分析. 大气科学, 2014, 38(3): 590-602.]
|
| [31] |
[魏凤英. 现代气候统计诊断与预测技术. 2版. 北京: 气象出版社, 2007.]
|
| [32] |
[林厚博, 游庆龙, 焦洋, 等. 基于高分辨率格点观测数据的青藏高原降水时空变化特征. 自然资源学报, 2015, 30(2): 271-281.]
|
| [33] |
[刘昌明, 田巍, 刘小莽, 等. 黄河近百年径流量变化分析与认识. 人民黄河, 2019, 41(10): 11-15.]
|
| [34] |
|
| [35] |
[袁文德, 郑江坤, 董奎. 1962—2012年西南地区极端降水事件的时空变化特征. 资源科学, 2014, 36(4): 766-772.]
|
| [36] |
[翟盘茂, 潘晓华. 中国北方近50年温度和降水极端事件变化. 地理学报, 2003, 58(Suppl.): 1-10.]
|
| [37] |
|
| [38] |
|
| [39] |
|
| [40] |
[乔富伟, 白永平, 周亮, 等. 雅鲁藏布江中游地区城乡居民点多尺度空间分异及自然因素影响分析. 地球信息科学学报, 2019, 21(9): 1341-1351.]
|
| [41] |
|
/
| 〈 |
|
〉 |