
中国城乡家庭能源平等变化特征分析
|
王强(1982-), 男, 河北成安人, 博士, 教授, 博士生导师, 研究方向为经济地理与区域可持续发展。E-mail: wangq@fjnu.edu.cn |
收稿日期: 2021-02-22
要求修回日期: 2021-11-17
网络出版日期: 2022-04-19
基金资助
国家自然科学基金项目(41971159)
国家自然科学基金项目(41971164)
第二次青藏高原综合科学考察研究(2019QZKK0406)
中国科学院战略性先导科技专项(XDA23020101)
版权
Changes in energy equality between urban and rural households in China
Received date: 2021-02-22
Request revised date: 2021-11-17
Online published: 2022-04-19
Supported by
National Natural Science Foundation of China(41971159)
National Natural Science Foundation of China(41971164)
Second Tibetan Plateau Scientific Expedition and Research Program(2019QZKK0406)
Strategic Priority Research Program of the Chinese Academy of Sciences](XDA23020101)
Copyright
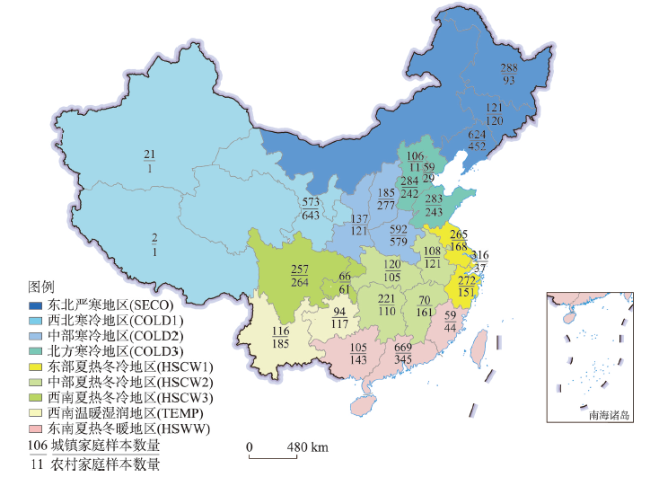
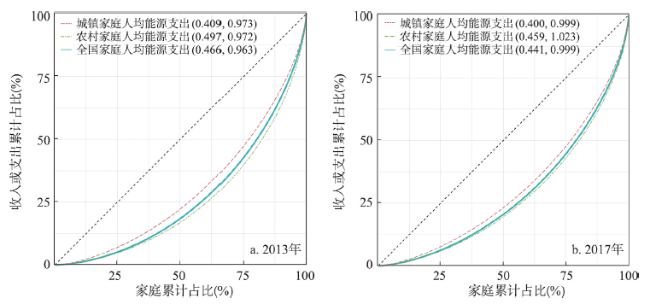
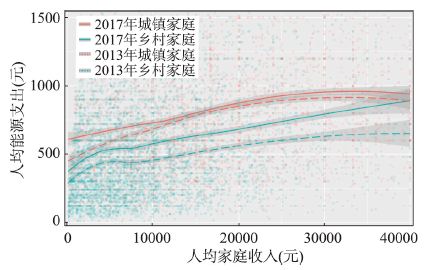
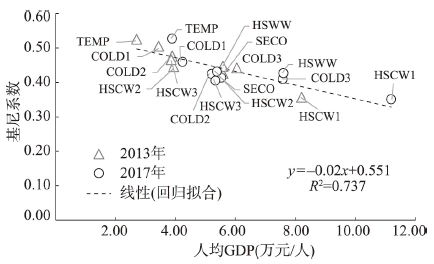
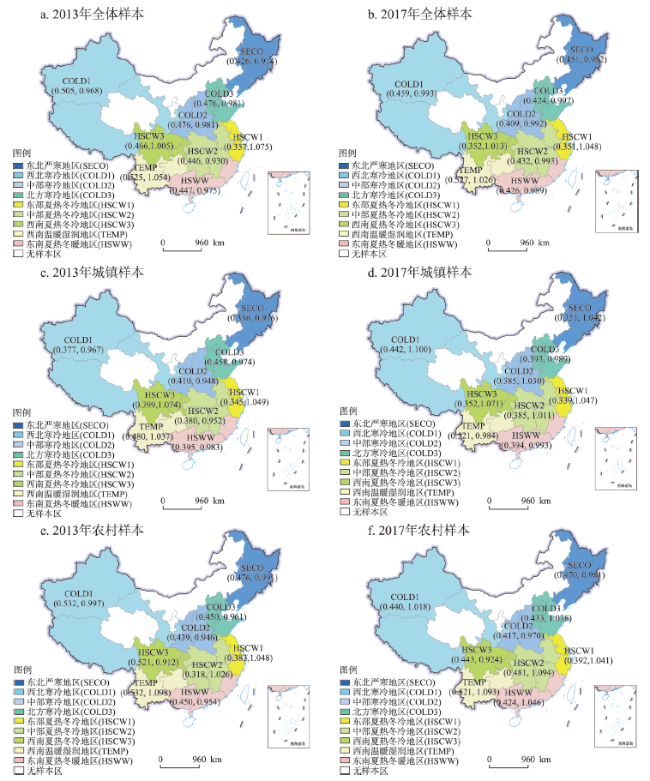
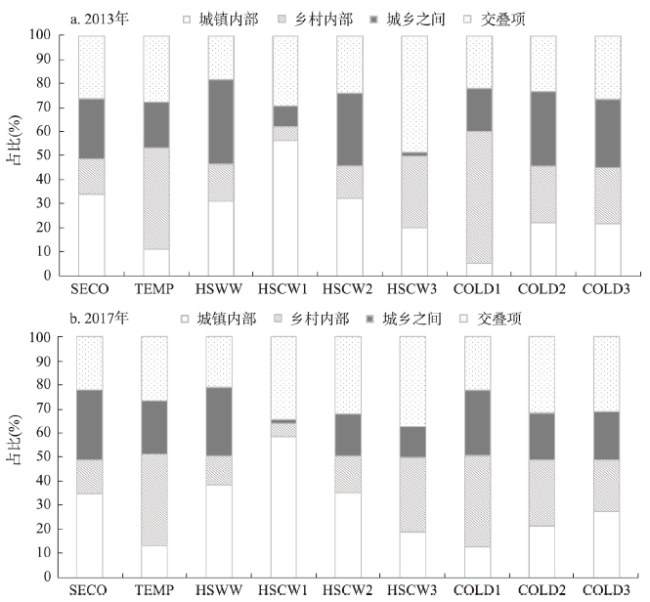
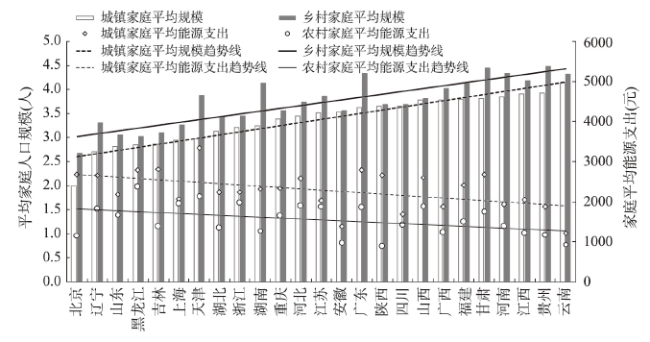
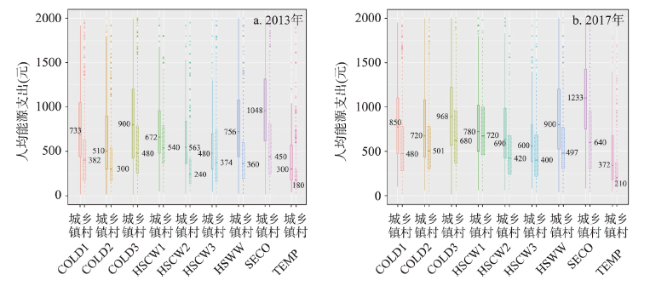
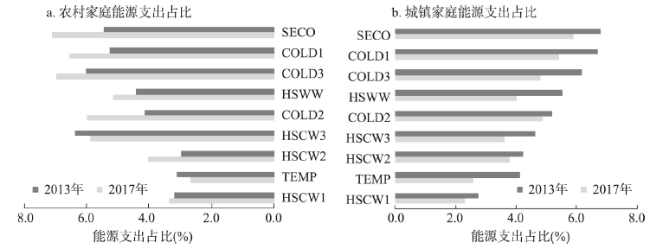
能源转型是中国如期实现碳中和、碳达峰目标的必然路径,也是缩小城乡居民能源消费差距、实现能源平等的关键举措。基于2013年和2017年的家庭追踪调查数据,运用基尼系数、局部加权回归以及逐步回归等方法,在揭示中国城乡家庭能源平等的时空特征、能源转型效果基础上,定量评价影响地区间、城乡间家庭能源平等的驱动因素。结果表明:① 中国城乡家庭的能源消费水平总体呈明显不平等特征,但随着能源转型政策实施以及城乡融合进程加速,城乡家庭间能源不平等程度有所减小。② 对10609个城乡家庭样本、9类分区的比较显示,除长三角地区的家庭能源平等性较高外,其他地区均呈不同程度的非均衡性,尤其在云贵等西南地区的家庭能源不平等现象尤为突出。③ 家庭收入、家庭规模、城乡居住区位、气候条件以及现代化能源可获得性显著影响家庭能源支出,进而对区域间的家庭能源平等性造成影响,而当地的能源资源禀赋对家庭能源支出的影响并不显著。④ 尽管农村地区气态能源、电力资源普及有效推动了城乡家庭能源转型,但农村家庭需担负相较于城镇家庭居民更大的能源转型经济压力。

王强 , 周侃 , 林键 . 中国城乡家庭能源平等变化特征分析[J]. 地理学报, 2022 , 77(2) : 457 -473 . DOI: 10.11821/dlxb202202013
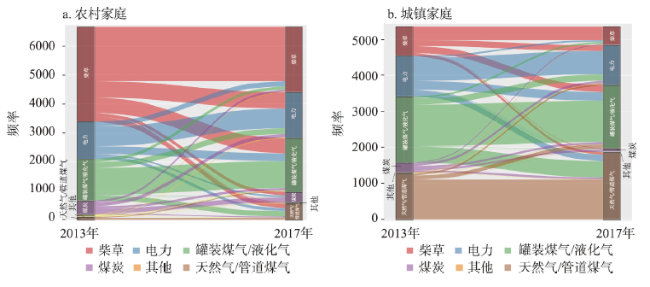
Energy transition is an effective path to peaking carbon dioxide emissions before 2030 and achieving carbon neutrality before 2060, which is an effective measure to bridge the gaps between urban and rural families' energy demand and realize energy equality. Based on the survey data from China Family Panel Studies provided by the Institute of Social Science Survey of Peking University, this paper takes the per capita residential energy cost as the key indicator, and applies three major tools to analyze the evolution of energy equality between urban and rural households during 2013-2017, including Gini coefficient and its decomposing technology, Lorenz curve and Lorenz asymmetry coefficient, Locally Estimated Scatterplot Smoothing, and Stepwise Regression. Then, the significance and economic burden of household energy transition was evaluated. The results show that: (1) On the whole, there are inequalities in household energy cost at present. However, with the implementation of national and local energy transition policies in recent years, the promotion of urban-rural integration, and the increase in the income of urban and rural households, the gap between urban and rural areas had been considerably narrowed during 2013-2017, thus its contribution rate to the national inequality dropped from 26.8% to 24.0%. (2) From the spatial perspective, energy inequality is most prominent in the temperate and humid region covering Yunnan and Guizhou, while the distribution of energy cost in the Yangtze River Delta, which is hot in summer and cold in winter, was relatively reasonable. Meanwhile, energy inequality has remained in the other regions to varying degrees. (3) Household income, household size, residential location, climatic conditions, and modern energy availability significantly affect household energy expenditures, which in turn affect energy equality within a region and between urban and rural areas. However, energy endowment does not have an obvious influence on the household energy expenditures. (4) In recent years, national energy transition had achieved remarkable results, and there had been a widespread coverage of advanced fuels. As the wide use of canned gas/liquefied gas, natural gas/pipeline gas, and electricity in rural areas, a rapid energy transition from primary to advanced fuels was accelerated. Meanwhile, compared with urban residents, rural households are often under greater economic pressure in the energy transition, that is to say, achieving energy transition in rural households will increase higher extra cost than that of urban households with the same per capita income. In addition, in the current process of energy transition, relatively low-income urban households and relatively high-income rural households are the main participants.
表1 变量定义及描述性统计Tab. 1 Definition and statistical summary of variables |
| 变量 | 含义 | 单位与赋值 | 均值 | 标准差 | |||
|---|---|---|---|---|---|---|---|
| 2013年 | 2017年 | 2013年 | 2017年 | ||||
| Per_cost | 家庭人均能源支出 | 元/人,2010年不变价 | 670.50 | 867.45 | 535.15 | 693.75 | |
| Per_inco | 家庭人均收入 | 元/人,2010年不变价 | 14666.39 | 20559.83 | 17901.02 | 29455.53 | |
| Fam_size | 家庭人口规模 | 人 | 3.77 | 3.73 | 1.79 | 1.86 | |
| Urb | 城镇家庭或农村家庭 | 农村家庭,Urb=1 城镇家庭,Urb=2 | 1.49 | 1.51 | 0.50 | 0.50 | |
| Wea | 气候条件 | 严寒地区,Wea=1 寒冷地区,Wea=2 夏热冬冷地区,Wea=3 夏热冬暖地区,Wea=4 温暖湿润地区,Wea=5 | 2.50 | 2.53 | 1.06 | 1.07 | |
| Per_ener | 所在地区能源资源禀赋 | 吨标准煤/人 | 5.42 | 3.39 | 4.92 | 2.94 | |
| Gas_acce | 城乡天然气普及率 | % | 54.26 | 59.51 | 40.77 | 39.84 | |
表2 城乡家庭人均能源支出基尼系数分解Tab. 2 Decomposition of energy cost-based Gini coefficient by urban-rural households |
| 比较项 | 2013年 | 2017年 | |||
|---|---|---|---|---|---|
| 基尼系数 | 贡献率(%) | 基尼系数 | 贡献率(%) | ||
| 城镇内部 | 0.122 | 26.2 | 0.125 | 28.3 | |
| 农村内部 | 0.096 | 20.6 | 0.087 | 19.7 | |
| 城乡之间 | 0.125 | 26.8 | 0.106 | 24.0 | |
| 交叠项 | 0.123 | 26.4 | 0.123 | 27.9 | |
| 总体样本 | 0.466 | 100.0 | 0.441 | 100.0 | |
表3 逐步回归估计结果Tab. 3 Stepwise regression estimates |
| 变量 | 2013年 | 2017年 | ||||||
|---|---|---|---|---|---|---|---|---|
| 未标准化 系数(B) | 标准化 系数(Beta) | t统计量 | VIF | 未标准化 系数(B) | 标准化 系数(Beta) | t统计量 | VIF | |
| 常量 | 5.161*** | - | 57.438 | - | 5.310 | - | 59.152 | - |
| Per_inco | 0.195*** | 0.243*** | 28.444 | 1.124 | 0.178*** | 0.256*** | 28.143 | 1.193 |
| Fam_size | -0.102*** | -0.214*** | -25.466 | 1.091 | -0.099*** | -0.235*** | -27.323 | 1.069 |
| Urb | 0.217*** | 0.127*** | 9.079 | 3.014 | 0.112*** | 0.072*** | 5.069 | 2.887 |
| Wea | -0.116*** | -0.144*** | -17.492 | 1.052 | -0.139*** | -0.190*** | -22.542 | 1.022 |
| Gas_acce | 0.076** | 0.130** | 9.170 | 3.111 | 0.088** | 0.139** | 9.829 | 2.869 |
| Per_ener | -0.024 | -0.015 | -1.120 | 2.739 | -0.018 | -0.003 | -8.954 | 4.156 |
| 模型诊断 | 调整后R2 | F检验 | Jarque-Bera检验 | 调整后R2 | F检验 | Jarque-Bera检验 | ||
| 0.517 | 824.196*** | 25.512*** | 0.527 | 801.643*** | 31.754*** | |||
注:***为通过1%显著性检验,**为通过5%显著性检验。 |
表4 城乡家庭能源选择比例(%)Tab. 4 Fuel choices in China by urban and rural households (%) |
| 年份 | 样本 | 传统固态燃料 | 现代清洁能源 | 其他 | ||||
|---|---|---|---|---|---|---|---|---|
| 柴草 | 煤炭 | 灌装煤气/液化气 | 太阳能/沼气 | 天然气/管道煤气 | 电力 | |||
| 2013 | 全样本 | 34.1 | 6.2 | 27.3 | 0.8 | 11.3 | 20.1 | 0.2 |
| 城镇样本 | 15.3 | 5.0 | 34.2 | 0.5 | 23.5 | 21.0 | 0.5 | |
| 农村样本 | 49.1 | 7.1 | 21.6 | 1.1 | 1.4 | 19.3 | 0.4 | |
| 2017 | 全样本 | 23.1 | 3.7 | 30.1 | 0.3 | 20.0 | 22.5 | 0.3 |
| 城镇样本 | 9.6 | 1.7 | 32.6 | 0.1 | 34.6 | 20.8 | 0.7 | |
| 农村样本 | 33.8 | 5.3 | 28.0 | 0.4 | 8.2 | 23.8 | 0.5 | |
图12 2013—2017年间农村与城镇家庭能源转型示意图Fig. 12 Transition of household cooking fuels in rural and urban areas during 2013-2017 |
表5 2013—2017年不同地区城乡家庭清洁能源普及率变化情况Tab. 5 Changes in the penetration rate of clean energy in urban and rural households during 2013-2017 |
| 地区(代码) | 普及率(%) | 变化幅度(%) | ||
|---|---|---|---|---|
| 2013年 | 2017年 | |||
| 西北寒冷地区(COLD1) | 26.6 | 43.4 | 16.8 | |
| 中部寒冷地区(COLD2) | 61.7 | 76.2 | 14.5 | |
| 北方寒冷地区(COLD3) | 65.8 | 79.3 | 13.5 | |
| 东部夏热冬冷地区(HSCW1) | 86.5 | 93.8 | 7.3 | |
| 中部夏热冬冷地区(HSCW2) | 54.7 | 72.5 | 17.8 | |
| 西南夏热冬冷地区(HSCW3) | 48.1 | 62.9 | 14.8 | |
| 东部夏热冬暖地区(HSWW) | 67.7 | 83.4 | 15.7 | |
| 东北严寒地区(SECO) | 59.9 | 70.2 | 10.4 | |
| 西南温暖湿润地区(TEMP) | 58.8 | 68.4 | 9.6 | |
| [1] |
[ 曹智, 李裕瑞, 陈玉福. 城乡融合背景下乡村转型与可持续发展路径探析. 地理学报, 2019, 74(12): 2560-2571.]
|
| [2] |
[ 刘彦随. 中国乡村振兴规划的基础理论与方法论. 地理学报, 2020, 75(6): 1120-1133.]
|
| [3] |
|
| [4] |
|
| [5] |
[ 夏征农, 陈至立. 大辞海能源科学卷. 上海: 上海辞书出版社, 2013.]
|
| [6] |
[ 刘彦随, 严镔, 王艳飞. 新时期中国城乡发展的主要问题与转型对策. 经济地理, 2016, 36(7): 1-8.]
|
| [7] |
[ 刘彦随. 中国新时代城乡融合与乡村振兴. 地理学报, 2018, 73(4): 637-650.]
|
| [8] |
|
| [9] |
|
| [10] |
|
| [11] |
|
| [12] |
|
| [13] |
|
| [14] |
International Energy Agency. World Energy Outlook 2018, Executive Summary. https://webstore.iea.org/download/summary/190?fileName¼English-WEO-2018-ES.pdf.
|
| [15] |
|
| [16] |
|
| [17] |
U.S. Energy Information Administration. Residential Energy Consumption Survey (RECS). https://www.eia.gov/consumption/residential/.
|
| [18] |
|
| [19] |
|
| [20] |
|
| [21] |
|
| [22] |
|
| [23] |
|
| [24] |
|
| [25] |
|
| [26] |
|
| [27] |
|
| [28] |
|
| [29] |
|
| [30] |
|
| [31] |
|
| [32] |
United Kingdom Department for Environment, Food & Rural Affairs. The UK Fuel Poverty Strategy (2001). https://storiesofchange.ac.uk/system/files/upload_136.
|
| [33] |
|
| [34] |
|
| [35] |
|
| [36] |
|
| [37] |
|
| [38] |
|
| [39] |
|
| [40] |
|
| [41] |
|
| [42] |
Ministry of Housing and Urban-Rural Development of the People's Republic of China. Uniform Standard for Design of Civil Building. 2019.
[中华人民共和国住房和城乡建设部. 民用建筑设计统一标准(GB50352-2019). 2019.]
|
| [43] |
|
| [44] |
|
| [45] |
[ 程永宏. 二元经济中城乡混合基尼系数的计算与分解. 经济研究, 2006, 41(1): 109-120.]
|
| [46] |
[ 程永宏. 基尼系数组群分解新方法研究: 从城乡二亚组到多亚组. 经济研究, 2008, 43(8): 124-135, 144.]
|
| [47] |
|
| [48] |
|
| [49] |
Loess Regression and Smoothing with R. Available at: http://r-statistics.co/Loess-Regression-With-R.html.
|
| [50] |
[ 杜晖, 蔡占文, 殷启元, 等. 基于全球天气预报系统对河套周边地区低云量精细化预报. 兰州大学学报(自然科学版), 2021, 57(2): 176-184.]
|
| [51] |
|
| [52] |
|
/
| 〈 |
|
〉 |