
1995—2015年中国人口迁移的时空变化特征
|
柯文前(1988-), 男, 福建晋江人, 博士, 副研究员, 主要从事人口迁移流动与城市网络、空间结构与区域发展研究。E-mail: wqke2005@163.com |
收稿日期: 2021-02-04
要求修回日期: 2021-10-29
网络出版日期: 2022-04-19
基金资助
国家社会科学基金重大项目(18ZDA132)
国家自然科学基金项目(41971180)
国家自然科学基金项目(41971168)
福建省科技厅省属公益类科研专项(2019R1002-1)
福建省社会科学规划项目(FJ2018C060)
版权
Spatio-temporal evolution of migration in China from 1995 to 2015
Received date: 2021-02-04
Request revised date: 2021-10-29
Online published: 2022-04-19
Supported by
National Social Science Foundation of China(18ZDA132)
National Natural Science Foundation of China(41971180)
National Natural Science Foundation of China(41971168)
Public-Funded Key Project of Department of Science and Technology, Fujian(2019R1002-1)
Social Science Planning Project, Fujian(FJ2018C060)
Copyright
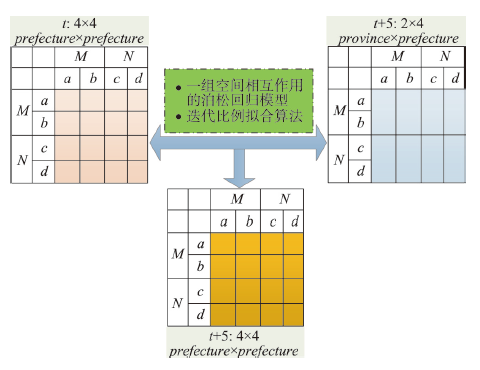
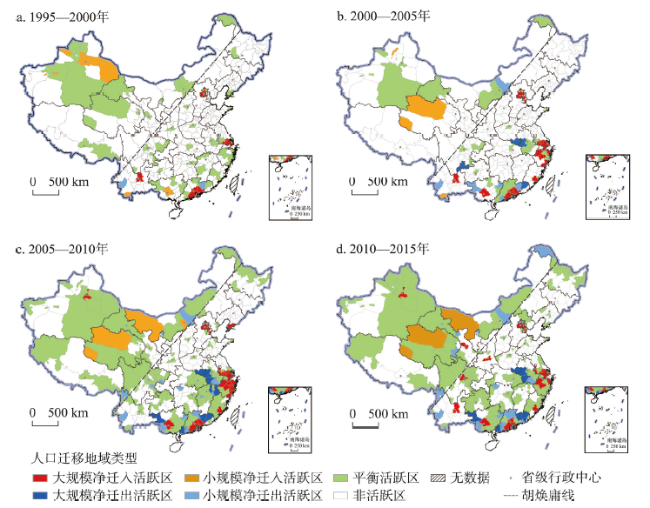
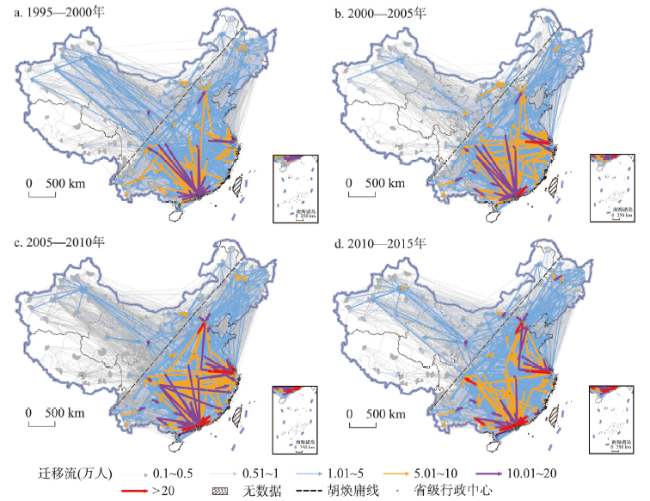
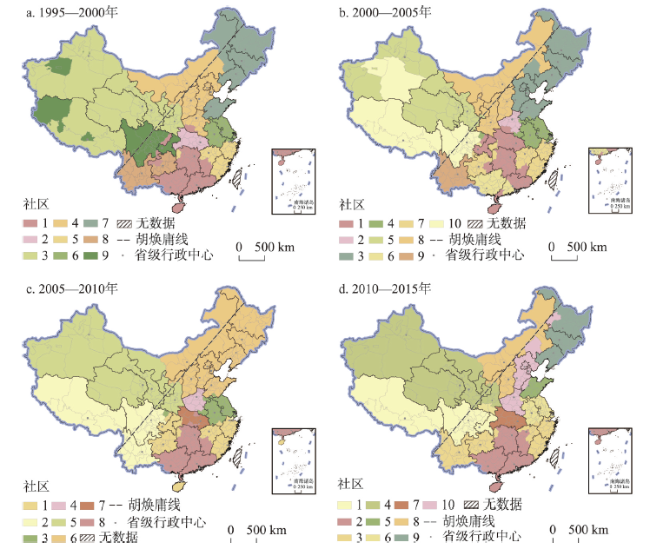
本文利用人口普查数据,估算了1995—2015年中国地(市)间人口O-D迁移流和迁移率,结合GIS空间分析和社会网络分析方法,揭示了20年间中国人口迁移的时空变化特征。研究发现:① 中国人口迁移由相对不活跃、局部地区参与的“低活性时代”,逐步走向相对活跃、绝大多数地区参与的“高活性时代”。② 人口迁移地域类型的时空演化过程呈现出各活跃型地(市)不断扩散,而非活跃型地(市)大幅缩减的特点。③ 人口迁移网络以“胡焕庸线”为界,东、西两侧迁移流“东密西疏”且差异悬殊,这一空间格局具有很强的稳定性和顽健性。④ 在人口省内迁移持续增强,以及跨省迁移中沿海三大城市群吸引力的“此消彼长”和西南地区吸引力不断增强的背景下,东中西部地区的人口迁移流场结构表现为:沿海地区主要城市群内部分化和影响范围减弱,中部地区(除湖北省)未能演化出以省为单元的独立社区,西部地区则是西北相对稳定而西南持续变动。

柯文前 , 朱宇 , 陈晨 , Guy J. Abel , 林李月 , 林洁 . 1995—2015年中国人口迁移的时空变化特征[J]. 地理学报, 2022 , 77(2) : 411 -425 . DOI: 10.11821/dlxb202202010
Based on the data of usual residence from 2000 and 2010 censuses and 1995 and 2015 micro-censuses and using the method proposed by Abel G. J., this paper estimates the O-D migration flows among prefectural-level administrative units in China for the period 1995-2015. By using the indicators of migration flows and migration rates, and the methods of GIS spatial analysis and community detection in social network analysis, it further reveals the characteristics of spatio-temporal evolution of migration in China since 1995. The results can be summarized as follows. (1) The scale and intensity of migration in China have been increasing, while their differences among regions have been gradually decreasing. This suggests that migration has experienced a gradual transformation from a "low-activity era" including a limited number of regions to a "high-activity era" involving the majority of regions. (2) Six regional types of migration among prefectural-level administrative units, namely, large-scale active net in-migration, small-scale net in-migration, large-scale active net out-migration, small-scale active net out-migration, active balanced migration and inactive migration, are identified. The spatio-temporal evolution characteristics of the regional types of migration in China indicate that each active migration regional type has been undergoing a change of continuous diffusion, while the inactive migration regional type has seen a significant reduction over time. (3) The spatial patterns of migration are quite different between regions on both sides of "Hu Line", manifested in the fact that the scale and intensity of migration flows on the southeastern side of the line is higher than that on the northwestern side, which means that the "Hu Line" is quite stable and robust in the last 20 years. (4) Patterns of migration flows indicate that while intra-provincial migration has continuously strengthened, inter-provincial migration has exhibited more complicated spatial patterns, mainly reflected in different changing trends of attractiveness to migrants among the three coastal city clusters, and the increasing migration flows within southwest China. As a result of combined effects of inter- and intra-provincial migration flows, the structure of migration flows in China's eastern, central and western regions has been undergoing changes, resulting in the internal differentiation of urban agglomerations and the declining spatial scope under their influence in the coastal areas, Hubei as the single independent "city community" in central China, as well as the relative stability in northwest China and continuous change in southwest China.
Key words: migration; regional type; community; spatio-temporal evolution; China
表1 人口迁移特征指标Tab. 1 Characteristic indexes of migration |
| 具体指标 | 计算公式 | 含义 | |
|---|---|---|---|
| 全 国 层 面 的 指 标 | 全国总迁移量 | (2) | 度量人口在全国的总迁移数量,数值越大表示人口迁移规模越大。 |
| 全国净迁移量 | (3) | 度量人口在全国的净迁移数量,数值越大表示净迁移规模越大。 | |
| 全国总迁移系数 | (4) | 度量人口在全国的总迁移特性,数值越大表示总迁移强度越高。 | |
| 全国净迁移系数 | (5) | 度量人口在全国的净迁移率,数值越大表示净迁移强度越高。 | |
| 地(市)层 面 的 指 标 | 地(市)总迁移量 | (6) | 度量人口在各城市的总迁移数量,数值越大表示总迁移规模越大。 |
| 地(市)净迁移量 | (7) | 度量人口在各城市的净迁移数量,数值越大表示净迁移规模越大。 | |
| 地(市)总迁移系数 | (8) | 表征迁移的活跃程度,值越高迁移越活跃,反之则不活跃。 | |
| 地(市)净迁移系数 | (9) | 表征迁移的源汇特征,正值为净迁入,负值为净迁出;正值越大,净迁入强度越高,反之则净迁出强度越高。 |
注:Oi和Ii分别为城市i的人口迁出和迁入规模; 和 分别为城市i在(t, t+5)时段内期初年(t)的年末总人口和期末年(t+5)的年末总人口。 |
表2 人口迁移的地域类型的划分方法Tab. 2 Classification method of regional types of migration |
| 地域类型 | 划分标准 |
|---|---|
| 非活跃型 | GRi < 1/10 |
| 平衡活跃型 | GRi ≥ 1/10,且-1/10 < NRi < 1/10 |
| 大规模净迁入活跃型 | GRi ≥ 1/10,且NRi ≥ 1/10,且Ii ≥ 50万 |
| 小规模净迁入活跃型 | GRi ≥ 1/10,且NRi ≥ 1/10,且Ii < 50万 |
| 大规模净迁出活跃型 | GRi ≥ 1/10,且NRi ≤ -1/10,且Oi ≥ 50万 |
| 小规模净迁出活跃型 | GRi ≥ 1/10,且NRi ≤ -1/10,且Oi < 50万 |
表3 1995—2015年中国地(市)间人口迁移总体特征相关指标的测度结果Tab. 3 Measurement results of migration indexes among prefecture-level administrative units from 1995 to 2015 |
| 指标/时段 | 1995—2000年 | 2000—2005年 | 2005—2010年 | 2010—2015年 |
|---|---|---|---|---|
| 全国层面的人口迁移指标 | ||||
| 全国总迁移量(万人) | 10387.8 | 11167.0 | 15240.4 | 15826.6 |
| 全国净迁移量(万人) | 5853.0 | 6879.8 | 9510.4 | 9136.0 |
| 全国总迁移系数(%) | 8.98 | 9.19 | 12.30 | 12.46 |
| 全国净迁移系数(%) | 5.06 | 5.66 | 7.68 | 7.19 |
| 地(市)层面人口迁移指标的变异系数 | ||||
| 地(市)总迁移量的变异系数 | 1.44 | 1.59 | 1.47 | 1.40 |
| 地(市)净迁移量的变异系数 | 2.19 | 2.15 | 2.02 | 1.95 |
| 地(市)总迁移系数的变异系数 | 3.48 | 1.81 | 1.15 | 0.92 |
| 地(市)净迁移系数的变异系数 | 5.44 | 2.74 | 1.82 | 1.46 |
表4 1995—2015年中国人口迁移地域类型的统计结果Tab. 4 Statistics of regional types of migration in China from 1995 to 2015 |
| 地域类型 | 净迁入活跃型合计 | 其中:大规模净迁入活跃型 | 其中:小规模净迁入活跃型 | 净迁出活跃型合计 | 其中:大规模净迁出活跃型 | 其中:小规模净迁出活跃型 | 平衡活跃型合计 | 非活跃型合计 | |
|---|---|---|---|---|---|---|---|---|---|
| 数量占比(%) | 1995—2000年 | 5.63 | 3.13 | 2.50 | 0.63 | 0.00 | 0.63 | 17.81 | 75.94 |
| 2000—2005年 | 7.50 | 6.25 | 1.25 | 3.44 | 1.25 | 2.19 | 11.56 | 77.50 | |
| 2005—2010年 | 8.44 | 7.50 | 0.94 | 8.44 | 2.50 | 5.94 | 35.00 | 48.13 | |
| 2010—2015年 | 7.51 | 6.88 | 0.63 | 8.06 | 2.50 | 6.56 | 38.13 | 45.31 | |
| 迁入人口占比(%) | 1995—2000年 | 41.77 | 38.24 | 3.53 | 0.14 | 0.00 | 0.14 | 24.41 | 33.67 |
| 2000—2005年 | 58.57 | 57.78 | 0.79 | 0.56 | 0.33 | 0.23 | 12.25 | 28.62 | |
| 2005—2010年 | 61.05 | 60.42 | 0.63 | 1.55 | 0.56 | 0.99 | 21.47 | 15.94 | |
| 2010—2015年 | 55.11 | 54.86 | 0.25 | 1.39 | 0.56 | 0.83 | 26.27 | 17.23 | |
| 迁出人口占比(%) | 1995—2000年 | 4.05 | 3.33 | 0.72 | 1.20 | 0.00 | 1.20 | 20.61 | 74.14 |
| 2000—2005年 | 7.23 | 7.08 | 0.15 | 8.89 | 4.87 | 4.02 | 14.15 | 69.74 | |
| 2005—2010年 | 7.10 | 6.92 | 0.18 | 14.19 | 8.10 | 6.09 | 32.97 | 45.74 | |
| 2010—2015年 | 7.68 | 7.57 | 0.11 | 14.99 | 8.25 | 6.74 | 32.77 | 44.56 | |
表5 3种迁移流类型在不同时段的人口迁移流比例(%)Tab. 5 The percentage of three migration flow types in different periods (%) |
| 时段 | 东侧 | 西侧 | 跨越东西两侧 | 全国 |
|---|---|---|---|---|
| 1995—2000年 | 91.30 | 3.44 | 5.26 | 100 |
| 2000—2005年 | 94.45 | 3.10 | 2.45 | 100 |
| 2005—2010年 | 92.39 | 3.19 | 4.43 | 100 |
| 2010—2015年 | 91.62 | 3.49 | 4.90 | 100 |
表6 不同时段跨越“胡焕庸线”东西两侧的人口迁移流比例(%)Tab. 6 The percentage of migration flow types on both sides of 'Hu Line' in different periods (%) |
| 时段 | 西北—东南 | 东南—西北 | 合计 |
|---|---|---|---|
| 1995—2000年 | 39.94 | 60.06 | 100 |
| 2000—2005年 | 49.32 | 50.68 | 100 |
| 2005—2010年 | 53.02 | 46.98 | 100 |
| 2010—2015年 | 59.29 | 40.71 | 100 |
| [1] |
[ 张善余. 我国省际人口迁移模式的重大变化. 人口研究, 1990, 14(1): 2-8.]
|
| [2] |
|
| [3] |
[ 王桂新. 中国经济体制改革以来省际人口迁移区域模式及其变化. 人口与经济, 2000(3): 8-16, 22.]
|
| [4] |
[ 劳昕, 沈体雁. 中国地级以上城市人口流动空间模式变化: 基于2000和2010年人口普查数据的分析. 中国人口科学, 2015(1): 15-28, 126.]
|
| [5] |
[ 林李月, 朱宇, 柯文前. 城镇化中后期中国人口迁移流动形式的转变及政策应对. 地理科学进展, 2020, 39(12): 2054-2067.]
|
| [6] |
[ 段成荣, 谢东虹, 吕利丹. 中国人口的迁移转变. 人口研究, 2019, 43(2): 12-20.]
|
| [7] |
[ 刘涛, 齐元静, 曹广忠. 中国流动人口空间格局演变机制及城镇化效应: 基于2000和2010年人口普查分县数据的分析. 地理学报, 2015, 70(4): 567-581.]
|
| [8] |
[ 丁金宏, 刘振宇, 程丹明, 等. 中国人口迁移的区域差异与流场特征. 地理学报, 2005, 60(1): 106-114.]
|
| [9] |
|
| [10] |
|
| [11] |
|
| [12] |
|
| [13] |
|
| [14] |
|
| [15] |
|
| [16] |
|
| [17] |
|
| [18] |
[ 杨菊华. 中国流动人口的社会融入研究. 中国社会科学, 2015, (2): 61-79, 203-204.]
|
| [19] |
[ 古恒宇, 孟鑫, 沈体雁, 等. 中国城市流动人口居留意愿影响因素的空间分异特征. 地理学报, 2020, 75(2): 240-254.]
|
| [20] |
|
| [21] |
|
| [22] |
|
| [23] |
[ 戚伟, 赵美风, 刘盛和. 1982—2010年中国县市尺度流动人口核算及地域类型演化. 地理学报, 2017, 72(12): 2131-2146.]
|
| [24] |
[ 刘盛和, 邓羽, 胡章. 中国流动人口地域类型的划分方法及空间分布特征. 地理学报, 2010, 65(10): 1187-1197.]
|
| [25] |
[ 陈伟, 刘卫东, 柯文前, 等. 基于公路客流的中国城市网络结构与空间组织模式. 地理学报, 2017, 72(2): 224-241.]
|
| [26] |
|
| [27] |
|
| [28] |
[ 戚伟, 刘盛和, 赵美风. “胡焕庸线”的稳定性及其两侧人口集疏模式差异. 地理学报, 2015, 70(4): 551-566.]
|
| [29] |
|
| [30] |
[ 刘达, 林赛南, 李志刚, 等. “人口回流”视角下的中部地区乡村振兴: 对湖北“毛嘴模式”的实证. 地理科学, 2020, 40(1): 112-118.]
|
| [31] |
[ 罗小龙, 曹姝君, 顾宗倪. 回流城镇化:中部地区城镇化开启新路径. 地理科学, 2020, 40(5): 685-690.]
|
| [32] |
[ 肖磊, 潘劼. 人口流出地区城镇化路径机制再认识: 以四川省县域单元为例. 地理科学进展, 2020, 39(3): 402-409.]
|
| [33] |
[ 蒋宇阳. 从“半工半耕”到“半工伴读”: 教育驱动下的县域城镇化新特征. 城市规划, 2020, 44(1): 35-43, 71.]
|
/
| 〈 |
|
〉 |