
多维邻近性、贸易壁垒与中国—世界市场的产业联系动态演化
|
贺灿飞(1972-), 男, 江西永新人, 教授, 博士生导师, 主要从事经济地理、产业与区域经济研究。E-mail: hecanfei@urban.pku.edu.cn |
收稿日期: 2020-12-15
要求修回日期: 2021-09-08
网络出版日期: 2022-04-19
基金资助
国家自然科学基金项目(41731278)
版权
Multi-dimensional proximity, trade barriers and the dynamic evolution of industrial linkages between China and the world market
Received date: 2020-12-15
Request revised date: 2021-09-08
Online published: 2022-04-19
Supported by
National Natural Science Foundation of China(41731278)
Copyright
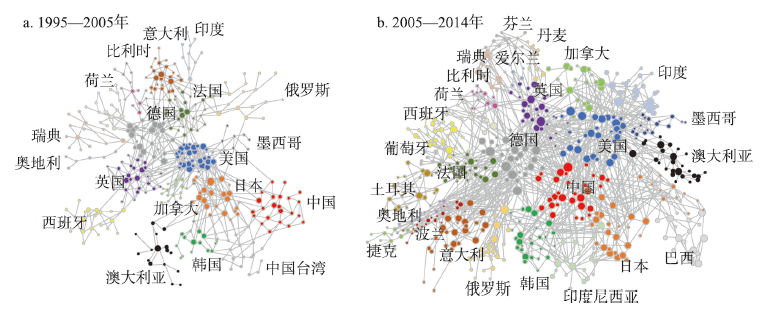
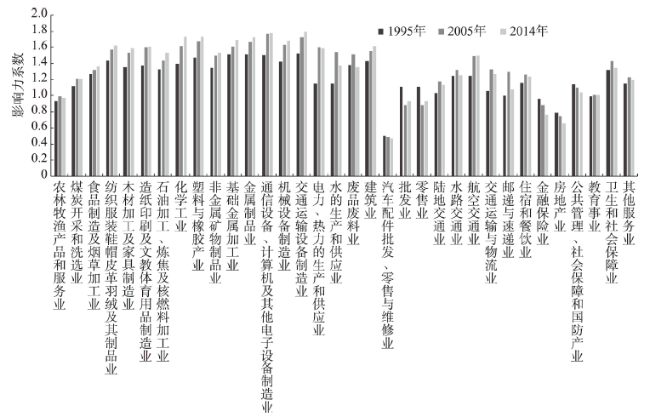
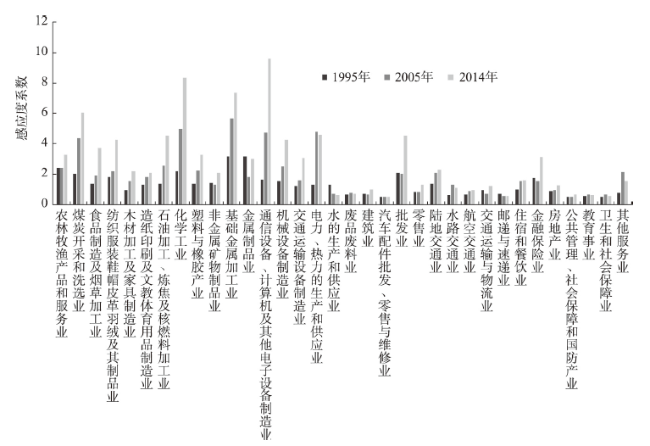
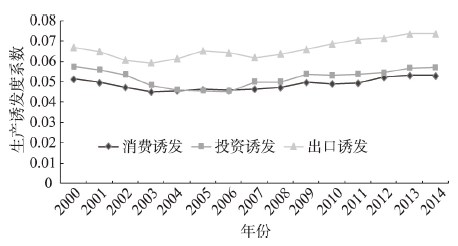
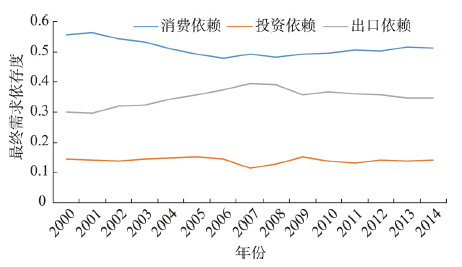
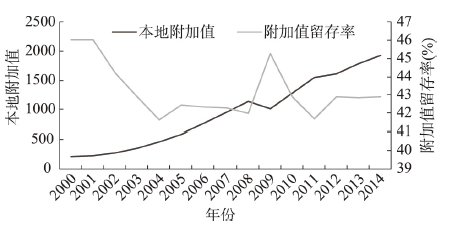
随着中国经济步入新常态,中国嵌入世界生产网络的既有模式遭遇内部红利消失与外部贸易摩擦的双重困境,探讨中国同世界其他国家/地区间的产业联系特征及其动态演化机制,对寻找中国产业对外联系的破局方向至关重要。基于1995—2014年世界投入产出表数据库,从国家尺度刻画世界产业相互依赖网络,并着重关注中国在这一格局中的角色与地位演变。研究发现:① 1995—2014年中国从世界生产联系网络的边缘国家演变成为沟通东亚、东南亚地区与其他新兴市场的桥梁,并从美欧主干联系的“局外人”升级成为链接欧美产业网络的重要枢纽。而2015—2019年中国对外产业联系拓展逐渐进入曲折发展的瓶颈期。② 从供给角度看,中国基础资源行业和制造业正不断嵌入世界生产网络的供给侧。相比之下,中国大部分服务业对世界产业网络的供给能力低于世界平均水平。③ 从需求看,中国作为“世界工厂”与基础设施建设大国,在制造业与基建方面具有世界性的影响力,然而中国的交通、物流、金融等生产型服务业的国际影响力在2005年后逐步下降。④ 中国产业获取本地附加值总体持续增长,但附加值捕获的效率较低。在此基础上,本文探讨了多维邻近性、贸易保护对中国—世界产业联系的作用,发现:中国对外产业联系的演化受地理、认知、社会与制度4个维度的邻近性影响并形成路径依赖。其中地理与认知邻近性的影响最为广泛,而社会与制度邻近性仅对产业联系形式更加复杂的中间生产联系与发展较为成熟的最终需求联系有促进作用,技术贸易壁垒与反倾销调查会削弱中国对外产业联系;卫生安全检疫措施对最终市场需求联系有显著削弱作用,而对中间产品生产联系的作用并不显著。综上所述,生产型服务业与总体附加值获取效率是中国对外产业联系拓展的潜力方向,而内销—出口平衡与多元化的产业发展策略是中国对外产业联系拓展的合理举措。
贺灿飞 , 余昌达 . 多维邻近性、贸易壁垒与中国—世界市场的产业联系动态演化[J]. 地理学报, 2022 , 77(2) : 275 -294 . DOI: 10.11821/dlxb202202002
As China enters the new normal era, the existing mode of joining into the global production network is confronted with the dual dilemma of internal dividend disappearance and external trade frictions. It is very important to explore the characteristics and driving forces of dynamic evolution of industrial linkages between China and other countries or regions in the world. Based on the world input-output table database from 1995 to 2014, this study depicts the global industrial interdependence network from the national scale using input—output analysis and social network analysis, and focuses on the evolution of China's role and position in this pattern using spatial econometric model. The main findings are as follows: China has become a bridge between East Asia and Southeast Asia and other emerging markets, thus upgrading from an "outsider" to an important hub in the industrial network linking Europe and the United States. However, from 2015 to 2019, the expansion of China's foreign industrial linkages has gradually reached a plateau. From the perspective of supply side, China's resource and manufacturing industries are constantly embedded in the supply side of the global production network. However, the overall external supply capacity of most China's service industry is relatively below global average. In terms of demand, China, as the "factory of the world" and a major country in infrastructure construction, has an increasing global influence in manufacturing and infrastructure. Nevertheless, the international influence of productive services like Transportation, Logistics and Finance has been declining since 2005. The Chinese industries obtain the local added value overall to continue to grow, but the efficiency of the added value capture is low. On this basis, this study explores the influence of multi-dimensional proximities and trade protectionism on China-global industrial linkages and their value added. Among them, the geographical and cognitive proximity has the most extensive influence, while the social and institutional proximities only promote and strengthen the intermediate production linkage with more complex forms of industrial linkages and final demand linkages. However, technical barriers and anti-dumping investigation have weakened China's foreign industrial links. The sanitary and phytosanitary measures have a significant weakening effect on the final demand linkage, but not on the intermediate product production. To sum up, the upgrading of production-oriented service industry and the efficiency of the acquisition of overall added value are the potential directions for the expansion of China's foreign industrial linkages, while the construction of domestic industrial cycle and industrial diversification are the reasonable measures for the expansion of China's foreign industrial linkages.
Key words: multidimensional proximity; trade barriers; value added; industrial linkages; China
表1 中国—世界产业联系指标体系Tab. 1 Indexes used to picture industrial linkages between China and the world market |
| 测度对象 | 测度方法 | 理论意义 |
|---|---|---|
| 产业联系(产业间的直接联系) | 前向关联度 | A国/地区产业产品投入对B国/地区产业生产的比率 |
| 后向关联度 | A国/地区产业对B国/地区产业中间产品的需求率 | |
| 总体关联度 | 结合前后向关联的两产业间直接关联 | |
| 产业波及(产业对某国/地区产业体系的综合影响,包括直接与间接影响) | 感应度系数 | A国/地区产业生产对世界产业体系生产的拉动作用(包括间接拉动) |
| 影响力系数 | 世界产业体系生产对A国/地区产业生产的拉动作用(包括间接拉动) | |
| 生产诱发系数 | 世界市场最终需求变化对A国/地区产业生产的拉动作用 | |
| 最终依存度系数 | A国/地区产业对全球最终需求变化的敏感度 | |
| 产业联系附加值 | 最终产品国内附加值 | 生产最终品保留在A国/地区的增加值部分 |
表2 模型变量设定Tab. 2 Independent variables |
| 变量 | 测度指标 | 测度方法与数据解释 | 数据来源 |
|---|---|---|---|
| 因变量:产业联系方向与强度 | 产业关联度Totalict | 中国产业整体与i国/地区c产业的关联指数(可分解为中间产品联系与最终市场需求联系) | WIOD数据库 |
| 核心自变量:国家/地区间多维邻近性 | 地理邻近性Geodistit | i国/地区与中国间的地理距离的倒数 | CEPII—地理邻近性 |
| 制度邻近性Insdistit\ | i国/地区与中国的“社会法治指数”之差的倒数 | 世界银行 | |
| 社会邻近性 | i国/地区与中国是否使用同一种官方语言(是取1,不是取0) | CEPII—地理邻近性 | |
| 认知邻近性 | i国/地区与中国在同年同一产业上具有比较优势的概率(在产品层面计算,通过HS-ISIC转换标准归总至产业。显性比较优势指数>1即认为有比较优势) | 中国海关贸易数据库UNcomtrade数据库 | |
| 核心自变量:贸易壁垒(NTMSit) | 卫生安全检疫SPSit | i国/地区对中国发起的卫生安全检疫通报数占本国/地区同类壁垒比例 | 世界贸易组织 |
| 技术贸易壁垒TBTit | i国/地区对中国发起的技术贸易壁垒通报数占本国/地区同类壁垒比例 | 世界贸易组织 | |
| 反倾销调查ADPit | i国/地区对中国发起的反倾销调查通报数占本国/地区同类壁垒比例 | 世界贸易组织 | |
| 控制变量(Controlit):目的国/地区社会经济属性 | 人均GDP PGDPit | i国/地区人均GDP | 世界银行 |
| 政府补贴Subsidyit | i国/地区政府产业补贴与基础设施头入占GDP比重 | 世界银行 | |
| 市场开放度Opennessit | i国/地区外来直接投资与GDP之比 | 世界银行 | |
| 上游垄断度Upstreamict | i国/地区c产业接受不同产业投入的赫芬达尔指数 | WIOD数据库 | |
| 服务化比重Servitizationic | i国/地区c产业接受服务业投入占总接受投入的比重 | WIOD数据库 |
表3 主要变量相关系数Tab. 3 Correlation matrix of independent variables |
| Geo | Ins | Soc | Cog | SPS | TBT | ADP | PGDP | SUB | UPS | SERV | OPEN | |
|---|---|---|---|---|---|---|---|---|---|---|---|---|
| Geo | 1.00 | |||||||||||
| Ins | 0.14 | 1.00 | ||||||||||
| Soc | 0.22 | 0.24 | 1.00 | |||||||||
| Cog | 0.17 | 0.08 | 0.06 | 1.00 | ||||||||
| SPS | -0.02 | -0.05 | -0.25 | -0.18 | 1.00 | |||||||
| TBT | -0.03 | -0.04 | -0.06 | -0.12 | 0.22 | 1.00 | ||||||
| ADP | -0.05 | -0.06 | -0.09 | -0.09 | 0.14 | 0.55 | 1.00 | |||||
| PGDP | 0.14 | 0.24 | 0.25 | 0.11 | 0.23 | 0.19 | 0.12 | 1.00 | ||||
| SUB | 0.21 | 0.16 | 0.26 | 0.15 | 0.12 | 0.11 | 0.25 | 0.29 | 1.00 | |||
| UPS | -0.05 | 0.23 | 0.11 | 0.24 | -0.05 | 0.04 | 0.15 | 0.13 | 0.11 | 1.00 | ||
| SERV | -0.31 | -0.17 | 0.15 | -0.07 | 0.21 | 0.13 | -0.20 | 0.22 | 0.25 | -0.1 | 1.00 | |
| OPEN | 0.26 | 0.12 | 0.31 | 0.13 | 0.18 | 0.21 | 0.12 | 0.23 | 0.23 | 0.16 | 0.13 | 1.00 |
表4 中国—世界总体产业联系的演变机制Tab. 4 Evolution mechanism of China-world overall industrial relations |
| 变量 | 模型1 | 模型2 | 模型3 | 模型4 | 模型5 | 模型6 |
|---|---|---|---|---|---|---|
| 1995—2005年 | 2005—2014年 | 1995—2005年 | 2005—2014年 | 1995—2005年 | 2005—2014年 | |
| 地理邻近性 | 0.363*** | 0.227** | 0.352*** | 0.218*** | 0.347** | 0.263*** |
| 制度邻近性 | 0.224 | 0.281** | 0.218 | 0.283** | 0.207 | 0.224* |
| 社会邻近性 | 0.102 | 0.142** | 0.103 | 0.126* | 0.112 | 0.178** |
| 认知邻近性 | 0.176** | 0.192** | 0.162* | 0.184** | 0.127** | 0.189* |
| 人均GDP | 0.352** | 0.316** | 0.343** | 0.315* | 0.305* | 0.316* |
| 政府补贴 | 0.216* | 0.078 | 0.211 | 0.062 | 0.221* | 0.066 |
| 市场开放度 | 0.247* | 0.213* | 0.255* | 0.222** | 0.258** | 0.240* |
| 上游垄断度 | -0.014* | -0.151* | -0.026* | -0.115 | -0.013* | -0.146* |
| 服务化 | 0.114* | 0.091* | 0.108** | 0.089* | 0.112* | 0.101* |
| 卫生检疫 | -0.015 | -0.125 | ||||
| 技术壁垒 | -0.027** | -0.062** | ||||
| 反倾销 | -0.024** | -0.018** | ||||
| 年份 | YES | YES | YES | YES | YES | YES |
| 行业 | YES | YES | YES | YES | YES | YES |
| 目的国 | YES | YES | YES | YES | YES | YES |
| 常数项 | -3.014*** | -3.215*** | -3.391*** | -3.762*** | -3.115*** | -3.387*** |
| 样本数 | 15967 | 14432 | 15967 | 14432 | 15967 | 14432 |
注:***:p < 0.01,**:p < 0.05,*:p < 0.1。 |
表5 中国—世界中间生产产业联系的演变机制Tab. 5 Evolution mechanism of China-world industrial relations of intermediate production |
| 变量 | 模型1 | 模型2 | 模型3 | 模型4 | 模型5 | 模型6 |
|---|---|---|---|---|---|---|
| 1995—2005年 | 2005—2014年 | 1995—2005年 | 2005—2014年 | 1995—2005年 | 2005—2014年 | |
| 地理邻近性 | 0.275*** | 0.231*** | 0.284*** | 0.225*** | 0.292*** | 0.247*** |
| 制度邻近性 | 0.217* | 0.224** | 0.205* | 0.236** | 0.221* | 0.239** |
| 社会邻近性 | 0.134* | 0.126* | 0.132* | 0.141* | 0.156* | 0.135* |
| 认知邻近性 | 0.232** | 0.248** | 0.229** | 0.253** | 0.225** | 0.261** |
| 人均GDP | 0.214** | 0.205* | 0.208** | 0.197* | 0.216* | 0.194* |
| 政府补贴 | 0.192* | 0.157* | 0.188* | 0.162** | 0.184** | 0.173 |
| 市场开放度 | 0.236* | 0.247* | 0.228* | 0.253* | 0.237** | 0.268* |
| 上游垄断度 | -0.113* | -0.106 | -0.103* | -0.112 | -0.107* | -0.098* |
| 服务化 | 0.121* | 0.079* | 0.115* | 0.083* | 0.126* | 0.094* |
| 卫生检疫 | -0.024 | -0.107 | ||||
| 技术壁垒 | -0.063** | -0.081** | ||||
| 反倾销 | -0.014** | -0.023** | ||||
| 年份 | YES | YES | YES | YES | YES | YES |
| 行业 | YES | YES | YES | YES | YES | YES |
| 目的国 | YES | YES | YES | YES | YES | YES |
| 常数项 | -2.796*** | -2.826*** | -2.742*** | -2.894*** | -2.682*** | -2.837*** |
| 样本数 | 13912 | 12582 | 13912 | 12582 | 13912 | 12582 |
注:***:p < 0.01,**:p < 0.05,*:p < 0.1。 |
表6 中国—世界最终市场需求联系的演变机制Tab. 6 Evolution mechanism of China-world industrial relations of final demand |
| 变量 | 模型1 | 模型2 | 模型3 | 模型4 | 模型5 | 模型6 |
|---|---|---|---|---|---|---|
| 1995—2005年 | 2005—2014年 | 1995—2005年 | 2005—2014年 | 1995—2005年 | 2005—2014年 | |
| 地理邻近性 | 0.312*** | 0.283*** | 0.308*** | 0.276*** | 0.297*** | 0.264*** |
| 制度邻近性 | 0.214 | 0.209* | 0.224 | 0.213* | 0.236 | 0.221* |
| 社会邻近性 | 0.116 | 0.137* | 0.129 | 0.142* | 0.127 | 0.152* |
| 认知邻近性 | 0.236** | 0.216** | 0.227** | 0.205** | 0.248** | 0.209** |
| 人均GDP | 0.363* | 0.375* | 0.397** | 0.369* | 0.403* | 0.381* |
| 政府补贴 | 0.129* | 0.116* | 0.125 | 0.119* | 0.132* | 0.128* |
| 政府补贴 | 0.149* | 0.133* | 0.138* | 0.123* | 0.124* | 0.109* |
| 市场开放度 | -0.048* | -0.013* | -0.059* | -0.024 | -0.067* | -0.018 |
| 上游垄断度 | 0.105* | 0.083* | 0.102** | 0.091* | 0.107* | 0.113* |
| 反倾销 | -0.037** | -0.056* | ||||
| 技术壁垒 | -0.023** | -0.031** | ||||
| 卫生检疫 | -0.017** | -0.029** | ||||
| 行业 | YES | YES | YES | YES | YES | YES |
| 年份 | YES | YES | YES | YES | YES | YES |
| 目的国 | YES | YES | YES | YES | YES | YES |
| 常数项 | -2.738*** | -2.923*** | -2.719*** | -2.902*** | -2.685*** | -2.893*** |
| 样本数 | 2055 | 1850 | 2055 | 1850 | 2055 | 1850 |
注:***:p < 0.01,**:p < 0.05,*:p < 0.1。 |
| [1] |
[ 亚当·斯密. 国民财富的性质和原因的研究: 上卷. 郭大力, 王亚南, 译. 北京: 商务印书馆, 2011.]
|
| [2] |
|
| [3] |
|
| [4] |
|
| [5] |
|
| [6] |
[ 马歇尔. 经济学原理: 上卷. 陈良璧, 译. 北京: 商务印书馆, 2011.]
|
| [7] |
|
| [8] |
|
| [9] |
|
| [10] |
[ 贺灿飞, 金璐璐, 刘颖. 多维邻近性对中国出口产品空间演化的影响. 地理研究, 2017, 36(9): 1613-1626.]
|
| [11] |
|
| [12] |
|
| [13] |
[ 胡杨, 李郇. 多维邻近性对产学研合作创新的影响: 广州市高新技术企业的案例分析. 地理研究, 2017, 36(4): 695-706.]
|
| [14] |
|
| [15] |
|
| [16] |
|
| [17] |
|
| [18] |
|
| [19] |
|
| [20] |
|
| [21] |
[ 刘红光, 张婕, 朱忠翔, 等. 金融危机前后全球产业贸易转移定量测度分析. 经济地理, 2019, 39(1): 96-103.]
|
| [22] |
|
| [23] |
[ 陈万灵, 杨永聪. 全球进口需求结构变化与中国产业结构的调整. 国际经贸探索, 2014, 30(9): 13-23.]
|
| [24] |
[ 耿鹏, 赵昕东. 基于GVAR模型的产业内生联系与外生冲击分析. 数量经济技术经济研究, 2009, 26(12): 32-45.]
|
| [25] |
[ 康晓玲, 宁艳丽. 外国对华实施技术性贸易壁垒问题的博弈分析. 经济体制改革, 2005(2): 145-148.]
|
| [26] |
|
| [27] |
[ 王岳平, 葛岳静. 我国产业结构的投入产出关联特征分析. 管理世界, 2007(2): 61-68.]
|
| [28] |
|
| [29] |
[ 路乾乾. 基于区域产业关联的京津冀区域产业结构优化升级[D]. 北京: 首都经济贸易大学, 2017.]
|
| [30] |
|
| [31] |
|
| [32] |
|
| [33] |
|
| [34] |
|
| [35] |
[ 吕云龙, 吕越. 上游垄断与制造业出口的比较优势: 基于全球价值链视角的经验证据. 财贸经济, 2017, 38(8): 98-111.]
|
| [36] |
|
| [37] |
|
| [38] |
|
| [39] |
|
| [40] |
|
| [41] |
|
| [42] |
|
/
| 〈 |
|
〉 |
