
基于SSP-RCP不同情景的京津冀地区土地覆被变化模拟
|
范泽孟(1977-), 男, 云南镇雄人, 博士, 研究员, 研究方向为土地覆被情景曲面建模、生态模型与系统模拟。E-mail: fanzm@lreis.ac.cn |
收稿日期: 2021-02-25
要求修回日期: 2021-11-10
网络出版日期: 2022-03-25
基金资助
国家重点研发计划(2017YFA0603702)
国家自然科学基金项目(41971358)
国家自然科学基金项目(41930647)
中国科学院战略性先导科技专项(XDA20030203)
资源与环境信息系统国家重点实验室自主部署创新研究计划项目
版权
Simulation of land cover change in Beijing-Tianjin-Hebei region under different SSP-RCP scenarios
Received date: 2021-02-25
Request revised date: 2021-11-10
Online published: 2022-03-25
Supported by
National Key R&D Program of China(2017YFA0603702)
National Natural Science Foundation of China(41971358)
National Natural Science Foundation of China(41930647)
Strategic Priority Research Program of the Chinese Academy of Sciences(XDA20030203)
Innovation Research Project of State Key Laboratory of Resources and Environment Information System, CAS
Copyright
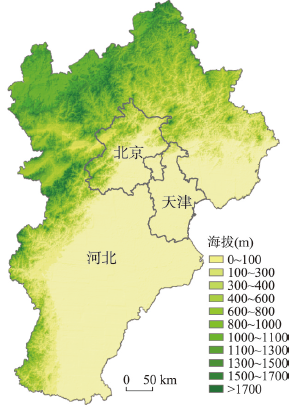
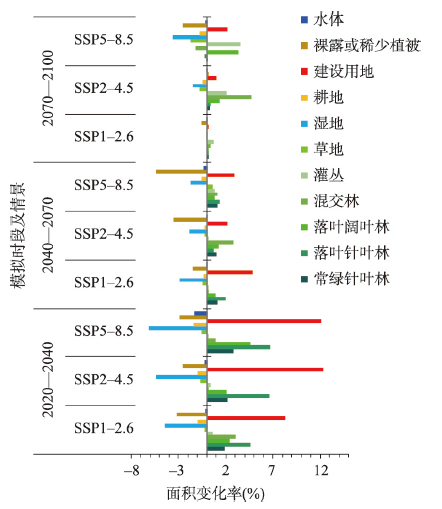
如何实现自然与人文双重驱动下的特大城市群地区土地覆被变化的情景模拟,不仅是当前土地覆被变化研究领域的热点问题,也是城镇化可持续发展研究的核心主题之一。本文在对现有土地覆被变化情景模型缺陷进行分析和修正的基础上,构建了自然要素与人文要素耦合驱动的土地覆被情景曲面建模(SSMLC)方法。结合IPCC 2020年发布的共享社会经济路径(SSPs)与典型浓度路径(RCPs)组合的CMIP6 SSP1-2.6、SSP2-4.5和SSP5-8.5的气候情景数据,以及人口、GDP、交通、政策等人文参数,分别实现了SSP1-2.6、SSP2-4.5和SSP5-8.5情景下的京津冀土地覆被变化的情景模拟。模拟结果表明:SSMLC对京津冀地区土地覆被变化模拟的总体精度为93.52%;京津冀地区的土地覆被在2020—2040时段内的变化强度最高(3.12%/10a),2040年以后的变化强度将逐渐减缓;在2020—2100年间,建设用地增加速度最快,增加率为5.07%/10a。湿地的减少速度最快,减少率为3.10%/10a。2020—2100时段内的京津冀土地覆被在SSP5-8.5情景下的变化强度整体高于在SSP1-2.6和SSP2-4.5情景下的变化强度;GDP、人口、交通和政策等人文因子对京津冀地区耕地、建设用地、湿地和水体的影响强度高于对其他土地覆被类型的影响强度。研究结果证实了SSMLC模型能够有效模拟和定量刻画京津冀地区土地覆被空间分布格局在未来不同情景的时空变化趋势和强度,模拟结果可为京津冀协同一体化的国土空间优化配置与规划、以及生态环境建设提供辅助依据和数据支撑。

关键词: 土地覆被情景曲面建模; SSP-RCP情景; 土地覆被变化情景; 时空模拟; 京津冀
范泽孟 . 基于SSP-RCP不同情景的京津冀地区土地覆被变化模拟[J]. 地理学报, 2022 , 77(1) : 228 -244 . DOI: 10.11821/dlxb202201016
How to simulate the scenarios of land cover change, driven by climate change and human acitivities, is not only a hot issue in the field of land cover research, but also one of the core topics in the sustainable urbanization. A new method of scenarios of surface modeling in land cover (SSMLC) was developed to simulate the scenarios of land cover driven by the coupling of natural and human factors. Based on the climatic scenario data of CMIP6 SSP1-2.6, SSP2-4.5 and SSP5-8.5 released by IPCC in 2020 that combined the shared socio-economic paths (SSPS) and typical concentration paths (RCPs), the observation climatic data, the human data of population, GDP and transportation, the current data of land cover in 2020, and the related policies, scenarios of land cover in Beijing-Tianjin-Hebei (BTH) region are simulated under scenarios of SSP1-2.6, SSP2-4.5 and SSP5-8.5 during the periods of 2040, 2070 and 2100, respectively. The simulation results show that the overall accuracy of SSMLC in the BTH region is up to 93.52%. During the period from 2020 to 2100, change intensity of land cover in the BTH region is the highest (an increase of 3.29% per decade) between 2020 and 2040, and it would gradually decrease after 2040. Built-up land would have the highest increasing rate (an increase of 4.741% per decade), and the wetland would have the highest decreasing rate (a decrease of 2.64% per decade) between 2020 and 2100. The change intensity of land cover under the scenario SSP5-8.5 is higher than that under the scenarios of SSP1-2.6 and SSP1-2.6 between 2020 and 2100. The impacts of GDP, population, transportation and policies on the changes in cultivated land, built-up land, wetland and water body are generally higher than on other types of land cover. Moreover, the research results indicate that the SSMLC method could be used to explicitly project the changing trend and intensity of land cover under different sceaniros, which will benefit the spatial optimal allocation and planing of land cover, and could be used to obtain the key data for carrying out the eco-environment conservation measures in the BTH region in the future.
表1 每种土地覆被类型的模拟精度对比分析Tab. 1 Comparative analysis of accuracy in each land cover type |
| 土地覆被 类型 | 2020年土地覆被 现状值(km2) | 2020年土地覆被 模拟值(km2) | 模拟 精度(%) |
|---|---|---|---|
| 常绿针叶林 | 1206 | 1275 | 94.28 |
| 落叶针叶林 | 2561 | 2801 | 90.63 |
| 落叶阔叶林 | 20456 | 22931 | 87.90 |
| 混交林 | 1507 | 1582 | 95.02 |
| 灌丛 | 17490 | 19079 | 90.91 |
| 草地 | 32923 | 31153 | 94.62 |
| 湿地 | 3007 | 2879 | 95.74 |
| 耕地 | 124170 | 121162 | 97.58 |
| 建设用地 | 8901 | 9475 | 93.55 |
| 裸露或稀少植被 | 709 | 665 | 93.79 |
| 水体 | 1979 | 1907 | 96.36 |
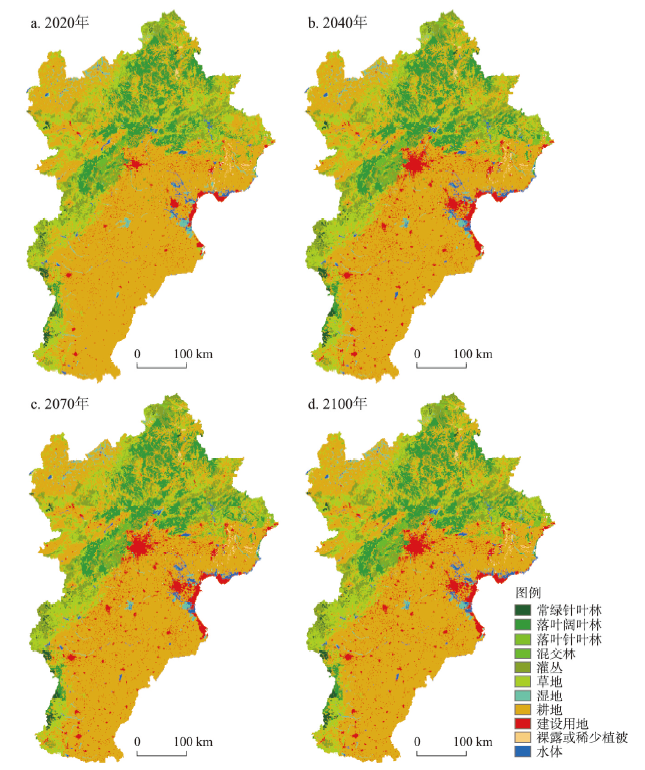
图2 SSP1-2.6情景的京津冀土地覆被时空分布变化Fig. 2 Spatiotemporal distribution and changes in the Beijing-Tianjin-Hebei region under the scenario SSP1-2.6 |
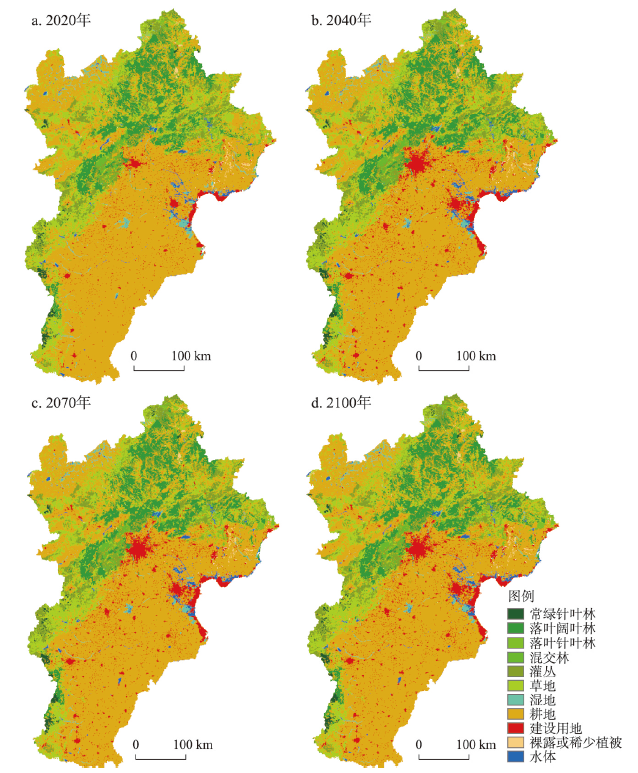
图3 SSP2-4.5情景的京津冀土地覆被时空分布变化Fig. 3 Spatiotemporal distribution and changes in the Beijing-Tianjin-Hebei region under the scenario SSP2-4.5 |
表2 SSP1-2.6情景的京津冀土地覆被面积变化(km2)Tab. 2 Land cover change in the Beijing-Tianjin-Hebei region under the scenario SSP1-2.6 (km2) |
| 土地覆被类型 | 2020年 | 2040年 | 2070年 | 2100年 | 10 a变化率(%) |
|---|---|---|---|---|---|
| 常绿针叶林 | 1206 | 1251 | 1291 | 1295 | 0.92 |
| 落叶针叶林 | 2561 | 2795 | 2953 | 2957 | 1.93 |
| 落叶阔叶林 | 20456 | 21427 | 22008 | 22103 | 1.01 |
| 混交林 | 1507 | 1598 | 1601 | 1617 | 0.91 |
| 灌丛 | 17490 | 17667 | 17703 | 18033 | 0.39 |
| 草地 | 32923 | 32732 | 32281 | 32162 | -0.29 |
| 湿地 | 3007 | 2736 | 2495 | 2487 | -2.16 |
| 耕地 | 124170 | 121692 | 120104 | 119761 | -0.44 |
| 建设用地 | 8901 | 10377 | 11875 | 11912 | 4.23 |
| 裸露或稀少植被 | 709 | 663 | 633 | 621 | -1.55 |
| 水体 | 1979 | 1971 | 1965 | 1961 | -0.11 |
表3 SSP2-4.5情景的京津冀土地覆被面积变化(km2)Tab. 3 Land cover change in the Beijing-Tianjin-Hebei region under the scenario SSP2-4.5 (km2) |
| 土地覆被类型 | 2020年 | 2040年 | 2070年 | 2100年 | 10 a变化率(%) |
|---|---|---|---|---|---|
| 常绿针叶林 | 1206 | 1258 | 1295 | 1304 | 1.02 |
| 落叶针叶林 | 2561 | 2897 | 2957 | 2987 | 2.08 |
| 落叶阔叶林 | 20456 | 21273 | 22051 | 22937 | 1.52 |
| 混交林 | 1507 | 1509 | 1636 | 1864 | 2.96 |
| 灌丛 | 17490 | 17604 | 17593 | 18675 | 0.85 |
| 草地 | 32923 | 32453 | 32217 | 31397 | -0.58 |
| 湿地 | 3007 | 2679 | 2529 | 2415 | -2.46 |
| 耕地 | 124170 | 121502 | 120273 | 118625 | -0.56 |
| 建设用地 | 8901 | 11093 | 11794 | 12145 | 4.56 |
| 裸露或稀少植被 | 709 | 672 | 601 | 603 | -1.87 |
| 水体 | 1979 | 1969 | 1963 | 1957 | -0.14 |
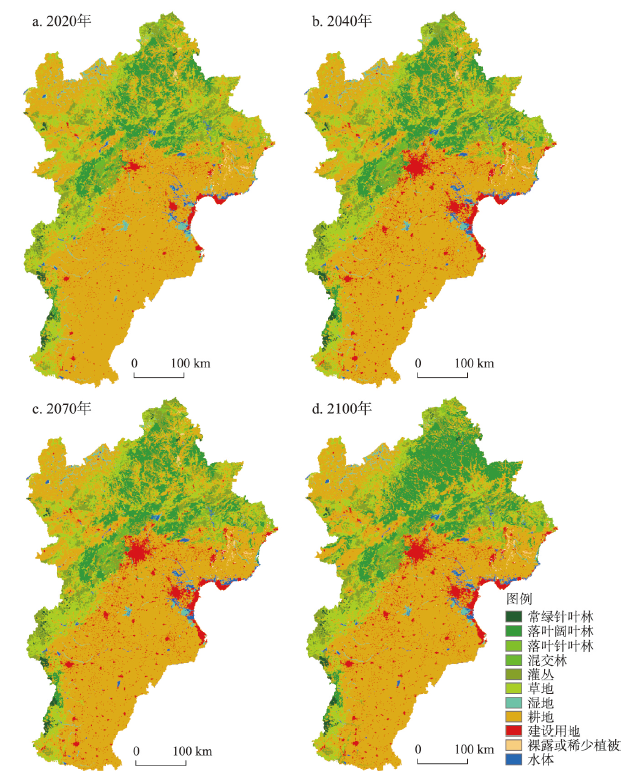
表4 SSP5-8.5情景的京津冀土地覆被面积变化(km2)Tab. 4 Land cover change in the Beijing-Tianjin-Hebei region under the scenario SSP5-8.5 (km2) |
| 土地覆被类型 | 2020年 | 2040年 | 2070年 | 2100年 | 10 a变化率(%) |
|---|---|---|---|---|---|
| 常绿针叶林 | 1206 | 1272 | 1315 | 1311 | 1.09 |
| 落叶针叶林 | 2561 | 2901 | 3011 | 2987 | 2.08 |
| 落叶阔叶林 | 20456 | 22305 | 22814 | 25095 | 2.83 |
| 混交林 | 1507 | 1533 | 1581 | 1524 | 0.14 |
| 灌丛 | 17490 | 17502 | 17899 | 19797 | 1.65 |
| 草地 | 32923 | 32524 | 33107 | 31351 | -0.60 |
| 湿地 | 3007 | 2632 | 2492 | 2216 | -3.29 |
| 耕地 | 124170 | 120601 | 118241 | 115463 | -0.88 |
| 建设用地 | 8901 | 11047 | 11991 | 12759 | 5.42 |
| 裸露或稀少植被 | 709 | 667 | 557 | 513 | -3.46 |
| 水体 | 1979 | 1925 | 1901 | 1893 | -0.54 |
| [1] |
|
| [2] |
|
| [3] |
|
| [4] |
[ 范泽孟, 岳天祥, 刘纪远, 等. 中国土地覆盖时空变化未来情景分析. 地理学报, 2005, 60(6): 941-952.]
|
| [5] |
|
| [6] |
|
| [7] |
|
| [8] |
|
| [9] |
|
| [10] |
|
| [11] |
|
| [12] |
|
| [13] |
|
| [14] |
|
| [15] |
|
| [16] |
|
| [17] |
|
| [18] |
|
| [19] |
[ 方创琳. 中国城市群研究取得的重要进展与未来发展方向. 地理学报, 2014, 69(8): 1130-1144.]
|
| [20] |
[ 陆大道. 京津冀城市群功能定位及协同发展. 地理科学进展, 2015, 34(3): 265-270.]
|
| [21] |
[ 方创琳, 周成虎, 顾朝林, 等. 特大城市群地区城镇化与生态环境交互耦合效应解析的理论框架及技术路径. 地理学报, 2016, 71(4): 531-550.]
|
| [22] |
[ 方创琳. 京津冀城市群协同发展的理论基础与规律性分析. 地理科学进展, 2017, 36(1): 15-24.]
|
| [23] |
[ 欧阳晓, 朱翔. 中国城市群城市用地扩张时空动态特征. 地理学报, 2020, 75(3): 571-588.]
|
| [24] |
[ 陈娱, 金凤君, 陆玉麒, 等. 京津冀地区陆路交通网络发展过程及可达性演变特征. 地理学报, 2017, 72(12): 2252-2264.]
|
| [25] |
[ 樊杰. 京津冀都市圈区域综合规划研究. 北京: 科学出版社, 2008.]
|
| [26] |
[ 陈洁, 陆锋. 京津冀都市圈城市区位与交通可达性评价. 地理与地理信息科学, 2008, 24(2): 53-56.]
|
| [27] |
[ 王利伟, 冯长春. 转型期京津冀城市群空间扩展格局及其动力机制: 基于夜间灯光数据方法. 地理学报, 2016, 71(12): 2155-2169.]
|
| [28] |
[ 王海军, 张彬, 刘耀林, 等. 基于重心-GTWR模型的京津冀城市群城镇扩展格局与驱动力多维解析. 地理学报, 2018, 73(6): 1076-1092.]
|
| [29] |
[ 祝尔娟. 京津冀一体化中的产业升级与整合. 经济地理, 2009, 29(6): 881-886.]
|
| [30] |
|
| [31] |
[ 张丽霞, 陈晓龙, 辛晓歌. CMIP6情景模式比较计划(ScenarioMIP)概况与评述. 气候变化研究进展, 2019, 15(5): 519-525.
|
| [32] |
|
| [33] |
[ 付晶莹, 江东, 黄耀欢. 中国公里网格人口分布数据集. 地理学报, 2014, 69(S): 41-44.]
|
| [34] |
[ 黄耀欢, 江东, 付晶莹. 中国公里网格GDP分布数据集. 地理学报, 2014, 69(S): 45-48.]
|
| [35] |
[ 姜彤, 赵晶, 景丞, 等. IPCC共享社会经济路径下中国和分省人口变化预估. 气候变化研究进展, 2017, 13(2): 128-137.]
|
| [36] |
[ 姜彤, 赵晶, 曹丽格, 等. 共享社会经济路径下中国及分省经济变化预测. 气候变化研究进展, 2018, 14(1): 50-58.]
|
| [37] |
[ 范泽孟, 张轩, 李婧, 等. 国家级自然保护区土地覆盖类型转换趋势. 地理学报, 2012, 67(12): 1623-1633.]
|
| [38] |
[ 范泽孟, 黄言, 岳天祥. 青藏高原维管植物物种丰富度分布的情景模拟. 地理学报, 2018, 73(1): 164-176.]
|
| [39] |
[ 刘纪远, 张增祥, 徐新良, 等. 21世纪初中国土地利用变化的空间格局与驱动力分析. 地理学报, 2009, 64(12): 1411-1420.]
|
| [40] |
|
| [41] |
|
| [42] |
|
| [43] |
|
| [44] |
|
| [45] |
|
| [46] |
|
| [47] |
|
| [48] |
|
| [49] |
|
| [50] |
|
| [51] |
[ 顾朝林, 管卫华, 刘合林. 中国城镇化2050: SD模型与过程模拟. 中国科学: 地球科学, 2017, 47(7): 818-832.]
|
| [52] |
[ 王开泳, 丁俊, 王甫园. 全面二孩政策对中国人口结构及区域人口空间格局的影响. 地理科学进展, 2016, 35(11): 1305-1316.]
|
| [53] |
[ 李孝永, 匡文慧. 京津冀1980—2015年城市土地利用变化时空轨迹及未来情景模拟. 经济地理, 2019, 39(3): 187-194, 200.]
|
/
| 〈 |
|
〉 |