
1981—2019年全球气温变化特征
|
沈贝蓓(1985-), 女, 山东淄博人, 博士生, 主要从事地表过程与环境演变研究。E-mail: 467856268@qq.com |
收稿日期: 2020-09-14
要求修回日期: 2021-08-31
网络出版日期: 2022-01-25
基金资助
国家自然科学基金项目(41771067)
国家自然科学基金项目(U20A2082)
黑龙江省自然科学基金项目(ZD2020D002)
版权
Changes in global air temperature from 1981 to 2019
Received date: 2020-09-14
Request revised date: 2021-08-31
Online published: 2022-01-25
Supported by
National Natural Science Foundation of China(41771067)
National Natural Science Foundation of China(U20A2082)
Key Projects of Natural Science Foundation of Heilongjiang Province(ZD2020D002)
Copyright
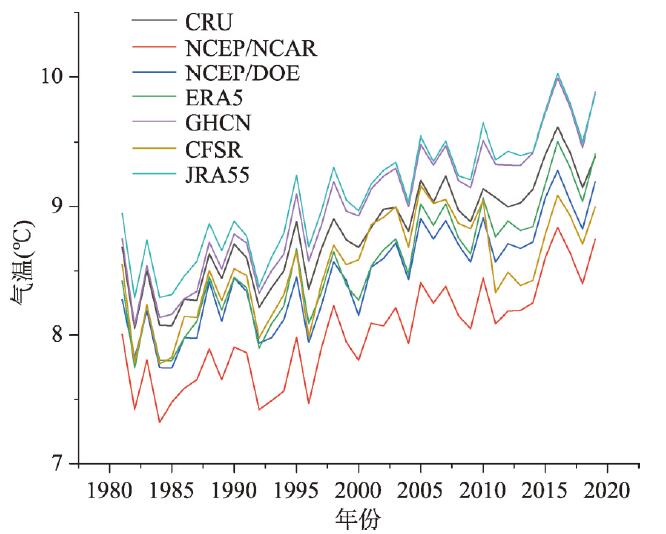
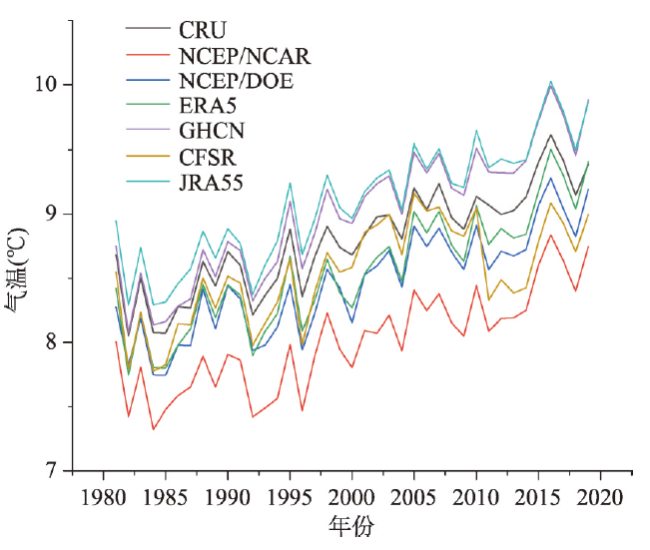
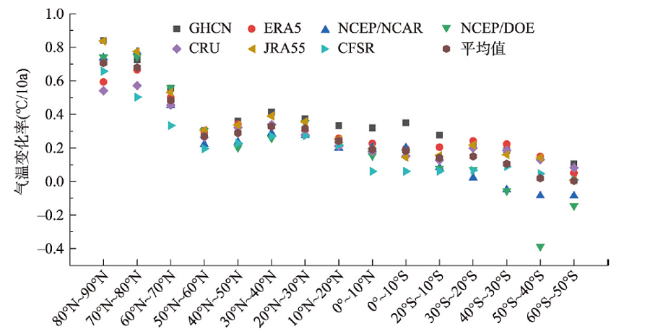
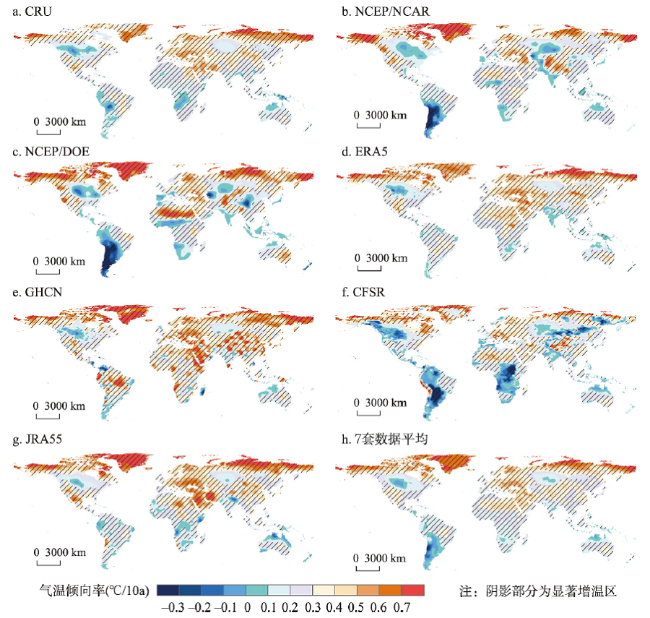
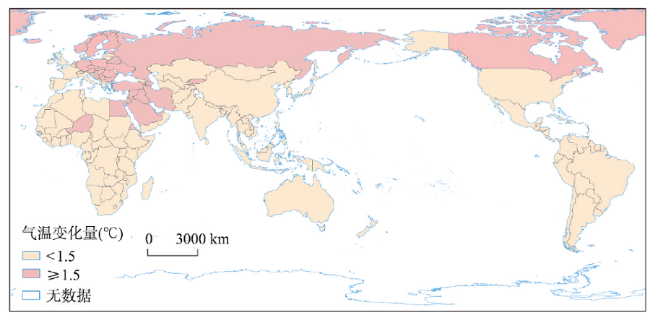
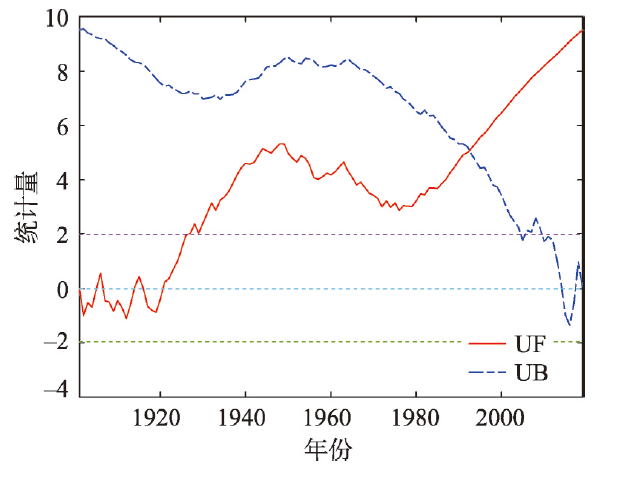
1981—2019年全球气温变化特征是揭示全球气温变化的空间差异性以及实现全球共同应对气候变化的关键。本文基于7套再分析数据,采用气候变化速率及空间插值等分析方法,分析了1981—2019年全球气温变化时空特征及主要国家气温变化。结果表明:1981—2019年全球陆地气温以0.320 ℃/10a的速率呈极显著升高趋势,年平均气温增加了0.835 ℃;南、北半球陆地气温变化速率分别为0.147 ℃/10a、0.362 ℃/10a,均呈极显著增加趋势,分别增加了0.874 ℃、0.828 ℃。全球陆地80%面积上气温呈现显著增加趋势,年平均气温升高速率最大的区域位于80°N~90°N,其次是70°N~80°N、60°N~70°N,高纬大于中、低纬,格陵兰地区、乌克兰、俄罗斯等中高纬度国家或地区增温速率较快,尤以格陵兰地区增加速率最快,气温变化速率为0.654 ℃/10a;增温最慢的地区主要位于新西兰和赤道附近的南美洲、东南亚、非洲南部等地,气温变化速率不足0.15 ℃/10a。本文统计的146个国家中,年平均气温呈显著增加趋势的国家136个,占93%;气温无显著变化的国家10个,占6.849%。1981—2019年全球增温2.0 ℃以上、1.5 ℃以上、1.0 ℃以上的国家分别为4个、34个、68个,分别约占统计国家的2.740%、23.288%、46.575%。本文认为1998年以来全球并没有出现气温变暖停滞的现象。
关键词: 全球气温变化; 局部空间; 全球主要国家; 1981—2019年
沈贝蓓 , 宋帅峰 , 张丽娟 , 王子晴 , 任崇 , 李永生 . 1981—2019年全球气温变化特征[J]. 地理学报, 2021 , 76(11) : 2660 -2672 . DOI: 10.11821/dlxb202111005
The determination of temperature changes in major countries since the 1980s is a key scientific method to reveal the spatial difference of global temperature change and to achieve a common global climate change. Based on seven sets of reanalysis data, this paper analyzed the spatio-temporal characteristics of global temperature change and the temperature change of major countries from 1981 to 2019 by using climate tendency rate and spatial interpolation. The results revealed that the global land air temperature in the stydy period varied at a rate of 0.320 °C/10a, exhibiting a significant increasing trend, with a cumulative increase of 0.835 °C. The mean annual land air temperature in the northern and southern hemispheres varied respectively at rates of 0.362 °C/10a and 0.147 °C/10a, displaying significant increasing trends, with cumulative increases of 0.828 °C and 0.874 °C,respectively. The global land surface air temperature displayed an increasing trend, with more than 80% of the land surfaces showing a significant temperature increase. Across the globe, the change rates of annual mean air temperature were higher at high latitudes than at middle and low latitudes, with the highest change rates in regions at latitudes of 80°N-90°N, followed by the second-highest rates in regions from 70°N-80°N, and the third-highest rates from 60°N-70°N. Greenland, Ukraine, and Russia had the highest increase rates of annual mean air temperature, especially Greenland, which experienced a temperature tendency rate of 0.654 °C/10a. The regions with the lowest increase rates of annual mean air temperature were mainly in New Zealand and areas on or near the equator including South America, Southeast Asia and Southern Africa, where the temperature tendency rates were < 0.15 °C/10a. Among the 146 countries surveyed in this paper, 136 countries (93%) showed a significant warming trend, 10 (6.849%) had no significant change in temperature, and only 3 countries showed a downward trend. Among them, since the 1980s, there are 4, 34, and 68 countries with global warming above 2.0 ℃, 1.5 ℃, and 1.0 ℃, respectively, accounting for 2.740%, 23.288% and 46.575% of the countries concerned in this study. This paper held that there had been no global warming hiatus since 1998.
表1 全球7套再分析气温数据间相关系数Tab. 1 Correlation coefficients between seven sets of global reanalysis temperature data |
| CRU | NCEP/NCAR | NCEP/DOE | ERA5 | GHCN | CFSR | JRA55 | |
|---|---|---|---|---|---|---|---|
| CRU | 1 | 0.974** | 0.983** | 0.987** | 0.993** | 0.872** | 0.992** |
| NCEP/NCAR | 1 | 0.984** | 0.982** | 0.968** | 0.866** | 0.975** | |
| NCEP/DOE | 1 | 0.989** | 0.977** | 0.884** | 0.978** | ||
| ERA5 | 1 | 0.983** | 0.858** | 0.988** | |||
| GHCN | 1 | 0.865** | 0.996** | ||||
| CFSR | 1 | 0.863** | |||||
| JRA55 | 1 |
注:*、**分别表示在0.05和0.01水平上显著,下同。 |
表2 1981—2019年全球、北半球和南半球平均气温和变化速率Tab. 2 Annual mean temperature and its tendency rate of global, northern and southern hemispheres from 1981 to 2019 |
| CRU | NCEP/NCAR | NCEP/DOE | ERA5 | GHCN | CFSR | JRA55 | 平均值 | ||
|---|---|---|---|---|---|---|---|---|---|
| 平均气温 (℃) | 全球陆地 | 8.793 | 8.008 | 8.460 | 8.556 | 9.002 | 8.541 | 9.093 | 8.636 |
| 北半球 | 5.612 | 4.974 | 5.397 | 5.488 | 5.939 | 5.579 | 6.139 | 5.590 | |
| 南半球 | 21.623 | 20.493 | 21.063 | 21.179 | 21.532 | 20.795 | 21.450 | 21.162 | |
| 气温变化速率(℃/10a) | 全球陆地 | 0.310** | 0.283** | 0.307** | 0.347** | 0.403** | 0.231** | 0.358** | 0.320** |
| 北半球 | 0.347** | 0.332** | 0.364** | 0.380** | 0.439** | 0.271** | 0.403** | 0.362** | |
| 南半球 | 0.161** | 0.081** | 0.072* | 0.211** | 0.267** | 0.066 | 0.169** | 0.147** |
图2 1981—2019年全球不同纬度气温变化速率分布Fig. 2 Distribution of temperature change rate at different latitudes from 1981 to 2019 |
表3 1981—2019年全球各纬度年平均气温变化量及变化速率Tab. 3 Temperature tendency rate and temperature variation at different latitudes from 1981 to 2019 |
| 纬度范围(°N) | 变化速率(℃/10a) | 变化量(℃) | 纬度范围(°S) | 变化速率(℃/10a) | 变化量(℃) |
|---|---|---|---|---|---|
| 80~90 | 0.707** | 2.757 | 0~10 | 0.182** | 0.710 |
| 70~80 | 0.680** | 2.652 | 20~10 | 0.141** | 0.550 |
| 60~70 | 0.484** | 1.888 | 30~20 | 0.150** | 0.585 |
| 50~60 | 0.270** | 1.053 | 40~30 | 0.105** | 0.410 |
| 40~50 | 0.289** | 1.127 | 50~40 | 0.02 | 0.078 |
| 30~40 | 0.328** | 1.279 | 60~50 | 0.004 | 0.016 |
| 20~30 | 0.316** | 1.232 | |||
| 10~20 | 0.242** | 0.944 | |||
| 0~10 | 0.191** | 0.745 |
表4 1981—2019年全球主要国家和地区气温变化速率7套数据平均值(℃/10a)Tab. 4 Temperature tendency rate of main countries and regions by the average of seven sets of data (℃/10a) |
| 国家或地区 | 变化速率 | 国家或地区 | 变化速率 | 国家或地区 | 变化速率 | 国家或地区 | 变化速率 |
|---|---|---|---|---|---|---|---|
| 格陵兰 | 0.654** | 克罗地亚 | 0.365** | 西撒哈拉 | 0.232** | 南非 | 0.169** |
| 乌克兰 | 0.533** | 拉脱维亚 | 0.363** | 缅甸 | 0.232** | 刚果(金) | 0.167** |
| 俄罗斯 | 0.523** | 丹麦 | 0.361** | 哈萨克斯坦 | 0.230* | 塞拉利昂 | 0.167** |
| 罗马尼亚 | 0.517** | 比利时 | 0.356** | 科特迪瓦 | 0.230** | 厄瓜多尔 | 0.162** |
| 斯洛伐克 | 0.511** | 蒙古 | 0.330** | 中非 | 0.225** | 多米尼加 | 0.158** |
| 匈牙利 | 0.504** | 苏丹 | 0.329** | 乌干达 | 0.217** | 赞比亚 | 0.153** |
| 芬兰 | 0.503** | 阿富汗 | 0.329** | 老挝 | 0.214** | 安哥拉 | 0.150** |
| 塞尔维亚 | 0.502** | 吉布提 | 0.327** | 喀麦隆 | 0.211** | 秘鲁 | 0.146** |
| 亚美尼亚 | 0.474** | 希腊 | 0.326** | 坦桑尼亚 | 0.211** | 马来西亚 | 0.146** |
| 波黑 | 0.473** | 黑山 | 0.323** | 印度 | 0.207** | 爱尔兰 | 0.145* |
| 挪威 | 0.471** | 阿尔及利亚 | 0.322** | 几内亚 | 0.207** | 圭亚那 | 0.144** |
| 保加利亚 | 0.459** | 不丹 | 0.320** | 加蓬 | 0.203** | 苏里南 | 0.142** |
| 阿塞拜疆 | 0.455** | 科索沃 | 0.317** | 英国 | 0.199** | 博茨瓦纳 | 0.142 |
| 吉尔吉斯斯坦 | 0.454** | 美国 | 0.316** | 柬埔寨 | 0.199** | 葡萄牙 | 0.141* |
| 叙利亚 | 0.453** | 乍得 | 0.309** | 泰国 | 0.197** | 津巴布韦 | 0.132* |
| 土耳其 | 0.446** | 埃塞俄比亚 | 0.296** | 索马里 | 0.196** | 古巴 | 0.130** |
| 白罗斯 | 0.444** | 中国 | 0.293** | 西班牙 | 0.193** | 哥伦比亚 | 0.129** |
| 约旦 | 0.442** | 尼泊尔 | 0.293** | 南苏丹 | 0.192** | 斯里兰卡 | 0.124** |
| 沙特阿拉伯 | 0.441** | 也门 | 0.288** | 马达加斯加 | 0.192** | 印度尼西亚 | 0.121** |
| 伊朗 | 0.440** | 瑞士 | 0.278** | 纳米比亚 | 0.191** | 孟加拉国 | 0.121** |
| 波兰 | 0.435** | 土库曼斯坦 | 0.276** | 布隆迪 | 0.19** | 哥斯达黎加 | 0.115** |
| 伊拉克 | 0.434** | 肯尼亚 | 0.275** | 巴西 | 0.187** | 伯利兹 | 0.114** |
| 捷克 | 0.433** | 马里 | 0.275** | 摩洛哥 | 0.187** | 菲律宾 | 0.105** |
| 阿联酋 | 0.420** | 毛里塔尼亚 | 0.269** | 布基纳法索 | 0.184** | 巴拿马 | 0.104* |
| 冰岛 | 0.408** | 意大利 | 0.264** | 塞内加尔 | 0.182** | 莱索托 | 0.096 |
| 厄立特里亚 | 0.406** | 韩国 | 0.264** | 马拉维 | 0.181** | 巴布亚新几内亚 | 0.09** |
| 埃及 | 0.402** | 乌兹别克斯坦 | 0.263** | 刚果(布) | 0.181** | 尼加拉瓜 | 0.081* |
| 德国 | 0.402** | 巴基斯坦 | 0.262** | 危地马拉 | 0.180** | 新西兰 | 0.069 |
| 瑞典 | 0.401** | 墨西哥 | 0.262** | 尼日利亚 | 0.180** | 洪都拉斯 | 0.055 |
| 加拿大 | 0.393** | 朝鲜 | 0.262** | 越南 | 0.178** | 玻利维亚 | 0.047 |
| 爱沙尼亚 | 0.390** | 法国 | 0.261** | 加纳 | 0.176** | 乌拉圭 | 0.044 |
| 奥地利 | 0.387** | 阿尔巴尼亚 | 0.253** | 利比里亚 | 0.174** | 东帝汶 | 0.024 |
| 荷兰 | 0.387** | 索马里兰 | 0.250** | 几内亚比绍 | 0.174** | 巴拉圭 | -0.005 |
| 尼日尔 | 0.386** | 塔吉克斯坦 | 0.249** | 莫桑比克 | 0.174** | 阿根廷 | -0.022 |
| 利比亚 | 0.381** | 阿曼 | 0.244** | 澳大利亚 | 0.174** | 智利 | -0.114 |
| 立陶宛 | 0.366** | 日本 | 0.243** | 委内瑞拉 | 0.172** | ||
| 格鲁吉亚 | 0.365** | 突尼斯 | 0.233** | 贝宁 | 0.171** |
表5 20世纪80年代以来不同作者研究结果比较Tab. 5 Comparison of the results of different authors since the 1980s |
| 研究区域 | 研究时段 | 研究数据 | 气温变化速率(℃/10a) | 文献来源 | 研究区域 | 研究时段 | 研究数据 | 气温变化速率(℃/10a) | 文献来源 |
|---|---|---|---|---|---|---|---|---|---|
| 全球 | 1979—2010 | GISS | 0.171 | [13] | 北 半 球 | 1979—2015 | CMA-LASTv1.0 | 0.319 | [19] |
| GHCN | 0.175 | 1979—2014 | CMA-LAST | 0.305±0.030 | [17] | ||||
| HadCRUT3v | 0.170 | 1979—2010 | CRUTEM4 | 0.350 | [20] | ||||
| RSS | 0.157 | 1979—2010 | ERA-Interim | 0.380 | |||||
| UAH | 0.141 | 1981—2019 | CRU | 0.347 | 本文 | ||||
| 1979—2015 | CMA-LASTv1.0 | 0.250 | [9] | NCEP/NCAR | 0.332 | ||||
| CRUTEM4.1.1 | 0.254 | NCEP/DOE | 0.364 | ||||||
| GHCN-V3.2.0 | 0.273 | ERA5 | 0.380 | ||||||
| 1979—2014 | CRUTEM4.4.0.0 | 0.304±0.060 | [10] | GHCN | 0.439 | ||||
| 1979—2014 | CMA-LAST | 0.272±0.025 | [9] | CFSR | 0.271 | ||||
| 1979—2010 | GISS | 0.254±0.049 | [11] | JRA55 | 0.403 | ||||
| 1979—2010 | GHCN | 0.273±0.047 | [12] | 平均 | 0.362 | ||||
| 1979—2012 | ERA-Interim | 0.110 | [14] | 南 半 球 | 1979—2015 | CMA-LASTv1.0 | 0.142 | [9] | |
| 1981—2010 | MERRA | 0.130 | [15] | 1979—2010 | CRUTEM4 | 0.13 | [20] | ||
| 1981—2019 | CRU | 0.310 | 本文 | 1979—2010 | ERA-Interim | 0.12 | |||
| NCEP/NCAR | 0.283 | 1979—2014 | CMA-LAST | 0.142±0.021 | [17] | ||||
| NCEP/DOE | 0.307 | 1981—2019 | CRU | 0.161 | 本文 | ||||
| ERA5 | 0.347 | NCEP/NCAR | 0.081 | ||||||
| GHCN | 0.403 | NCEP/DOE | 0.072 | ||||||
| CFSR | 0.231 | ERA5 | 0.211 | ||||||
| JRA55 | 0.358 | GHCN | 0.267 | ||||||
| 平均 | 0.320 | CFSR | 0.066 | ||||||
| JRA55 | 0.169 | ||||||||
| 平均 | 0.147 |
表6 不同国家气温变化研究结果比较Tab. 6 Comparative results of different countries |
| 国家 | 数据源 | 研究时段 | 升温速率(℃/10a) | 本文结论(℃/10a) | 文献来源 |
|---|---|---|---|---|---|
| 斯洛文尼亚 | 气象站 | 1959—2008 | 0.15~0.36 | 0.23** | [25] |
| 瑞士 | 气象站 | 1959—2008 | 0.35 | 0.28** | [26] |
| 尼日利亚 | CRU | 1901—2000 | 0.03 | -0.002 | [27] |
| 日本 | 气象站 | 1979—2013 | 0.29 | 0.35** | [28] |
| 加拿大 | 气象站 | 1953—2005 | 1.2 | 1.29** | [29] |
| 印度 | 气象站 | 1941—1999 | 0.42 | 0.57* | [30] |
| 韩国 | 气象站 | 1960—2010 | 0.2 | 0.22** | [31] |
| 沙特阿拉伯 | 气象站 | 1979—2009 | 0.51 | 0.407** | [32] |
| 中亚 | 气象站 | 1979—2011 | 0.41 | 0.364** | [33] |
| 柬埔寨 | 气象站 | 1951—2001 | 0.23 | 0.147** | [34] |
| 亚美尼亚 | 气象站 | 1961—2014 | 0.18 | 0.19** | [35] |
| 中国 | 气象站 | 1951—2010 | 0.21±0.02 | 0.22** | [36] |
| 气象站 | 1998—2012 | -0.221 | -0.192 | [37] |
| [1] |
[郑景云, 刘洋, 吴茂炜, 等. 中国中世纪气候异常期温度的多尺度变化特征及区域差异. 地理学报, 2019, 74(7):1281-1291.]
|
| [2] |
[金凯, 王飞, 韩剑桥, 等. 1982—2015年中国气候变化和人类活动对植被NDVI变化的影响. 地理学报, 2020, 75(5):961-974.]
|
| [3] |
|
| [4] |
|
| [5] |
|
| [6] |
[张文霞, 刘普幸, 冯青荣, 等. 1960—2015年中国绿洲胡杨生长季对全球变暖的时空响应及原因. 地理学报, 2017, 72(7):1151-1162.]
|
| [7] |
|
| [8] |
IPCC. Special Report on Global Warming of 1.5°C. Cambridge: Cambridge University Press, 2018.
|
| [9] |
[孙秀宝. 基于CMA-LSAT v1.0数据集的近百年全球陆表气温变化研究[D]. 南京: 南京信息工程大学, 2018.]
|
| [10] |
|
| [11] |
|
| [12] |
|
| [13] |
|
| [14] |
|
| [15] |
[除多, 杨勇, 罗布坚参, 等. MERRA再分析地面气温产品在青藏高原的适用性分析. 高原气象, 2016, 35(2):337-350.]
|
| [16] |
|
| [17] |
|
| [18] |
|
| [19] |
[魏凤英. 现代气候统计诊断与预测技术. 2版. 北京: 气象出版社, 2007.]
|
| [20] |
|
| [21] |
|
| [22] |
|
| [23] |
|
| [24] |
|
| [25] |
|
| [26] |
|
| [27] |
|
| [28] |
|
| [29] |
|
| [30] |
|
| [31] |
|
| [32] |
|
| [33] |
|
| [34] |
|
| [35] |
|
| [36] |
|
| [37] |
[杜勤勤, 张明军, 王圣杰, 等. 中国气温变化对全球变暖停滞的响应. 地理学报, 2018, 73(9):1748-1764.]
|
| [38] |
[武丰民, 李文铠, 李伟. 北极放大效应原因的研究进展. 地球科学进展, 2019, 34(3):232-242.]
|
| [39] |
|
| [40] |
|
| [41] |
|
| [42] |
|
| [43] |
|
| [44] |
|
| [45] |
|
| [46] |
|
| [47] |
|
| [48] |
|
| [49] |
|
| [50] |
|
| [51] |
|
/
| 〈 |
|
〉 |