
数字经济增长动力与区域收入的空间分布规律
|
陈修颖(1965-), 男, 湖南长沙人, 博士, 教授, 研究方向为经济地理和区域规划。E-mail: 781737934@qq.com |
收稿日期: 2020-06-02
要求修回日期: 2021-03-09
网络出版日期: 2021-10-25
基金资助
国家社会科学基金项目(15AZD072)
版权
Spatial distribution of digital economic growth dynamics and regional income
Received date: 2020-06-02
Request revised date: 2021-03-09
Online published: 2021-10-25
Supported by
National Social Science Foundation of China(15AZD072)
Copyright
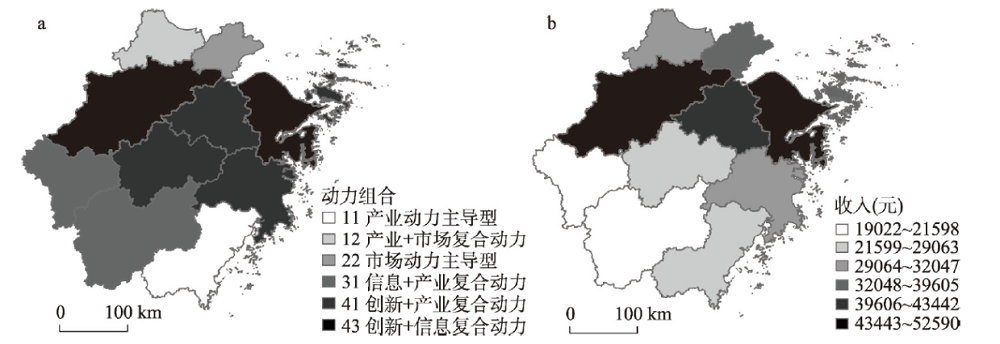
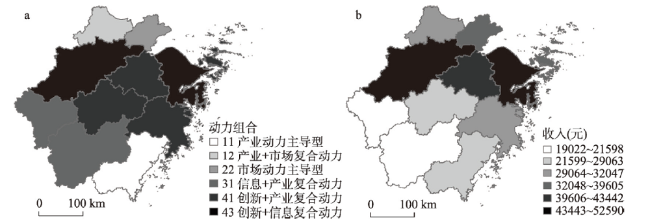
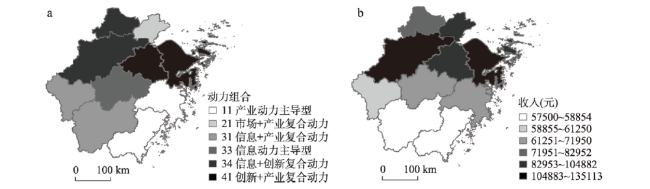
为探究数字经济增长的动力构成、地域差异以及与区域收入之间的空间分布规律,本文以中国数字经济创新高地浙江省为样本,构建了数字经济增长动力要素指标体系,并首先提出了数字经济“增长动力指数”构想。借助Weaver-Thomas模型、灰色关联分析以及GIS分层设色法,从地级市层面对浙江省数字经济增长的主导动力构成进行空间可视化分析,并验证了其与区域收入的关联性。结果表明:① 浙江省数字经济增长动力类型特征呈弱波动状态。② 从整体空间格局来看,数字经济增长呈现以杭州和宁波为核心的“双核心”空间格局现象,产业供给动力主导型主要分布在浙西南地区;市场需求动力主导型、信息应用动力主导型及创新驱动动力主导型主要分布在浙西北地区。③ 数字经济“增长动力指数”与区域收入之间存在较强的关联性,较高的数字经济增长动力指数对应的地区收入也处于较高水平,反之亦然。数字经济主导动力结构的变化正在形成一种复杂多样的区域经济增长行为模式。
陈修颖 , 苗振龙 . 数字经济增长动力与区域收入的空间分布规律[J]. 地理学报, 2021 , 76(8) : 1882 -1894 . DOI: 10.11821/dlxb202108005
To explore the dynamic digital economy growth, regional differences, and the spatial distribution of regional income, this study takes Zhejiang Province, China's digital economy innovation highland, as a research sample, constructs the index system of dynamic factors of digital economic growth, and proposes the concept of a Digital Economy Growth Driving Index (DEGDI). Using the Weaver-Thomas model, grey correlation analysis, and GIS hierarchical coloring method, the paper analyzes the dominant driving force of digital economic growth in Zhejiang at the city level and verifies its relevance with regional income. The research results show that: (1) The dynamic characteristics of digital economic growth in this province fluctuates in a small range. (2) From the spatial pattern, the digital economic growth presents a "double core" phenomenon, in which Hangzhou and Ningbo are the cores. The industry-supply leading type is mainly distributed in the southwest of Zhejiang; the market-demand-driven, information-application-driven, and innovation-driven types are mainly found in the northwest part of the province. (3) There is a strong correlation between the DEGDI and regional income. The higher the DEGI, the higher the regional income, and vice versa. The change of the leading dynamics structure of the digital economy is forming a complex and diverse regional economic growth behavior mode.
表1 数字经济增长动力指标体系及类型Tab. 1 Index system and types of digital economic growth dynamics |
| 动力类型 | 代表指标 | 指标计算公式 | 单位 | 标签 | 文献来源 |
|---|---|---|---|---|---|
| 市场需 求动力 | 人均在线购物数额 | 地区社会消费品零售总额/地区总人口 | 元 | Onlicon | [19, 27, 29] |
| 人均在线支付数额 | 地区电信业务收入总额/地区总人口 | 元 | Onlipay | [19, 29] | |
| 信息应 用动力 | 百人移动电话保有率 | 地区移动电话数量/地区总人口 | 个/万人 | Mobile | [14, 27, 30] |
| 百人互联网网民比例 | 地区互联网网民数量/地区总人口 | % | Internet | [6, 27] | |
| 信息通信产业就业比例 | 信息通信产业就业人数/城镇总就业人数 | % | Infojob | [6, 8, 29] | |
| 创新驱 动动力 | 万人专利保有量 | 地区授权专利数/地区总人口 | 个/万人 | Patent | [6, 29] |
| 万人大学生保有量 | 地区大学生数/地区总人口 | 人/万人 | Student | [6, 11] | |
| 产业供 给动力 | 服务业产值占RGDP比例 | 服务业RGDP/区域GDP总量 | % | Servout | [12, 27] |
| 服务业投资占固定投资比例 | 服务业投资额/总固定投资额 | % | Servinve | [6, 29] | |
| 财政自给率 | 地方财政一般预算内收入/一般预算内支出 | % | Finself | [11-12, 31] |
表2 数字经济增长动力Weaver-Thomas指数计算实例(杭州为例)Tab. 2 Calculation example of Weaver-Thomas index of digital economic growth (Hangzhou case) |
| 要素组合类型 | 计算方法 | Infojob | Student | Onlipay | Onlicon | Finself | Patent | Servinve | Internet | Mobile | Servout |
|---|---|---|---|---|---|---|---|---|---|---|---|
| 一元驱动 | Xi | 22.06 | 16.29 | 9.09 | 8.54 | 8.40 | 7.37 | 7.20 | 7.10 | 6.99 | 6.96 |
| X | 100 | 0 | 0 | 0 | 0 | 0 | 0 | 0 | 0 | 0 | |
| (Xi-X)2 | 6074.12 | 265.46 | 82.54 | 72.88 | 70.57 | 54.32 | 51.78 | 50.41 | 48.91 | 48.47 | |
| S2 | 681.95 | ||||||||||
| 二元驱动 | Xi | 22.06 | 16.29 | 9.09 | 8.54 | 8.40 | 7.37 | 7.20 | 7.10 | 6.99 | 6.96 |
| X | 50 | 50 | 0 | 0 | 0 | 0 | 0 | 0 | 0 | 0 | |
| (Xi-X)2 | 780.46 | 1136.17 | 82.54 | 72.88 | 70.57 | 54.32 | 51.78 | 50.41 | 48.91 | 48.47 | |
| S2 | 239.65 | ||||||||||
| 三元驱动 | Xi | 22.06 | 16.29 | 9.09 | 8.54 | 8.40 | 7.37 | 7.20 | 7.10 | 6.99 | 6.96 |
| X | 33.3 | 33.3 | 33.3 | 0 | 0 | 0 | 0 | 0 | 0 | 0 | |
| (Xi-X)2 | 126.26 | 289.24 | 586.35 | 72.88 | 70.57 | 54.32 | 51.78 | 50.41 | 48.91 | 48.47 | |
| S2 | 139.92 | ||||||||||
| ··· | |||||||||||
| 六元驱动 | Xi | 22.06 | 16.29 | 9.09 | 8.54 | 8.40 | 7.37 | 7.20 | 7.10 | 6.99 | 6.96 |
| X | 16.6 | 16.6 | 16.6 | 16.6 | 16.6 | 16.6 | 0 | 0 | 0 | 0 | |
| (Xi-X)2 | 29.85 | 0.09 | 56.47 | 65.01 | 67.23 | 85.19 | 51.78 | 50.41 | 48.91 | 48.47 | |
| S2 | 50.34 | ||||||||||
| ··· | |||||||||||
| 十元驱动 | Xi | 22.06 | 16.29 | 9.09 | 8.54 | 8.40 | 7.37 | 7.20 | 7.10 | 6.99 | 6.96 |
| X | 10 | 10 | 10 | 10 | 10 | 10 | 10 | 10 | 10 | 10 | |
| (Xi-X)2 | 145.52 | 39.60 | 0.84 | 2.14 | 2.56 | 6.92 | 7.86 | 8.41 | 9.04 | 9.23 | |
| S2 | 23.21 |
表3 2007—2017年浙江省数字经济增长动力指数分布Tab. 3 Dynamic index distribution of digital economic growth in Zhejiang Province from 2007 to 2017 |
| 城市 | 2007年 | 2010年 | 2015年 | 2017年 |
|---|---|---|---|---|
| 杭州 | 43 | 43 | 43 | 34 |
| 宁波 | 43 | 43 | 42 | 41 |
| 温州 | 11 | 11 | 11 | 11 |
| 嘉兴 | 22 | 22 | 21 | 21 |
| 湖州 | 12 | 41 | 43 | 34 |
| 绍兴 | 41 | 41 | 41 | 41 |
| 金华 | 41 | 33 | 32 | 33 |
| 衢州 | 31 | 32 | 31 | 31 |
| 舟山 | 41 | 24 | 33 | 41 |
| 台州 | 41 | 11 | 11 | 11 |
| 丽水 | 31 | 31 | 31 | 31 |
表4 2007—2017年浙江省数字经济增长动力指数与域收入灰色关联度系数Tab. 4 Grey correlation coefficient between the dynamic index of digital economic growth and regional income in Zhejiang Province from 2007 to 2017 |
| 年份 | ||||
|---|---|---|---|---|
| 2007 | 3.3828 | 2.5582 | 0.8246 | 0.8938 |
| 2010 | 3.6750 | 3.1397 | 0.5354 | 0.9359 |
| 2015 | 3.8942 | 2.9769 | 0.9174 | 0.8956 |
| 2017 | 3.5928 | 1.2794 | 2.3134 | 0.7174 |
| [1] |
|
| [2] |
|
| [3] |
|
| [4] |
[ 荆文君, 孙宝文. 数字经济促进经济高质量发展: 一个理论分析框架. 经济学家, 2019(2):66-73.]
|
| [5] |
|
| [6] |
OECD. OECD digital economy outlook 2015. Paris: OECD Publishing, 2015: 20-24.
|
| [7] |
|
| [8] |
[ 孙杰, 苗振龙, 陈修颖. 中国信息化鸿沟对区域收入差异的影响. 经济地理, 2019, 39(12):31-38.]
|
| [9] |
[ 裴长洪, 倪江飞, 李越. 数字经济的政治经济学分析. 财贸经济, 2018, 39(9):5-22.]
|
| [10] |
|
| [11] |
|
| [12] |
[ 강윤호. 지역경제 성장의 영향요인 분석. 한국행정학보, 2008, 42(1):365-381.]
|
| [13] |
|
| [14] |
[ 王彬燕, 田俊峰, 程利莎, 等. 中国数字经济空间分异及影响因素. 地理科学, 2018, 38(6):859-868.]
|
| [15] |
[ 徐晋, 梁米亚. 论蚂蚁效应与数字经济: 对羊群效应否命题的分析与应用. 经济学家, 2017(4):27-35.]
|
| [16] |
|
| [17] |
[ 张勋, 万广华, 张佳佳, 等. 数字经济、普惠金融与包容性增长. 经济研究, 2019, 54(8):71-86.]
|
| [18] |
[ 刘淑春. 中国数字经济高质量发展的靶向路径与政策供给. 经济学家, 2019(6):52-61.]
|
| [19] |
[ 张雪玲, 焦月霞. 中国数字经济发展指数及其应用初探. 浙江社会科学, 2017(4):32-40, 157.]
|
| [20] |
[ 陈晓红. 数字经济时代的技术融合与应用创新趋势分析. 社会科学家, 2018(8):8-23.]
|
| [21] |
[ 赵昌文, 许召元, 朱鸿鸣. 工业化后期的中国经济增长新动力. 中国工业经济, 2015(6):44-54.]
|
| [22] |
|
| [23] |
|
| [24] |
|
| [25] |
[ 李汝资, 刘耀彬, 谢德金. 中国产业结构变迁中的经济效率演进及影响因素. 地理学报, 2017, 72(12):2179-2198.]
|
| [26] |
[ 郝大江, 张荣. 要素禀赋、集聚效应与经济增长动力转换. 经济学家, 2018(1):41-49.]
|
| [27] |
OECD. OECD Digital Economy Outlook 2017. Paris: OECD Publishing, 2017: 11-13.
|
| [28] |
|
| [29] |
DESI. Digital economy and society index. European Commission, 2018: 1-124.
|
| [30] |
|
| [31] |
|
| [32] |
|
| [33] |
|
| [34] |
|
| [35] |
|
| [36] |
|
| [37] |
[ 顾明. 基于Weaver-Thomas模型的四川省工业战略产业研究. 重庆工商大学学报(自然科学版), 2012, 29(5):35-39.]
|
| [38] |
|
| [39] |
[ 赵媛, 郝丽莎. 我国石油资源空间流动的地域类型分析. 自然资源学报, 2009, 24(1):93-103.]
|
| [40] |
[ 张耀光, 魏东岚, 王国力, 等. 中国海洋经济省际空间差异与海洋经济强省建设. 地理研究, 2005, 24(1):46-56.]
|
/
| 〈 |
|
〉 |

