
蒙古高原草地利用特征及其国别差异
|
乌兰图雅(1967-), 女, 内蒙古库伦旗人, 博士, 教授, 主要从事土地利用与生态安全研究。E-mail: mtuya1967@163.com |
收稿日期: 2020-02-24
要求修回日期: 2020-12-11
网络出版日期: 2021-09-25
基金资助
国家自然科学基金项目(41861024)
版权
Characteristics of grassland utilization in Mongolian Plateauand their differences among countries
Received date: 2020-02-24
Request revised date: 2020-12-11
Online published: 2021-09-25
Supported by
National Natural Science Foundation of China(41861024)
Copyright
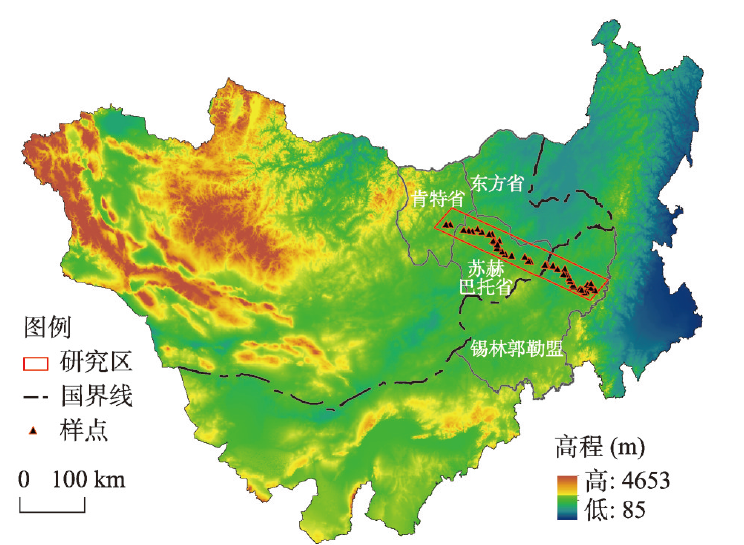
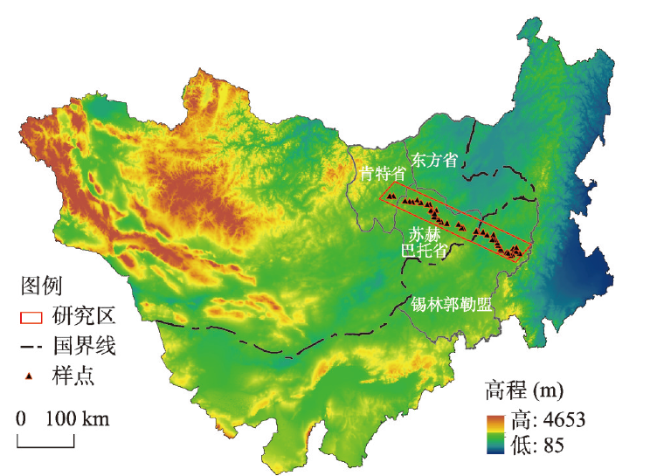
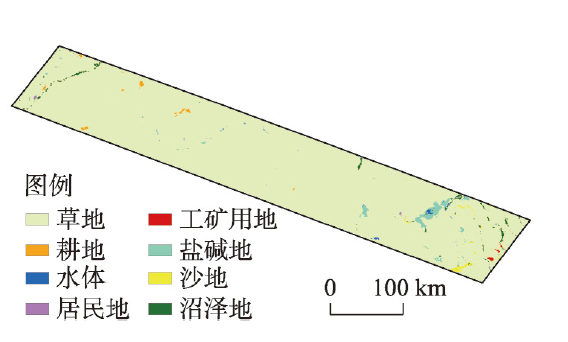
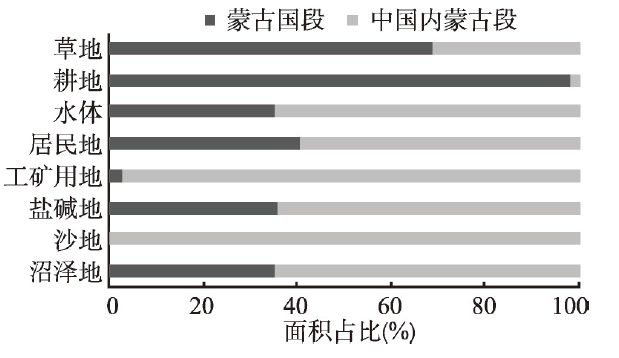
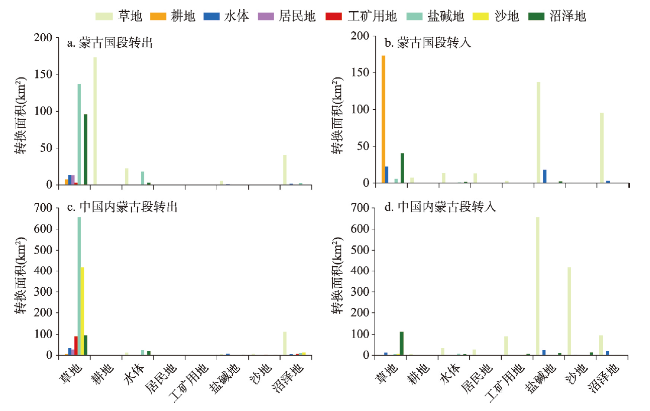
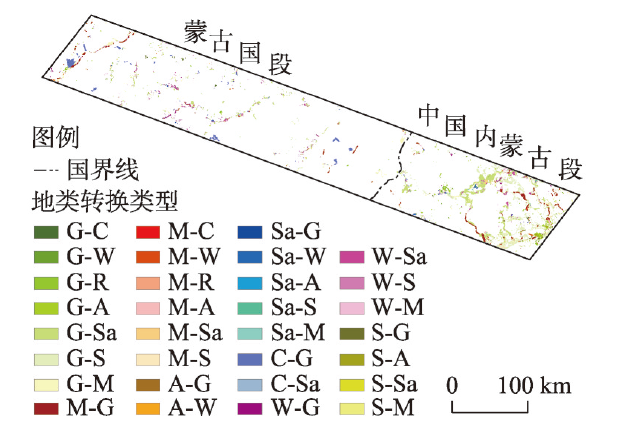
内蒙古草原是蒙古高原草原带的南部组成部分,是我国北方重要的生态屏障,草原生态修复任务重、压力大。本文以蒙古高原典型草原乌珠穆沁—温都尔汗样带为例,以1988—2016年5期TM数据为信息源,获取2016年样带草地利用信息基础上,按国别和年限对样带草地利用特征进行分析,揭示草地主要干扰因素,探寻有效的修复途径和可借鉴的国际经验。研究发现:① 草地面积占样带95.05%,均匀覆盖于整个样带;其他用地类型占比均不大,但分布相对集中,其中耕地集中于样带西北部蒙古国段,工矿用地、沙地、盐碱地集中于样带东南部内蒙古段。② 1988—2016年样带耕地面积减幅最大,为35.71%,集中位于蒙古国段;草地、水域面积逐年减少,在中国境内、境外变化趋势相同,但内蒙古段草地减幅大于蒙古国段且多转为未利用地;工矿用地面积增幅最大,为初期的近367倍,集中分布于内蒙古段;盐碱地、沙地面积逐年增加,在中国境内、境外的变化幅度相当。③ 草地是高原主要土地利用类型,放牧是草地主要利用方式,开矿是除放牧以外中国草地的主要干扰因子,蒙古国则为垦殖,内蒙古的草地干扰远大于蒙古国。草地退化与干旱化是蒙古高原面临的主要生态环境问题,在中国境内尤为突出。
乌兰图雅 . 蒙古高原草地利用特征及其国别差异[J]. 地理学报, 2021 , 76(7) : 1722 -1731 . DOI: 10.11821/dlxb202107011
Located in the southern part of the Mongolian Plateau, the Inner Mongolia grassland is an important ecological barrier in northern China. The ecological restoration is a tough task and poses a great pressure on the grassland. In this paper, we focus on the Ujumqin-Undurhan transect, a typical grassland of the Mongolian Plateau. We used Landsat TM data from 1988 to 2016 which was divided into five periods (of seven years), to reveal the characteristics of grassland utilization in the transect, a transboundary between Mongolia and Inner Mongolia autonomous region of China. In addition, we determined the main disturbance factors of grassland and explored effective restoration mitigation and an international experience for reference. Based on land-use type as of 2016, we found that grassland accounted for 95.05% of the transect, which was evenly distributed across the entire transect. Other land use types accounted for a small proportion, and were relatively concentrated in the localized areas. Among them, cultivated land was concentrated in the Mongolian section in the northwest of the transect, while mining and its industrial area, sandy land, and saline-alkali land were mainly located in the Inner Mongolian section in the southeast of the transect. In the past 30 years, the arable land in the transect decreased the most (35.71%), which was concentrated in the Mongolian section. The area of grassland and water mass suffered a continuous decline with a similar trend both on Chinese and Mongolian sides. However, the decrease in the area of grassland in Inner Mongolia, China was greater than that in Mongolia, and most of them were converted to unused land. The largest increase was found in mining and its industrial area in the transect, nearly 367 times of the initial period, which was concentrated in the Inner Mongolian section. The area of saline-alkali land and sandy land underwent a continuous increase and the changes within the two countries were comparable. Finally, we found the grassland was the predominant land use type on the plateau, which was mainly used for grazing. Mining was the chief disturbance factor of grassland in China, followed by grazing. Meanwhile, the reclamation was the main disturbance factor in Mongolia. The extent of grassland disturbance in Inner Mongolia, China was much greater than that in Mongolia. Overall, grassland degradation and drought were the main ecological and environmental challenges faced by the Mongolian Plateau, especially in Inner Mongolia.
Key words: land use; grassland degradation; country differences; Mongolian Plateau
表1 1988—2016年样带土地利用变化幅度(%)Tab. 1 The ranges of land use change of sample belt from 1988 to 2016 (%) |
| 土地利用类型 | 1988—1995年 | 1995—2002年 | 2002—2009年 | 2009—2016年 | 1988—2016年 |
|---|---|---|---|---|---|
| 草地 | -0.67 | -0.19 | -0.21 | -0.73 | -1.80 |
| 耕地 | -9.75 | -14.18 | -31.06 | 20.40 | -35.71 |
| 水域 | 21.45 | 32.59 | -45.27 | -2.91 | -14.43 |
| 居民地 | 17.30 | 24.45 | 33.06 | 67.98 | 226.28 |
| 工矿用地 | 7.12 | 1005.29 | 790.83 | 248.80 | 36690.50 |
| 盐碱地 | 28.88 | 17.49 | 52.63 | 18.93 | 174.88 |
| 沙地 | 71.72 | 18.64 | 26.82 | 20.40 | 211.07 |
| 沼泽地 | 18.90 | -10.99 | -7.19 | 4.81 | 2.94 |
表2 1988—2016年样带蒙古国段土地利用变化幅度(%)Tab. 2 The ranges of land use change of Mongolian sample belt from 1988 to 2016 (%) |
| 土地利用类型 | 1988—1995年 | 1995—2002年 | 2002—2009年 | 2009—2016年 | 1988—2016年 |
|---|---|---|---|---|---|
| 草地 | -0.08 | 0.01 | 0.08 | -0.07 | -0.06 |
| 耕地 | -12.35 | -12.79 | -31.19 | 19.90 | -36.93 |
| 水域 | -9.45 | -7.50 | 20.61 | -23.61 | -22.83 |
| 居民地 | 18.19 | 21.78 | 7.97 | 48.91 | 131.42 |
| 工矿用地 | 1.19 | 49.19 | 75.29 | 10.40 | 192.13 |
| 盐碱地 | 47.75 | 15.44 | 29.33 | 12.51 | 148.18 |
| 沙地 | -60.77 | 143.20 | 189.42 | 52.95 | 322.37 |
| 沼泽地 | 22.96 | 8.71 | -1.43 | -6.85 | 22.74 |
表3 1988—2016年样带中国内蒙古段土地利用变化幅度(%)Tab. 3 The ranges of land use change of Inner Mongolian sample belt from 1988 to 2016 (%) |
| 土地利用类型 | 1988—1995年 | 1995—2002年 | 2002—2009年 | 2009—2016年 | 1988—2016年 |
|---|---|---|---|---|---|
| 草地 | -1.91 | -0.63 | -0.83 | -2.16 | -5.42 |
| 耕地 | 755.06 | -55.95 | -23.15 | 47.00 | 325.51 |
| 水域 | 44.50 | 51.34 | -64.09 | 16.96 | -8.15 |
| 居民地 | 16.13 | 28.03 | 65.08 | 83.89 | 351.34 |
| 工矿用地 | -15.38 | 624.23 | 1457.73 | 273.81 | 35585.15 |
| 盐碱地 | 23.70 | 18.17 | 60.10 | 20.59 | 182.22 |
| 沙地 | 71.85 | 18.61 | 26.74 | 20.37 | 210.95 |
| 沼泽地 | 17.21 | -19.61 | -10.59 | 12.41 | -5.30 |
表4 1988—2016年样带土地利用转移矩阵(km2)Tab. 4 Land use transition matrix of sample belt from 1988 to 2016 (km2) |
| 土地利用类型 | 草地 | 耕地 | 水体 | 居民地 | 工矿用地 | 盐碱地 | 沙地 | 沼泽地 | 1988年 |
|---|---|---|---|---|---|---|---|---|---|
| 草地 | 12.30 | 45.64 | 39.49 | 93.13 | 794.61 | 420.36 | 189.41 | 1594.94 | |
| 耕地 | 173.78 | 0.03 | 173.81 | ||||||
| 水体 | 35.07 | 42.10 | 2.73 | 21.86 | 101.76 | ||||
| 居民地 | 0.00 | ||||||||
| 工矿用地 | 0.16 | 0.12 | 0.28 | ||||||
| 盐碱地 | 10.02 | 8.95 | 0.06 | 1.31 | 2.34 | 22.67 | |||
| 沙地 | 7.55 | 2.76 | 0.43 | 1.66 | 12.39 | ||||
| 沼泽地 | 153.20 | 0.72 | 5.52 | 0.14 | 6.14 | 11.25 | 14.29 | 191.26 | |
| 2016年 | 379.78 | 13.02 | 60.23 | 39.63 | 102.09 | 848.41 | 438.68 | 215.27 | 2097.11 |
本论文数据处理得到敖敦和昂格力玛的帮助,在此表示感谢!
| [1] |
[ 李秀彬. 全球环境变化研究的核心领域: 土地利用/土地覆被变化的国际研究动向. 地理学报, 1996,51(6):553-558.]
|
| [2] |
|
| [3] |
|
| [4] |
[ 刘纪远, 匡文慧, 张增祥, 等. 20世纪80年代末以来中国土地利用变化的基本特征与空间格局. 地理学报, 2014,69(1):3-14.]
|
| [5] |
|
| [6] |
[ 傅伯杰, 张立伟. 土地利用变化与生态系统服务: 概念、方法与进展. 地理科学进展, 2014,33(4):441-446.]
|
| [7] |
[ 武旭同, 傅伯杰, 王帅. 连接科学与社会: 从第33届国际地理大会看地理学的发展态势. 地理学报, 2016,71(10):1849-1855.]
|
| [8] |
[ 刘钟龄. 蒙古高原景观生态区域的分析. 干旱区资源与环境, 1993,7(3/4):256-261.]
|
| [9] |
[ 李香真, 曲秋皓. 蒙古高原草原土壤微生物量碳氮特征. 土壤学报, 2002,39(1):97-104.]
|
| [10] |
[ 刘纪远, 齐永青, 师华定, 等. 蒙古高原塔里亚特—锡林郭勒样带土壤风蚀速率的137Cs示踪分析. 科学通报, 2007,52(23):2785-2791.]
|
| [11] |
[ 包光, 刘禹, 刘娜, 等. 蒙古高原东部和南部气候要素变化特征及其生态环境影响分析. 地球环境学报, 2013,4(5):1444-1449, 1460.]
|
| [12] |
[ 张艳珍, 王钊齐, 杨悦, 等. 蒙古高原草地退化程度时空分布定量研究. 草业科学, 2018,35(2):233-243.]
|
| [13] |
[ 甄霖, 刘纪远, 刘雪林, 等. 蒙古高原农牧业系统格局变化与影响因素分析. 干旱区资源与环境, 2008,22(1):144-151.]
|
| [14] |
[ 海山. 蒙古高原游牧文化中的环境道德及其现实意义. 中央民族大学学报(哲学社会科学版), 2012,39(5):58-63.]
|
| [15] |
[ 张雪艳, 胡云锋, 庄大方, 等. 蒙古高原NDVI的空间格局及空间分异. 地理研究, 2009,28(1):10-18, 274.]
|
| [16] |
[ 刘帅, 于贵瑞, 浅沼顺, 等. 蒙古高原中部草地土壤冻融过程及土壤含水量分布. 土壤学报, 2009,46(1):46-51.]
|
| [17] |
Batunacun,
[ 巴图娜存, 胡云锋, 毕力格吉夫, 等. 蒙古高原乌兰巴托—锡林浩特草地样带植物物种的空间分布. 自然资源学报, 2015,30(1):24-36.]
|
| [18] |
|
| [19] |
[ 刘兆飞, 王蕊, 姚治君. 蒙古高原气温与降水变化特征及CMIP5气候模式评估. 资源科学, 2016,38(5):956-969.]
|
| [20] |
[ 董昱, 闫慧敏, 杜文鹏, 等. 基于供给-消耗关系的蒙古高原草地承载力时空变化分析. 自然资源学报, 2019,34(5):1093-1107.]
|
| [21] |
|
| [22] |
[ 包刚, 包玉海, 覃志豪, 等. 近10年蒙古高原植被覆盖变化及其对气候的季节响应. 地理科学, 2013,33(5):613-621.]
|
| [23] |
|
| [24] |
[ 缪丽娟, 蒋冲, 何斌, 等. 近10年来蒙古高原植被覆盖变化对气候的响应. 生态学报, 2014,34(5):1295-1301.]
|
| [25] |
[ 胡云锋, 徐芝英. 蒙古高原地形与植被指数的特征尺度及多尺度耦合关系. 地理科学, 2014,34(12):1511-1517.]
|
| [26] |
[ 李一凡, 王卷乐, 祝俊祥. 基于地理分区的蒙古国景观格局分析. 干旱区地理, 2016,39(4):817-827.]
|
| [27] |
[ 刘庆生, 刘高焕, 黄翀, 等. 蒙古高原乌兰巴托—丰镇草地样带植被与土壤属性的空间分布. 资源科学, 2016,38(5):982-993.]
|
| [28] |
|
| [29] |
|
| [30] |
[ 魏云洁, 甄霖, 刘雪林, 等. 1992—2005年蒙古国土地利用变化及其驱动因素. 应用生态学报, 2008,19(9):1995-2002.]
|
| [31] |
|
| [32] |
Batunacun,
|
| [33] |
|
/
| 〈 |
|
〉 |