
基于GEE的中国湖泊浮游植物生物量时空动态分析
|
黄珏(1987-), 女, 湖南韶山人, 副教授, 研究方向为水环境遥感。E-mail: huangjue@sdust.edu.cn |
收稿日期: 2020-06-30
要求修回日期: 2021-04-07
网络出版日期: 2021-09-25
基金资助
国家自然科学基金项目(41706194)
版权
Spatio-temporal dynamic analysis of phytoplankton biomass in Chinese lakes based on Google Earth Engine
Received date: 2020-06-30
Request revised date: 2021-04-07
Online published: 2021-09-25
Supported by
National Natural Science Foundation of China(41706194)
Copyright
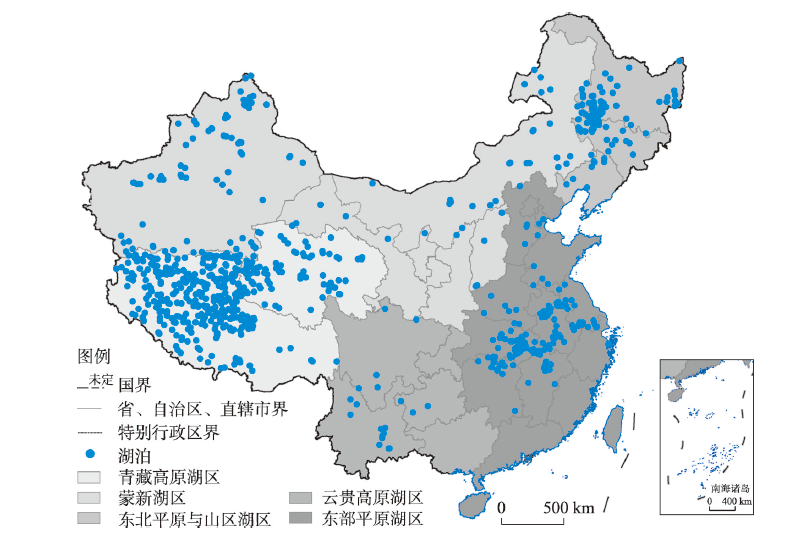
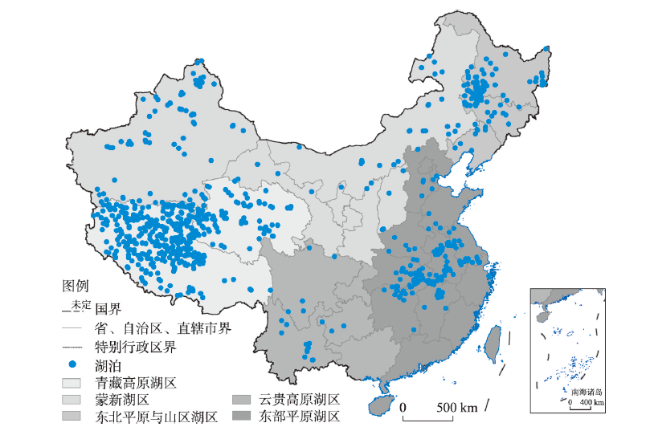
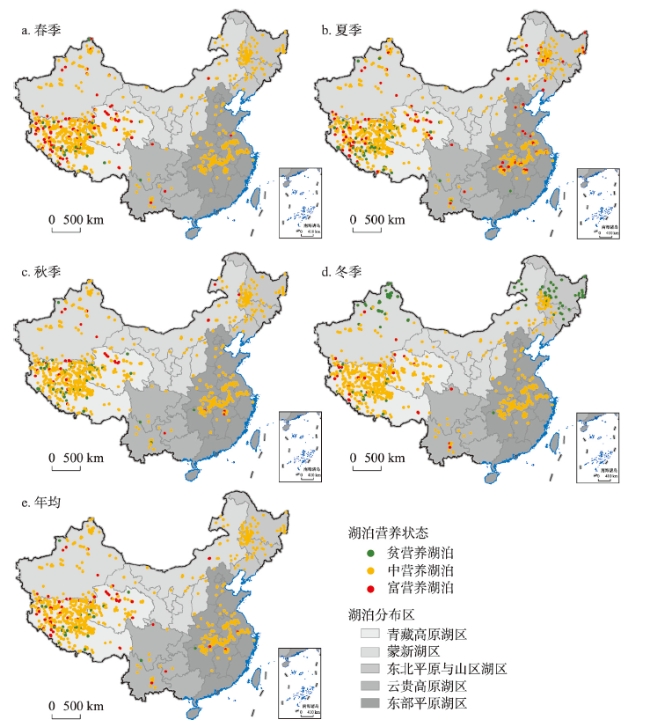
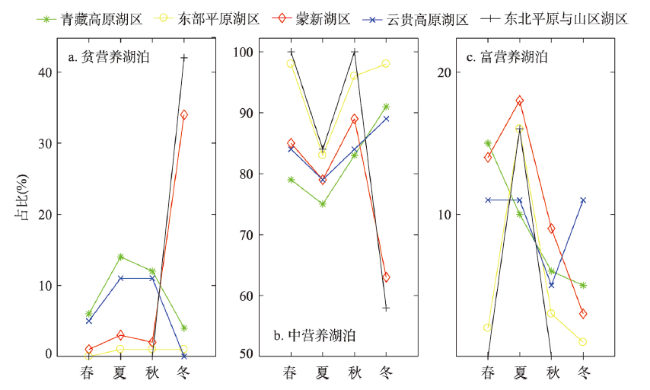
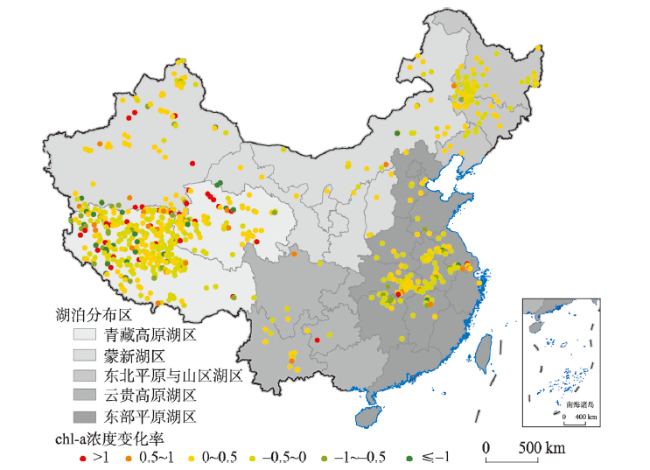
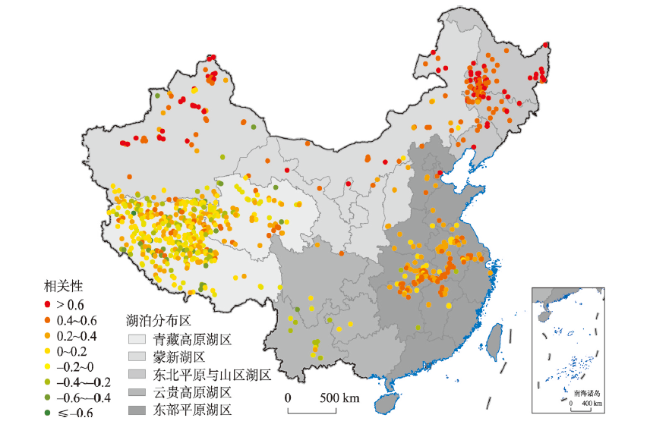
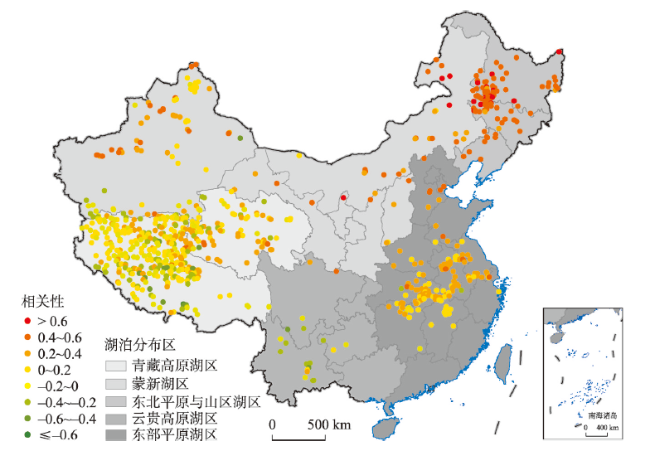
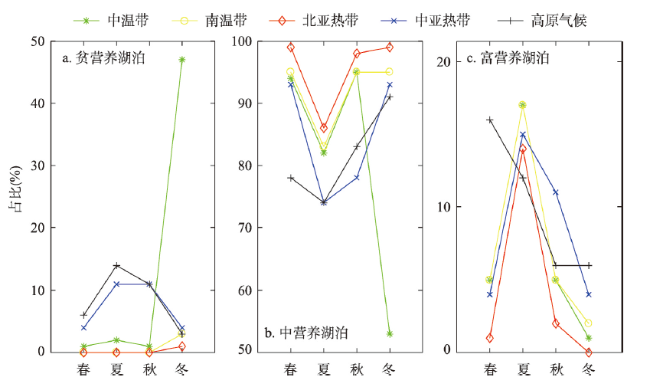
随着全球变暖和社会经济发展,中国湖泊富营养化情况时有发生,迫切需要对中国湖泊的浮游植物生物量进行有效监测。本文选择了中国756个面积超过10 km2的湖泊进行研究,基于Google Earth Engine(GEE)云端运算平台,反演2003—2018年间叶绿素a(chl-a)浓度数据,以此来分析研究各个湖泊的营养状态及其时空变化,探索了中国五大湖区内湖泊各季节与年均chl-a浓度时空分布特征与气象、社会经济及湖泊特征等影响因素之间的关系。结果表明: ① 中国湖泊的营养状态变化具有明显的季节性与地域性,研究时段内处于中营养状态的湖泊约占90%,春季时大多数位于东部平原湖区与东北平原与山区湖区的湖泊表现为贫营养状态,而青藏高原湖区与云贵高原湖区的湖泊在春季多呈现富营养状态。由各个湖泊年均chl-a浓度变化可以看出中国约82%的湖泊年均chl-a浓度的变化率小于0.5,呈现出轻微变化,18%的湖泊chl-a浓度呈现剧烈变化趋势。② 温度和降水对湖表chl-a浓度影响较大,超过70%湖泊的chl-a浓度与其表面温度和降水存在正相关性,其中大部分分布在中国北部与东部。缓冲区人口和草地占比、湖泊海拔和湖泊地理位置也对湖泊浮游植物生物量具有一定影响。
关键词: 叶绿素a浓度; 湖泊营养状态; Google Earth Engine; 中国湖泊; 湖表面温度
黄珏 , 李正茂 , 张珂 , 江涛 . 基于GEE的中国湖泊浮游植物生物量时空动态分析[J]. 地理学报, 2021 , 76(7) : 1693 -1707 . DOI: 10.11821/dlxb202107009
With the impact of global warming and socio-economic development, eutrophication has been observed frequently in Chinese lakes. Therefore, there is an urgent need to monitor the phytoplankton biomass of the lakes. In this paper, 756 lakes with an area more than 10 km2 were selected as research objects. With the help of Google Earth Engine platform, we retrieved the chlorophyll-a (chl-a) concentration from 2003 to 2018, revealed the seasonal and annual nutritional status, and examined the spatio-temporal changes of the lakes. The relationship between spatio-temporal characteristics of lake trophic status and meteorological phenomena, socio-economy and lake features wers analyzed. The main conclusions are as follows: (1) The change of lake trophic states in China has obvious seasonality and regionality. About 90% of lakes were mesotrophic within 15 years of the study. In spring, most lakes in the plain areas of eastern China, the Northeast China Plain and mountain regions were oligotrophic, while in summer, many lakes turned into eutrophication. In comparison, most lakes on the Qinghai-Tibet Plateau and the Yunnan-Guizhou Plateau were eutrophic in spring. The interannual variations in chl-a concentration show that 82% of lakes in China had slight changes in chl-a concentration (the absolute annual rate is <0.5), and the rest showed dramatic variations. (2) The lake surface temperature and precipitation had strong influences on chl-a concentration. For more than 70% of the lakes, the concentration of chl-a had a positive correlation with the lake surface temperature and precipitation, most of which are located in the eastern and northern China. The population in buffer zone, altitude, and geographical location of the lakes also exert influence on the biomass of the phytoplankton.
表1 基于MODIS传感器的OC3M算法参数选择Tab. 1 Parameters of OC3M algorithm based on MODIS |
| 参数名称 | a0 | a1 | a2 | a3 | a4 |
|---|---|---|---|---|---|
| 数值 | 0.2424 | -2.7423 | 1.8017 | 0.0015 | -1.2280 |
表2 中国湖泊影响因素分析(%)Tab. 2 Analysis of influencing factors of lakes in China (%) |
| 全国湖泊 | 影响因素1 | 影响因素2 | 影响因素3 |
|---|---|---|---|
| 年均 | 秋季降水(22) | 草地占比(14) | - |
| 春季 | 秋季降水(41) | 草地占比(15) | 春季降水(10) |
| 夏季 | 夏季湖表温度(30) | 夏季降水(16) | 年均降水(13) |
| 秋季 | 夏季湖表温度(28) | 草地占比(21) | 年均降水(17) |
| 冬季 | 海拔(24) | 经度(21) | 秋季降水(20) |
表3 非青云湖区影响因素分析(%)Tab. 3 Analysis of influencing factors outside Qingyun Lake (%) |
| 非青云湖区 | 影响因素1 | 影响因素2 | 影响因素3 |
|---|---|---|---|
| 年均 | 草地占比(33) | 海拔(19) | 经度(15) |
| 春季 | 人口(23) | 海拔(21) | 冬季降水(18) |
| 夏季 | 草地占比(42) | 经度(14) | 海拔(12) |
| 秋季 | 春季降水(32) | 经度(25) | 海拔(13) |
| 冬季 | 人口(29) | 海拔(19) | 春季湖表温度(16) |
表4 青云湖区影响因素分析(%)Tab. 4 Analysis of influencing factors in Qingyun Lake (%) |
| 青云湖区 | 影响因素1 | 影响因素2 | 影响因素3 |
|---|---|---|---|
| 年均 | 夏季湖表温度(36) | 秋季降水(18) | 年均降水(13) |
| 春季 | 秋季降水(38) | 夏季湖表温度(16) | — |
| 夏季 | 夏季湖表温度(34) | 年均降水(21) | — |
| 秋季 | 夏季湖表温度(54) | 年均降水(13) | 湖泊面积(13) |
| 冬季 | 经度(29) | 夏季湖表温度(16) | 春季湖表温度(14) |
图5 湖表温度与湖泊chl-a浓度的相关关系分布注:基于自然资源部标准地图服务网站GS(2016)1569号的标准地图制作,底图无修改。 Fig. 5 Distribution of correlationship between lake surface temperature and chl-a concentration |
表5 各气候带气象因素对chl-a的影响Tab. 5 Meteorological influences on Chl-a in different climatic zones |
| 气候带 | 气温 | 降水 | 风速 |
|---|---|---|---|
| 中温带 | 0.91 | 0.88 | -0.03 |
| 南温带 | 0.60 | 0.58 | -0.10 |
| 北亚热带 | 0.72 | 0.50 | 0.08 |
| 中亚热带 | 0.38 | 0.29 | -0.27 |
| 南亚热带 | -0.41 | -0.26 | 0.22 |
| 北热带 | -0.30 | -0.23 | -0.05 |
| 高原气候 | 0.38 | 0.30 | 0.42 |
表6 咸水湖与淡水湖chl-a浓度影响因素分析Tab. 6 Analysis of influencing factors of chl-a concentration in saltwater lakes and freshwater lakes |
| 淡水湖 | 咸水湖 | ||||
|---|---|---|---|---|---|
| 相关系数1 | 相关系数2 | 相关系数1 | 相关系数2 | ||
| 春季 | 年均降水0.488 | 冬季降水0.476 | 夏季湖表温度0.557 | 海拔-0.523 | |
| 夏季 | 经度0.593 | 春季湖表温度0.588 | 夏季湖表温度0.537 | 海拔-0.426 | |
| 秋季 | 夏季湖表温度0.651 | 春季湖表温度0.594 | 夏季湖表温度0.678 | 春季湖表温度0.556 | |
| 冬季 | 春季湖表温度0.254 | 夏季湖表温度0.221 | 夏季湖表温度0.551 | 春季湖表温度0.453 | |
| 年均 | 年均降水0.462 | 春季降水0.430 | 夏季湖表温度0.662 | 海拔-0.564 | |
| [1] |
|
| [2] |
[ 闫立娟, 郑绵平, 魏乐军. 近40年来青藏高原湖泊变迁及其对气候变化的响应. 地学前缘, 2016,23(4):310-323.]
|
| [3] |
|
| [4] |
|
| [5] |
|
| [6] |
[ 曹金玲, 许其功, 席北斗, 等. 我国湖泊富营养化效应区域差异性分析. 环境科学, 2012,33(6):1777-1783.]
|
| [7] |
[ 齐凌艳, 黄佳聪, 高俊峰, 等. 洪泽湖叶绿素a浓度的时空变化特征. 湖泊科学, 2016,28(3):583-591.]
|
| [8] |
|
| [9] |
[ 种丹, 李浩杰, 范硕, 等. 基于MODIS数据的云南九大高原湖泊叶绿素a浓度反演. 生态学杂志. 2017,36(1):277-286.]
|
| [10] |
|
| [11] |
[ 吴锋, 战金艳, 邓祥征, 等. 中国湖泊富营养化影响因素研究: 基于中国22个湖泊实证分析. 生态环境学报, 2012,21(1):94-100.]
|
| [12] |
|
| [13] |
|
| [14] |
|
| [15] |
[ 龙爽, 郭正飞, 徐粒, 等. 基于Google Earth Engine 的中国植被覆盖度时空变化特征分析. 遥感技术与应用, 2020,35(2):326-334.]
|
| [16] |
[ 陈黔, 李晓松, 修晓敏, 等. 基于Google Earth Engine 与机器学习的大尺度30 m分辨率沙地灌木覆盖度估算. 生态学报, 2019,39(11):4056-4069.]
|
| [17] |
|
| [18] |
|
| [19] |
[ 陈炜, 黄慧萍, 田亦陈, 等. 基于Google Earth Engine平台的三江源地区生态质量动态监测与分析. 地球信息科学学报, 2019,21(9):1382-1391.]
|
| [20] |
|
| [21] |
[ 李宇宸, 张军, 薛宇飞, 等. 基于Google Earth Engine的中老缅交界区橡胶林分布遥感提取. 农业工程学报, 2020,36(8):174-181.]
|
| [22] |
|
| [23] |
|
| [24] |
|
| [25] |
[ 尹才, 刘淼, 孙凤云, 等. 基于增强回归树的流域非点源污染影响因子分析. 应用生态学报, 2016,27(3):911-919.]
|
| [26] |
[ 陈蕾, 郭熙, 韩逸, 等. 基于BRT模型的南昌市城市扩展时空特征及驱动因素研究. 长江流域资源与环境, 2020,29(2):322-333.]
|
| [27] |
|
| [28] |
[ 马荣华, 杨桂山, 段洪涛, 等. 中国湖泊的数量、面积与空间分布. 中国科学: 地球科学, 2011,41(3):394-401.]
|
| [29] |
[ 王苏民, 窦鸿身. 中国湖泊志. 北京: 科学出版社, 1998: 398-399.]
|
| [30] |
[ 李晓锋, 姚晓军, 孙美平, 等. 2000—2014 年我国西北地区湖泊面积的时空变化. 生态学报, 2018,38(1):96-104.]
|
| [31] |
[ 隆院男, 闫世雄, 蒋昌波, 等. 基于多源遥感影像的洞庭湖地形提取方法. 地理学报, 2019,74(7):1467-1481.]
|
| [32] |
[ 张鑫, 吴艳红, 张鑫. 1972—2012年青藏高原中南部内陆湖泊的水位变化. 地理学报, 2014,69(7):993-1001.]
|
| [33] |
|
| [34] |
|
| [35] |
[ 尹才, 刘淼, 孙凤云, 等. 基于增强回归树的流域非点源污染影响因子分析. 应用生态学报, 2016,27(3):911-919.]
|
| [36] |
[ 焦琳琳, 常禹, 申丹, 等. 利用增强回归树分析中国野火空间分布格局的影响因素. 生态学杂志, 2015,34(8):2288-2296.]
|
| [37] |
[ 李苗, 臧淑英, 吴长山, 等. 哈尔滨市城乡结合部不透水面时空变化及驱动力分析. 地理学报, 2017,72(1):105-115.]
|
| [38] |
|
| [39] |
[ 陈小华, 钱晓雍, 李小平, 等. 洱海富营养化时间演变特征(1988—2013年)及社会经济驱动分析. 湖泊科学, 2018,30(1):70-78.]
|
| [40] |
|
| [41] |
[ 魏耀宏, 林振耀. 青藏与南极气候对比的初步研究//中国青藏高原研究会. 青藏高原与全球变化研讨会论文集, 1994: 119-128.]
|
/
| 〈 |
|
〉 |