
中国东北三省城市收缩的识别及其类型划分
|
孙平军(1981-), 男, 教授, 博士生导师, 主要从事区域发展与城乡规划、经济地理等方面的研究。E-mail: sunpj031@163.com |
收稿日期: 2020-03-12
修回日期: 2020-12-22
网络出版日期: 2021-08-25
基金资助
国家自然科学基金项目(41501173)
西南大学引进人才项目(SWU019020)
版权
Identification and stage division of urban shrinkage in the three provinces of Northeast China
Received date: 2020-03-12
Revised date: 2020-12-22
Online published: 2021-08-25
Supported by
National Natural Science Foundation of China(41501173)
Talent Introduction Project of Southwest University(SWU019020)
Copyright
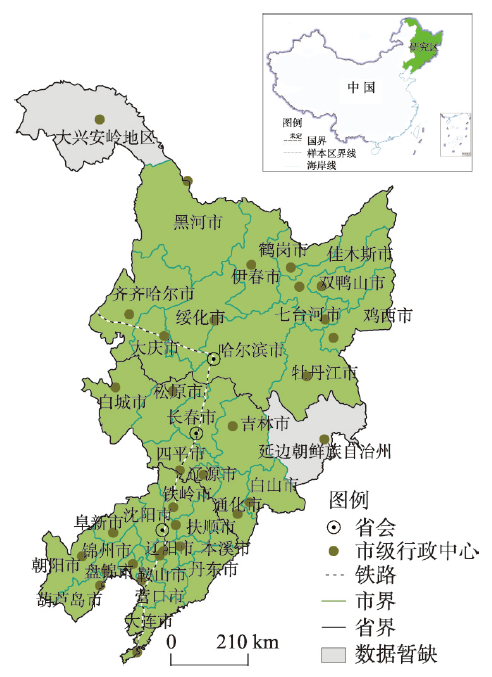
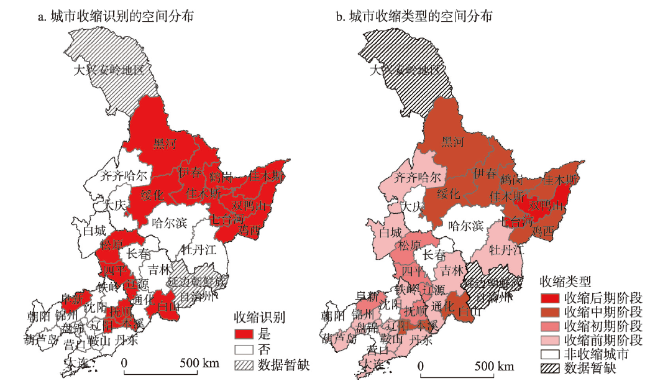
城市收缩是一个受经济全球化影响,并具有区域地方特征的世界性经济社会现象,如何构建快速城镇化进程中“中国化”城市收缩研究理论分析框架,为世界城市收缩研究提供中国经验,是新时期中国地理学者、城市规划工作者亟需重点关注和研究的新命题。本文认为城市收缩本质是城市“发展势能”的相对弱化或绝对退化而引起以人口为核心的经济发展要素的再区位和城市功能形态空间重构的响应过程或状态,其是一个综合概念,一个基于人口变化、经济变化、投资消费变化与财政变化等的多维一体过程,据此构建基于“二步诊断法”的城市收缩识别体系及其类型划分标准,同时针对中国最具典型和代表性的东北三省开展城市收缩的实证分析。结果表明:① 东北三省存在明显的城市收缩现象、且呈现出区域化的发展演化趋势;整体可归纳为资源依赖型收缩城市、“虹吸”型收缩城市、综合型收缩城市及区位制约型收缩城市4种模式,其中资源依赖型收缩城市是主体,占据了整个收缩城市的2/3;② 空间上整体呈现出北高南低的空间格局,与经济发展重心不断南移相呼应;③ 指标维度收缩整体遵循“投资消费与经济下行→人口收缩→财政收缩”的内在演化逻辑关联;④ 立足于“二步诊断法”的城市收缩识别体系及其类型划分标准反映出当前基于人口变化学的识别标准的合理性及其局限性——人口变化学能够在很大程度上识别收缩城市,但是对于划分收缩城市类型、揭示收缩城市内在耦合机理具有一定的局限性;⑤ 实证结果表明“二步诊断法”是合理可行的,其可为中国城市收缩的识别、东北振兴政策的制定提供工具支撑与参考依据。

孙平军 , 王柯文 . 中国东北三省城市收缩的识别及其类型划分[J]. 地理学报, 2021 , 76(6) : 1366 -1379 . DOI: 10.11821/dlxb202106004
Urban shrinkage is a global socio-economic phenomenon embedded in wave of economic globalization and rooted in "localization". And it has become a new proposition for Chinese geographers and urban planners to build a theoretical analysis framework of "Chinese-style" urban shrinkage research in the process of rapid urbanization and to provide Chinese experience for the study of urban shrinkage globally. In this paper, we think the essence of urban shrinkage is a response progress or status that the city's "development potential" is relative weakening or absolute degradation and caused re-location of the population-centric economic development elements and spatial reconstruction of the urban functional forms. It is a comprehensive concept, a multi-dimensional and integrated process based on the changes in population, economy, investment and consumption, and social security. And we establish the identification system and the classification criteria of urban shrinkage types based on the "two-step diagnosis method", and select the three provinces of Northeast China which are the most representative urban shrinkage regions in China to make an empirical analysis. The results show that: (1) There does exist an obvious urban shrinkage phenomenon, and the evolution trend is going to regionalization in the three provinces. And we classify the whole identified shrinkage cities into four categories: resource-dependent shrinking cities, "siphon" shrinking cities, comprehensive shrinking cities and location-constrained shrinking cities. It can be found that the resource-dependent shrinking cities are the main body, occupying 2/3 of the entire shrinking cities. (2) The spatial pattern formed by the identified shrinkage cities shows the characteristics that the number of the shrinkage cities is large in the north and small in the south, which is echoing the situation that the economic center is continuously moving from north to south. (3) From the indicator dimension, it can be found that urban shrinking wholly follows the internal evolutionary and logical connection of "investment and consumption, economic shrinkage→population shrinkage→social security shrinkage". (4) The urban shrinkage identification system and its type classification criteria based on the "two-step diagnostic method" in this paper reflect the rationality and limitations of the current urban shrinkage identification standard based on population shrinkage, although it can identify shrinking cities to a large extent, and have certain limitations in classifying shrinking city types and revealing the internal coupling mechanism of shrinking cities. (5) The empirical results confirm that the "two-step diagnosis method" of urban shrinkage is reasonable and feasible, which can provide tool support and reference basis for the identification of China's urban shrinkage and the formulation of policies for the revitalization of Northeast China.
表1 城市收缩识别指标体系Tab. 1 Identification index system of urban shrinkage |
| 目标层 | 人口维度 | 经济维度 | 财政保障维度 | 投资消费维度 |
|---|---|---|---|---|
| 指标层 | 市辖区常住人口数X1 总医生数X2 总大学生人数X3 | 二三产业就业人数X4 地区GDP总量X5 人均收入水平X6 | 地方财政收入X7 地方财政支出X8 | 全社会固定资产投资X9 房地产开发投资完成额X10 社会消费品零售总额X11 |
表2 城市收缩类型及其划分标准Tab. 2 Types of urban shrinkage and the classification criteria |
| 收缩类型 | 收缩前期阶段城市 | 收缩初期阶段城市 | 收缩中期阶段城市 | 收缩后期阶段城市 | 衰败城市 |
|---|---|---|---|---|---|
| 划分标准 | 3% < X1 < 0 Ai ≤ -10% | -5% < X1 ≤ -3% -15% < Ai ≤ -10% | -10% < X1 ≤ -5% -20% < Ai ≤ -15% | -20% < X1 ≤ -10% -30% < Ai ≤ -20% | X1 ≤ -20% Ai ≤ -30% |
表3 中国东北三省收缩城市识别的计算结果Tab. 3 Identification results of shrinking cities in the three provinces of Northeast China |
| 城市 | 人口下降 起始年份 | 常住人口数 增长率(%) | 第一步 诊断结果 | 综合指标 平均得分(%) | 第二步 诊断结果 | 类型 |
|---|---|---|---|---|---|---|
| 沈阳 | - | - | 否 | -25.46 | 否 | 无 |
| 大连 | 2010—2012 | -1.66 | 否 | -21.55 | 否 | 收缩前期阶段城市 |
| 鞍山 | 2015—2017 | -1.32 | 否 | -32.16 | 否 | 收缩前期阶段城市 |
| 抚顺 | 2011—2017 | -4.70 | 是 | -30.55 | 是 | 收缩初期阶段城市 |
| 本溪 | 2010—2017 | -5.39 | 是 | -32.71 | 是 | 收缩中期阶段城市 |
| 丹东 | 2013—2016 | -0.64 | 否 | -45.13 | 否 | 收缩前期阶段城市 |
| 锦州 | 2013—2015 | -2.76 | 否 | -23.20 | 否 | 收缩前期阶段城市 |
| 营口 | - | - | 否 | -24.35 | 否 | 无 |
| 阜新 | 2010—2017 | -4.92 | 是 | -35.84 | 是 | 收缩初期阶段城市 |
| 辽阳 | 2013—2017 | -1.15 | 否 | -24.45 | 否 | 收缩前期阶段城市 |
| 盘锦 | - | - | 否 | -13.35 | 否 | 无 |
| 铁岭 | 2010—2016 | -1.55 | 否 | -47.85 | 否 | 收缩前期阶段城市 |
| 朝阳 | - | - | 否 | -28.32 | 否 | 无 |
| 葫芦岛 | 2010—2016 | -2.03 | 否 | -25.48 | 否 | 收缩前期阶段城市 |
| 长春 | - | - | 否 | -2.17 | 否 | 无 |
| 吉林 | 2010—2013、2015—2017 | -0.91 | 否 | -7.31 | 否 | 收缩前期阶段城市 |
| 四平 | 2010—2016 | -3.91 | 是 | -27.03 | 是 | 收缩初期阶段城市 |
| 辽源 | 2010—2012、2014—2017 | -4.66 | 是 | -13.12 | 是 | 收缩初期阶段城市 |
| 通化 | 2010—2013 | -1.03 | 否 | -16.69 | 否 | 收缩前期阶段城市 |
| 白山 | 2011—2017 | -8.94 | 是 | -28.32 | 是 | 收缩中期阶段城市 |
| 松原 | 2011—2014、2015—2017 | -4.69 | 是 | -23.16 | 是 | 收缩初期阶段城市 |
| 白城 | 2011—2017 | -1.61 | 否 | -13.62 | 否 | 收缩前期阶段城市 |
| 哈尔滨 | - | - | 否 | -11.06 | 否 | 无 |
| 齐齐哈尔 | 2010—2017 | -2.19 | 否 | -29.22 | 否 | 收缩前期阶段城市 |
| 鸡西 | 2010—2017 | -8.99 | 是 | -21.84 | 是 | 收缩中期阶段城市 |
| 鹤岗 | 2012—2017 | -7.88 | 是 | -39.49 | 是 | 收缩中期阶段城市 |
| 双鸭山 | 2013—2017 | -11.11 | 是 | -37.02 | 是 | 收缩后期阶段城市 |
| 大庆 | - | - | 否 | -30.27 | 否 | 无 |
| 伊春 | 2011—2017 | -7.85 | 是 | -22.38 | 是 | 收缩中期阶段城市 |
| 佳木斯 | 2010—2017 | -6.10 | 是 | -19.96 | 是 | 收缩中期阶段城市 |
| 七台河 | 2012—2017 | -15.94 | 是 | -31.52 | 是 | 收缩后期阶段城市 |
| 牡丹江 | 2013—2017 | -2.25 | 否 | -14.57 | 否 | 收缩前期阶段城市 |
| 黑河 | 2013—2017 | -9.52 | 是 | -35.77 | 是 | 收缩中期阶段城市 |
| 绥化 | 2010—2017 | -8.82 | 是 | -19.10 | 是 | 收缩中期阶段城市 |
注:人口下降起始年份文中仅列举常住人口数连续3年及以上出现下降的年份和城市,没有的用“-”表示。 |
表4 中国东北三省城市属性及收缩类型划分Tab. 4 Classification of urban attributes and shrinkage types in the three provinces of Northeast China |
| 省份 | 城市 | 城市性质 | 收缩类型 | 省份 | 城市 | 城市性质 | 收缩类型 |
|---|---|---|---|---|---|---|---|
| 辽 宁 省 | 沈阳 | 省会核心城市 | 无 | 辽源 | 资源枯竭型城市 | 收缩初期阶段 | |
| 大连 | 副省级核心城市 | 收缩前期阶段 | 通化 | 一般内陆城市 | 收缩前期阶段 | ||
| 鞍山 | 资源中后期型城市 | 收缩前期阶段 | 白山 | 资源中后期型城市 | 收缩中期阶段 | ||
| 抚顺 | 资源枯竭型城市 | 收缩初期阶段 | 松原 | 长春、大庆“虹吸”范围城市、资源后期型城市 | 收缩初期阶段 | ||
| 本溪 | 资源后期型城市 | 收缩中期阶段 | 黑 龙 江 省 | 哈尔滨 | 省会核心城市 | 无 | |
| 丹东 | 港口城市 | 收缩前期阶段 | 齐齐哈尔 | 大庆“虹吸”范围城市 | 收缩前期阶段 | ||
| 锦州 | 港口城市 | 收缩前期阶段 | 鸡西 | 资源型枯竭型城市 | 收缩中期阶段 | ||
| 营口 | 港口城市 | 无 | 鹤岗 | 资源型枯竭型城市 | 收缩中期阶段 | ||
| 阜新 | 资源枯竭型城市 | 收缩初期阶段 | 双鸭山 | 资源型枯竭型城市 | 收缩后期阶段 | ||
| 辽阳 | 一般内陆城市 | 收缩前期阶段 | 大庆 | 省区域中心资源型城市 | 无 | ||
| 盘锦 | 资源枯竭港口城市 | 无 | 伊春 | 资源枯竭型城市 | 收缩中期阶段 | ||
| 铁岭 | 一般内陆城市 | 收缩前期阶段 | 佳木斯 | 哈尔滨“虹吸”范围城市 | 收缩中期阶段 | ||
| 朝阳 | 跨域交通枢纽城市 | 无 | 七台河 | 牡丹江“虹吸”范围城市资源型城市 | 收缩后期阶段 | ||
| 葫芦岛 | 港口城市 | 收缩前期阶段 | 牡丹江 | 一般内陆城市 | 收缩前期阶段 | ||
| 长春 | 省会核心城市 | 无 | 黑河 | 边境边远城市 | 收缩中期阶段 | ||
| 吉林省 | 吉林 | 重化工内陆城市 | 收缩前期阶段 | 绥化 | 哈尔滨、大庆“虹吸”范围城市 | 收缩中期阶段 | |
| 四平 | 长春“虹吸”范围城市 | 收缩初期阶段 |
表5 东北三省城市收缩主导因素类型划分Tab. 5 Type classification of dominant factors for urban shrinkage in the three provinces of Northeast China |
| 城市 | 指标维度收缩先后顺序 | 收缩类型Ⅰ | 主导收缩指标(%) | 收缩类型Ⅱ |
|---|---|---|---|---|
| 抚顺 | 投资消费—经济—财政保障—人口 | 投资消费导向 | X9 (-83.01) | 投资消费导向 |
| 本溪 | 人口—投资消费—经济—财政保障 | 人才流失导向 | X10 (-73.26) | 投资消费导向 |
| 阜新 | 人口—投资消费—经济—财政保障 | 人才流失导向 | X9 (-90.05) | 投资消费导向 |
| 四平 | 投资消费—人口—经济 | 投资消费导向 | X10 (-87.07) | 投资消费导向 |
| 辽源 | 人口—投资消费—财政保障 | 人才流失导向 | X10 (-68.10) | 投资消费导向 |
| 白山 | 人口—投资消费—财政保障 | 人才流失导向 | X10 (-82.84) | 投资消费导向 |
| 松原 | 人口—经济—财政保障—投资消费 | 人口流失导向 | X10 (-98.42) | 投资消费导向 |
| 鸡西 | 经济—投资消费—人口—财政保障 | 经济下行导向 | X3 (-82.03) | 人才流失导向 |
| 鹤岗 | 经济—投资消费—人口—财政保障 | 经济下行导向 | X10 (-76.83) | 投资消费导向 |
| 双鸭山 | 经济—投资消费—财政保障—人口 | 经济下行导向 | X10 (-91.05) | 投资消费导向 |
| 伊春 | 人口—经济—投资消费—财政保障 | 人才流失导向 | X9 (-68.17) | 投资消费导向 |
| 佳木斯 | 人口—经济—财政保障—投资消费 | 人口流失导向 | X4 (-49.90) | 失业导向 |
| 七台河 | 经济—投资消费—人口—财政保障 | 经济下行导向 | X10 (-82.94) | 投资消费导向 |
| 黑河 | 经济—投资消费—人口—财政保障 | 经济下行导向 | X4 (-82.71) | 失业导向 |
| 绥化 | 投资消费—经济—人口—财政保障 | 投资消费导向 | X4 (-86.50) | 失业导向 |
真诚感谢评审专家的修改意见,获益匪浅;感谢东北大学修春亮教授提供的帮助与指导。
| [1] |
[ 吴康, 孙东琪. 城市收缩的研究进展与展望. 经济地理, 2017,37(11):59-67.]
|
| [2] |
|
| [3] |
|
| [4] |
|
| [5] |
|
| [6] |
|
| [7] |
|
| [8] |
|
| [9] |
[ 张莉. 增长的城市与收缩的区域: 我国中西部地区人口空间重构: 以四川省与河南省信阳市为例. 城市发展研究, 2015,22(9):74-80.]
|
| [10] |
[ 龙瀛, 吴康, 王江浩. 中国收缩城市及其研究框架. 现代城市研究, 2015,30(9):14-19.]
|
| [11] |
[ 李郇, 杜志威, 李先锋. 珠江三角洲城镇收缩的空间分布与机制. 现代城市研究, 2015,30(9):36-43.]
|
| [12] |
[ 杜志威, 李郇. 珠三角快速城镇化地区发展的增长与收缩新现象. 地理学报, 2017,72(10):1800-1811.]
|
| [13] |
[ 戚伟, 刘盛和, 金凤君. 东北三省人口流失的测算及演化格局研究. 地理科学, 2017,37(12):1795-1804.]
|
| [14] |
[ 张京祥, 冯灿芳, 陈浩. 城市收缩的国际研究与中国本土化探索. 国际城市规划, 2017,32(5):1-9.]
|
| [15] |
[ 李郇, 吴康, 龙瀛, 等. 局部收缩:后增长时代下的城市可持续发展争鸣. 地理研究, 2017,36(10):1997-2016.]
|
| [16] |
|
| [17] |
[ 杨东峰, 龙瀛, 杨文诗, 等. 人口流失与空间扩张: 中国快速城市化进程中的城市收缩悖论. 现代城市研究, 2015,30(9):20-25.]
|
| [18] |
|
| [19] |
|
| [20] |
|
| [21] |
|
| [22] |
|
| [23] |
|
| [24] |
[ 高舒琦. 收缩城市研究综述. 城市规划学刊, 2015(3):44-49.]
|
| [25] |
|
| [26] |
[ 郭源园, 李莉. 中国收缩城市及其发展的负外部性. 地理科学, 2019,39(1):52-60.]
|
| [27] |
|
| [28] |
|
| [29] |
[ 何鹤鸣, 张京祥, 耿磊. 调整型“穿孔”: 开发区转型中的局部收缩: 基于常州高新区黄河路两侧地区的实证. 城市规划, 2018,42(5):47-55.]
|
| [30] |
[ 姚瑶. 东北地区传统工业城市收缩的规划应对//中国城市科学研究会, 郑州市人民政府, 河南省自然资源厅, 河南省住房和城乡建设厅. 2019中国城市发展与规划论文集. 北京: 中国城市出版社, 2019: 685-689.]
|
| [31] |
[ 高舒琦, 龙瀛. 东北地区收缩城市的识别分析及规划应对. 规划师, 2017,33(1):26-32.]
|
| [32] |
[ 陈川, 罗震东, 何鹤鸣. 小城镇收缩的机制与对策研究进展及展望. 现代城市研究, 2016,31(2):23-28, 98.]
|
| [33] |
|
| [34] |
[ 张贝贝, 李志刚. “收缩城市”研究的国际进展与启示. 城市规划, 2017,41(10):103-108, 121.]
|
| [35] |
[ 马佐澎, 李诚固, 张婧, 等. 发达国家城市收缩现象及其对中国的启示. 人文地理, 2016,31(2):13-17.]
|
| [36] |
[ 毛其智, 龙瀛, 吴康. 中国人口密度的时空演变与城镇化空间格局初探: 从2000年到2010年. 城市规划, 2015,39(2):38-43.]
|
| [37] |
[ 林雄斌, 杨家文, 张衔春, 等. 我国城市收缩测度与影响因素分析: 基于人口与经济变化的视角. 人文地理, 2017,32(1):82-89.]
|
| [38] |
|
| [39] |
|
| [40] |
[ 朱春全. 生态位理论及其在森林生态学研究中的应用. 生态学杂志, 1993(4):41-46.]
|
| [41] |
[ 梁发超, 刘诗苑, 刘黎明. 基于“居住场势”理论的乡村聚落景观空间重构: 以厦门市灌口镇为例. 经济地理, 2017,37(3):193-200.]
|
| [42] |
[ 曲衍波, 张凤荣, 姜广辉, 等. 基于生态位的农村居民点用地适宜性评价与分区调控. 农业工程学报, 2010,26(11):290-296.]
|
| [43] |
[ 孙平军, 修春亮, 丁四保, 等. 东北地区域发展的非均衡性与空间极化研究. 地理科学进展, 2011,30(6):715-723.]
|
| [44] |
[ 孙平军, 修春亮. 基于PSE模型的矿业城市经济发展脆弱性研究. 地理研究, 2011,30(2):301-310.]
|
/
| 〈 |
|
〉 |