
咸海流域社会经济用水分析与预测
|
刘爽(1994-), 女, 江苏沭阳人, 硕士生, 主要从事社会经济用水分析、遥感与GIS应用研究。E-mail: liushuang174@mails.ucas.ac.cn |
收稿日期: 2019-06-05
要求修回日期: 2020-11-16
网络出版日期: 2021-07-25
基金资助
中国科学院战略性先导科技专项(XDA20060302)
国家自然科学基金项目(U1803243)
版权
Analysis and prediction of socio-economic water use in the Aral Sea Basin
Received date: 2019-06-05
Request revised date: 2020-11-16
Online published: 2021-07-25
Supported by
Strategic Priority Research Program of the Chinese Academy of Sciences(XDA20060302)
National Natural Science Foundation of China(U1803243)
Copyright
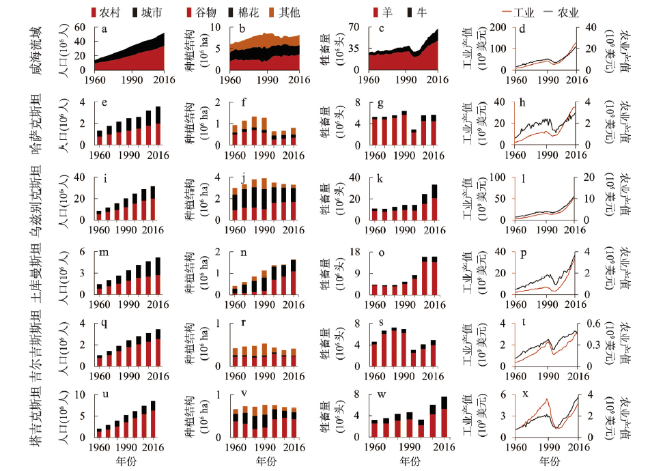
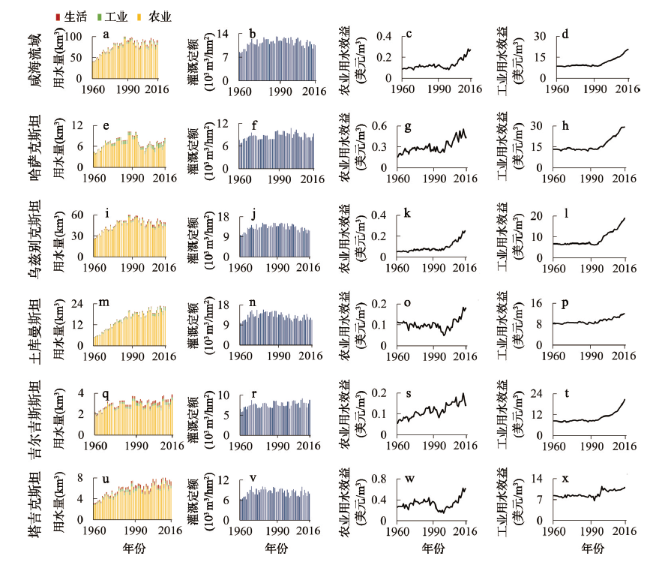
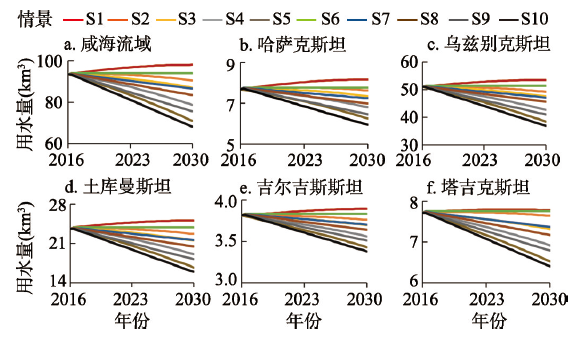
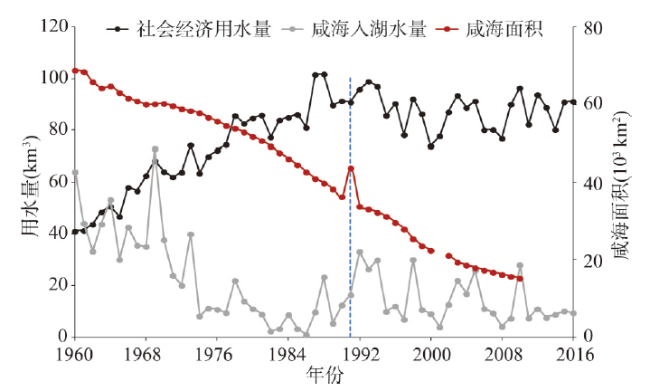
1960年以来咸海流域大规模的水土资源开发使得社会经济用水激增,致使至1990年咸海面积萎缩50%,引发咸海生态危机。目前对引起咸海生态危机的社会经济用水的时空变化特征和趋势尚不清楚。本文在整合了多途径获取的1960—2016年咸海流域国家/州级水资源和社会经济数据的基础上,利用系统动力学模型,仿真模拟和分析了1960—2016年咸海流域社会经济和用水时空变化特征,并多情景预测2016—2030年咸海流域社会经济用水。1960—2016年咸海流域人口增幅267%,GDP增幅1100%,社会经济用水量从410亿m3增长至910亿m3。咸海流域的工农业用水效益在1991年苏联解体后明显增加,但仍处于较低水平。对未来的情景预测表明:若延续现有社会经济用水效率、农作物种植面积持续扩张(S1),至2030年咸海流域社会经济用水量达到962亿m3;而在滴灌普及率达到70%、种植面积不变的情景下(S10),社会经济用水量降至681亿m3,可有效缓解咸海危机。
刘爽 , 白洁 , 罗格平 , 吕娜娜 , 吴淼 . 咸海流域社会经济用水分析与预测[J]. 地理学报, 2021 , 76(5) : 1257 -1273 . DOI: 10.11821/dlxb202105016
Since 1960, water and land resource development in the Aral Sea Basin has led to a surge in socio-economic water consumption and resulted in about 50% shrinkage of the Aral Sea until 1990, which is also known as the Aral Sea Crisis. However, the spatial and temporal changes in socio-economic water consumption are still unclear. Based on the multi-source acquisition of Aral Sea Basin national/state water resource and socio-economic data during 1960-2016, this paper used the system dynamics model to simulate and analyze the characteristics of the socio-economic and water use changes in the Aral Sea Basin and forecasted the socio-economic water use in 2016-2030 under multi-scenarios. The population and GDP in the Aral Sea Basin increased rapidly, by 267% and 1100% respectively, during the study period. The socio-economic water consumption increased from 41 km3 in 1960 to 91 km3 in 2016. The socio-economic water consumption of Kazakhstan and Uzbekistan increased rapidly before the collapse of the Soviet Union, and decreased afterwards. The socio-economic water consumption in Turkmenistan and Tajikistan continued to grow in the past 60 years. The benefits of industrial and agricultural water use in the basin increased significantly after the collapse of the Soviet Union, but remained at a relatively low level. The future forecasts show that if the existing socio-economic water use efficiency and cropland continue to increase (S1), the socio-economic water consumption in the Aral Sea Basin will reach 96.2 km3 by 2030. Under the S10 scenario that the drip irrigation penetration rate reaches 70% and the cropland remains unchanged, the socio-economic water consumption will drop to 68.1 km 3, which can effectively alleviate the crisis in the study area.
Key words: Aral Sea Basin; water resources; socio-economic water; system dynamics
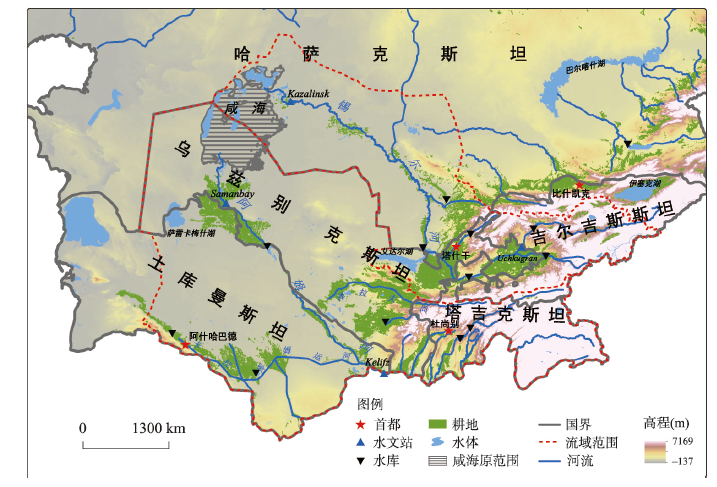
表1 中亚5国在咸海流域的空间分布和面积构成Tab. 1 Spatial distribution and area composition of five Central Asian countries in the Aral Sea Basin |
| 子流域 | 国家 | 面积(104 km2) | 流域占比(%) | 州名 |
|---|---|---|---|---|
| 锡尔河 | 吉尔吉斯斯坦 | 12.5 | 22.7 | 巴特肯州、奥什州、贾拉拉巴德州、纳伦州 |
| 乌兹别克斯坦 | 6.1 | 11.1 | 安集延州、纳曼干州、费尔干纳州、塔什干州、锡尔河州、吉扎克州 | |
| 塔吉克斯坦 | 2.5 | 4.5 | 粟特州 | |
| 哈萨克斯坦 | 34.0 | 61.7 | 南哈萨克斯坦州、克孜勒奥尔达州 | |
| 阿姆河 | 塔吉克斯坦 | 11.7 | 13.5 | 国家直辖区、哈特隆州、山地—巴达赫尚自治州 |
| 乌兹别克斯坦 | 39.8 | 46.0 | 卡拉克帕克共和国、花剌子模州、纳沃伊州、布哈拉州、撒马尔罕州、卡什卡河州、苏尔汉河州 | |
| 土库曼斯坦 | 35.1 | 40.5 | 达绍古兹州、阿哈尔州、马雷州、列巴普州 |
表2 咸海流域社会经济用水SD建模所用数据Tab. 2 Data used in the SD modeling of socio-economic water use in the Aral Sea Basin |
| 数据类型 | 数据项 | 数据名称 | 空间尺度 | 年份 | 数据来源/方法 |
|---|---|---|---|---|---|
| 地图 | 苏联解体前地图 | 国家/ 州界 | 1990 | 苏联社会主义共和国地图集a | |
| 中亚5国行政区划数据 | 2010 | 世界分国地图 | |||
| 社会经济数据 | 产值 | GDP | 国家 | 1960—1964 | 依据1965—2013年数据线性趋势外推 |
| 1965—2013 | Agricultural Statistical Database of Transition Countries | ||||
| 2014—2016 | 世界银行 | ||||
| 农业产值 | 国家 | 1960—1964 | 依据1965—2013年数据线性趋势外推 | ||
| 1965—2013 | Agricultural Statistical Database of Transition Countries | ||||
| 2014—2016 | 世界银行 | ||||
| 工业产值 | 国家 | 1960—2016 | GDP与农业产值之差 | ||
| 人口 | 城市人口、农村人口 | 分州 | 1960—1979 | 苏联社会主义共和国统计年鉴 | |
| 1980—1990 | 独联体统计委员会 | ||||
| 1991—2016 | 中亚5国统计年鉴b、统计局网站c | ||||
| 种植结构 | 谷物、棉花、饲料、其他作物 面积 | 分州 | 1960—1987 | 苏联社会主义共和国统计年鉴d | |
| 1988—1990 | 独联体统计委员会e | ||||
| 1991—2016 | 中亚5国统计年鉴b、统计局网站c | ||||
| 果园面积 | 国家 | 1960—1987 | 苏联社会主义共和国统计年鉴d | ||
| 1988—1990 | 独联体统计委员会e | ||||
| 1991—2016 | 中亚5国统计年鉴b、统计局网站c | ||||
| 牲畜量 | 牛、羊头数 | 分州 | 1960—1987 | 苏联社会主义共和国统计年鉴d | |
| 1988—1990 | 依据1987、1991年数据线性插值 | ||||
| 1991—2016 | 中亚5国统计年鉴b、统计局网站c | ||||
| 水资源 数据 | 用水量 | 工业、农业、生活用水量 | 国家 | 1980—2016 | ICWC |
| 灌溉定额 | 文献[28,29,30,31] | ||||
| 灌溉面积 | 国家 | 1962、1966—1980 | 文献[32] | ||
| 1992—2008 | ICWC | ||||
| 水利工程 | 水库面积、库容 | ICWC | |||
| 径流量 | 阿姆河、锡尔河径流量 | 1960—2016 | ICWC | ||
| 入湖水量 | 阿姆河、锡尔河入湖水量 | 1960—2016 | 水文站f |
注:a. 《苏联社会主义共和国地图集》由中国科学院新疆分院文献信息中心提供;b. 《哈萨克斯坦统计年鉴》(2005、2012)、《乌兹别克斯坦统计年鉴》(2013)、《塔吉克斯坦统计年鉴》(2016);c. 哈萨克斯坦国家统计局网站(http://stat.gov.kz)、吉尔吉斯斯坦国家统计局统计网站(http://www.stat.kg)、乌兹别克斯坦国家统计局统计网站(https://stat.uz/uz); d. 苏联1960—1987年逐年发布的《国民经济统计年鉴》由中国科学院新疆分院文献信息中心提供;e. 独联体统计委员会建立的官方数据库(The Database Official Statistics of the Countries of the Commonwealth of Independent States)以CD形式发布的年统计数据;f. Kelifz水文站位于阿姆河流域喷赤河和瓦赫什河汇流处(http://www.cawater-info.net/water_quality_in_ca/amu_e.htm)、Uchkugran水文站位于锡尔河流域纳伦河和卡拉河汇流处(http://www.cawater-info.net/water_quality_in_ca/syr_e.htm),1960—2016年阿姆河入湖水量来自乌兹别克斯坦水文局提供的该河流下游三角洲的Samanbay站数据,1960—2000年锡尔河入湖水量来自该河流下游三角洲的Kazalinsk站的文献数据[33,34],2001—2016年入湖水量来自ICWC每年发布的公告(http://www.icwc-aral.uz/icwc_bulletins.htm)。 |
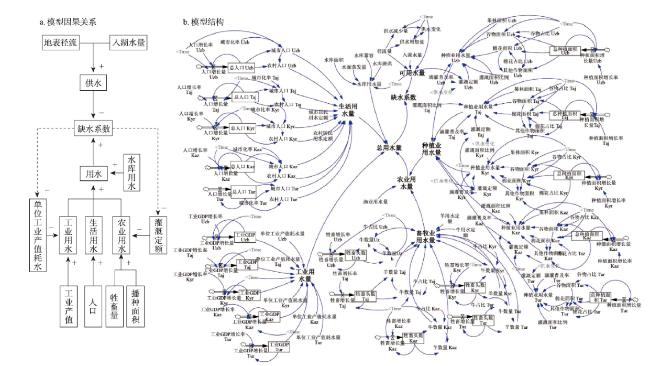
表3 SD模型主要参数及方程Tab. 3 Main parameters and equations in the SD model |
| 变量 | 单位 | 方程 |
|---|---|---|
| 人口 | 千人 | 人口=INTEG(人口增长量, 人口初始值) |
| 人口增长量 | 千人 | 人口增长量=人口×人口增长率/1000 |
| 生活用水量 | 106 m3 | 生活用水量=(农村人口×农村居民用水定额+城市人口×城市居民用水定额)/1000 |
| 工业产值 | 106 美元 | 工业产值=INTEG(工业产值增长量, 工业产值初始值) |
| 工业用水量 | 106 m3 | 工业用水量=工业产值×单位工业产值耗水量/1000 |
| 牲畜头数 | 千头 | 牲畜头数=INTEG(牲畜增长量, 牲畜初始值) |
| 畜牧业用水量 | 106 m3 | 畜牧业用水量=(牛数量×牛用水定额+羊数量×羊用水定额)/1000 |
| 灌溉面积 | 103 hm2 | 灌溉面积=INTEG(灌溉面积增长量, 灌溉面积初始值) |
| 种植业用水量 | 106 m3 | 种植业用水量=[(谷物面积+果林面积+其他农作物面积)×灌溉面积比例×灌溉定额+棉花面积×灌溉定额×1.2]/1000 |
| 灌溉量 | m3 | 灌溉量=(每公顷灌溉量+供水变化量)×灌溉系数 |
| 水库用水量 | 106 m3 | 水库用水量=水库面积×蒸发量+水库蓄容量+水库泄洪量 |
| 可用水量 | 106 m3 | 可用水量=径流量-入湖水量 |
| 缺水系数 | % | 缺水系数=总用水量/供水量×100% |
表4 单位工业产值耗水量计算(m3/千美元)Tab. 4 Calculation of water consumption per unit of the industrial output value (m3/103 USD) |
| 国家 | 单位工业产值耗水量拟合函数 | 判定系数 |
|---|---|---|
| 哈萨克斯坦 | y = -97.85 ln(x-1959)+428.32 | R2 = 0.93 |
| 吉尔吉斯斯坦 | y = -313.6 ln(x-1959)+1269.5 | R2 = 0.98 |
| 塔吉克斯坦 | y = -115.1 ln(x-1959)+534.63 | R2 = 0.92 |
| 土库曼斯坦 | y = -174.8 ln(x-1959)+792.07 | R2 = 0.95 |
| 乌兹别克斯坦 | y = -99.06 ln(x-1959)+412.61 | R2 = 0.97 |
表5 咸海流域灌溉面积比例Tab. 5 Irrigation area ratio in the Aral Sea Basin |
| 国家 | 种植面积(103 hm2) | 灌溉面积(103 hm2) | 灌溉面积比例 | ||||||||
|---|---|---|---|---|---|---|---|---|---|---|---|
| 1960 | 2000 | 2010 | 1962 | 2000 | 2010 | 1960 | 2000 | 2010 | |||
| 哈萨克斯坦 | 28561 | 16195 | 21438 | 1145 | 3556 | 3556 | 0.04 | 0.22 | 0.17 | ||
| 哈国咸海流域部分 | 951 | 701 | 858 | 0.80 | 0.90 | 1.00 | |||||
| 吉尔吉斯斯坦 | 1196 | 1212 | 1146 | 875 | 978 | 978 | 0.73 | 0.81 | 0.85 | ||
| 塔吉克斯坦 | 724 | 864 | 839 | 418 | 719 | 722 | 0.58 | 0.83 | 0.86 | ||
| 土库曼斯坦 | 446 | 1484 | 1561 | 450 | 1800 | 1800 | 1.00 | 1.00 | 1.00 | ||
| 乌兹别克斯坦 | 3149 | 3778 | 3708 | 2568 | 4223 | 4223 | 0.82 | 1.00 | 1.00 | ||
表6 咸海流域各国社会经济用水系统预测情景及参数Tab. 6 Forecast scenarios and parameters of the socio-economic water use system in the Aral Sea Basin |
| 情景参数 | 哈萨克斯坦 | 吉尔吉斯斯坦 | 塔吉克斯坦 | 土库曼斯坦 | 乌兹别克斯坦 | ||||||||||
|---|---|---|---|---|---|---|---|---|---|---|---|---|---|---|---|
| 2016 | 2030 | 2016 | 2030 | 2016 | 2030 | 2016 | 2030 | 2016 | 2030 | ||||||
| 人口增长率(‰) | 13 | 7 | 15 | 9 | 22 | 15 | 17 | 10 | 15 | 8 | |||||
| GDP增长率(%) | 1.1 | 4.4 | 3.8 | 3.5 | 6.9 | 5.0 | 6.2 | 6.2 | 7.8 | 5.5 | |||||
| 农作物种植面积增长率(%) | 0.7 | 0.7 | 0.6 | 0.6 | 0.6 | 0.6 | 1 | 1 | 1 | 1 | |||||
| 滴灌普及率(%) | S1 | 0 | 0 | 0 | 0 | 0 | 0 | 0 | 0 | 0 | 0 | ||||
| S2 | 0 | 20 | 0 | 10 | 0 | 10 | 0 | 20 | 0 | 20 | |||||
| S3 | 0 | 30 | 0 | 20 | 0 | 20 | 0 | 30 | 0 | 30 | |||||
| S4 | 0 | 50 | 0 | 40 | 0 | 40 | 0 | 50 | 0 | 50 | |||||
| S5 | 0 | 70 | 0 | 60 | 0 | 60 | 0 | 70 | 0 | 70 | |||||
| S6 | 0 | 0 | 0 | 0 | 0 | 0 | 0 | 0 | 0 | 0 | |||||
| S7 | 0 | 20 | 0 | 10 | 0 | 10 | 0 | 20 | 0 | 20 | |||||
| S8 | 0 | 30 | 0 | 20 | 0 | 20 | 0 | 30 | 0 | 30 | |||||
| S9 | 0 | 50 | 0 | 40 | 0 | 40 | 0 | 50 | 0 | 50 | |||||
| S10 | 0 | 70 | 0 | 60 | 0 | 60 | 0 | 70 | 0 | 70 | |||||
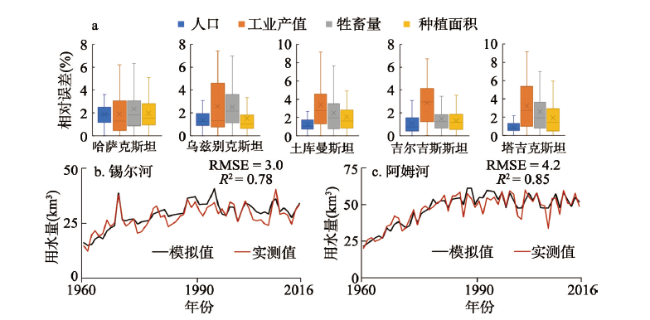
图4 咸海流域各国社会经济要素模拟结果与统计数据的相对误差及锡尔河和阿姆河子流域的用水量模拟值与观测值对比Fig. 4 The relative error between the simulation results and statistical data of social and economic factors in the Aral Sea Basin, and comparison of simulated and observed values of water use in the Syr Darya and Amu Darya subbasins |
| [1] |
[ 程国栋, 赵传燕. 干旱区内陆河流域生态水文综合集成研究. 地球科学进展, 2008,23(10):1005-1012.]
|
| [2] |
|
| [3] |
|
| [4] |
[ 阿布都米吉提·阿布力克木, 葛拥晓, 王亚俊, 等. 咸海的过去、现在与未来. 干旱区研究, 2019,36(1):7-18.]
|
| [5] |
[ 田向荣, 王国义, 樊彦芳. 咸海流域跨界水合作历史、形势及思考. 边界与海洋研究, 2017,2(6):90-104.]
|
| [6] |
|
| [7] |
|
| [8] |
|
| [9] |
|
| [10] |
|
| [11] |
|
| [12] |
|
| [13] |
|
| [14] |
|
| [15] |
|
| [16] |
|
| [17] |
|
| [18] |
|
| [19] |
|
| [20] |
|
| [21] |
|
| [22] |
|
| [23] |
|
| [24] |
|
| [25] |
|
| [26] |
[ 于长千. 中亚五国手册. 乌鲁木齐:新疆科技卫生出版社, 1992.]
|
| [27] |
|
| [28] |
|
| [29] |
|
| [30] |
|
| [31] |
|
| [32] |
Information Office of Central Asia Research Institute,Xinjiang Academy of Social Sciences. A Compilation of Economic Statistics of Five Central Asian Republics of the Soviet Union. Urumqi: 1983.
[ 新疆社会科学院中亚研究所资料情报室. 苏联中亚5个加盟共和国经济统计资料汇编. 乌鲁木齐: 新疆社会科学院, 1983.]
|
| [33] |
|
| [34] |
|
| [35] |
[ 李玮. 社会经济驱动用水的理论与方法研究[D]. 北京: 中国水利水电科学研究院, 2018.]
|
| [36] |
[ 熊鹰, 李静芝, 蒋丁玲. 基于仿真模拟的长株潭城市群水资源供需系统决策优化. 地理学报, 2013,68(9):1225-1239.]
|
| [37] |
|
| [38] |
|
| [39] |
|
| [40] |
|
| [41] |
|
| [42] |
[ 黄登迎, 杨红. 应该发展节水型畜牧业吗? 来自新疆的例证. 节水灌溉, 2018(3):77-78, 83.]
|
/
| 〈 |
|
〉 |
