
珠三角地区城镇化与生态韧性的耦合协调研究
|
王少剑(1986-), 男, 河南驻马店人, 博士, 副教授, 博士生导师, 中国地理学会会员(S110011019M), 研究方向为城市地理、城市与区域规划。E-mail: 1987wangshaojian@163.com |
收稿日期: 2020-03-01
要求修回日期: 2020-12-18
网络出版日期: 2021-06-25
基金资助
中央高校基本科研业务青年教师重点培育项目(191gzd09)
广东省特支计划()
广州市珠江科技新星(201806 010187)
版权
Coupling relationship between urbanization and ecological resilience in the Pearl River Delta
Received date: 2020-03-01
Request revised date: 2020-12-18
Online published: 2021-06-25
Supported by
Fundamental Research Funds for the Central Universities(191gzd09)
Guangdong Special Support Program()
Pearl River S&T Nova Program of Guangzhou(201806 010187)
Copyright
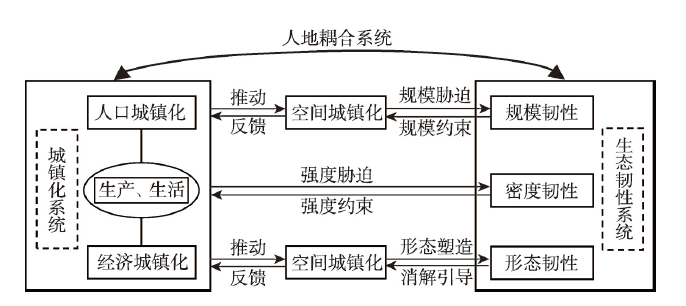
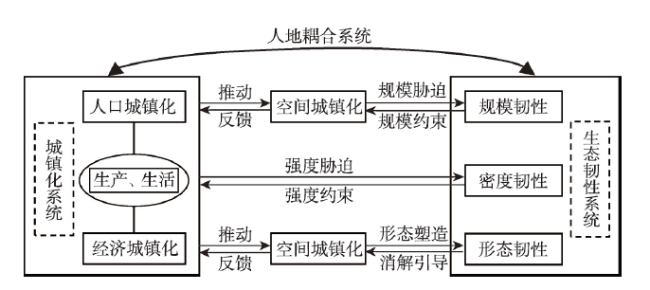
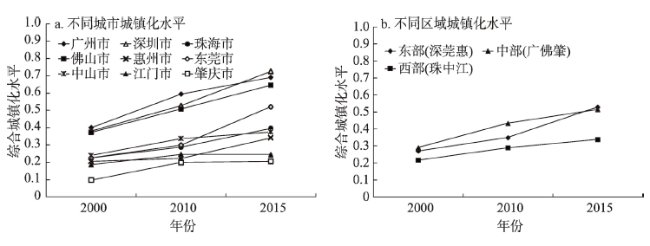
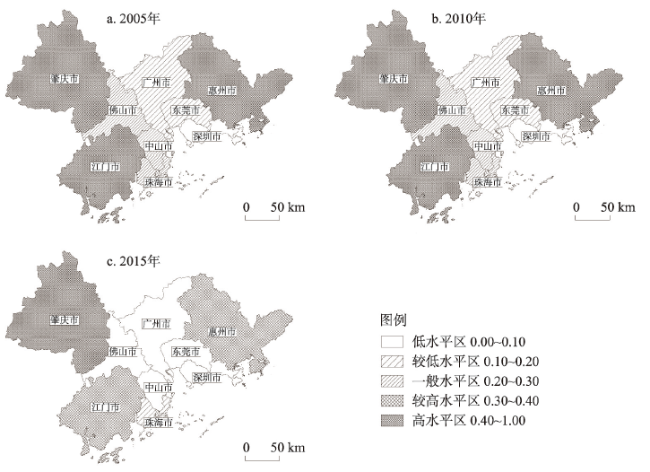
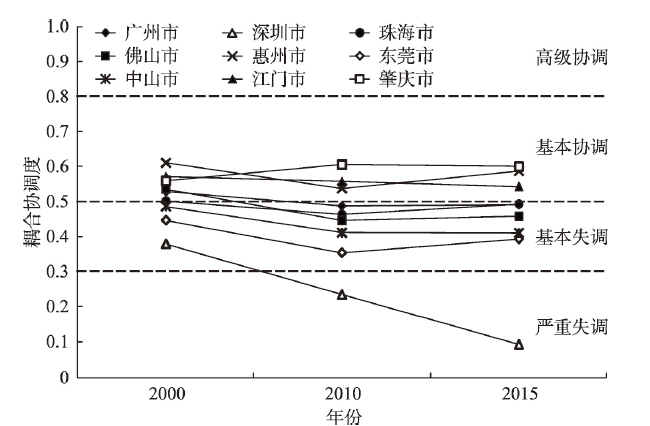
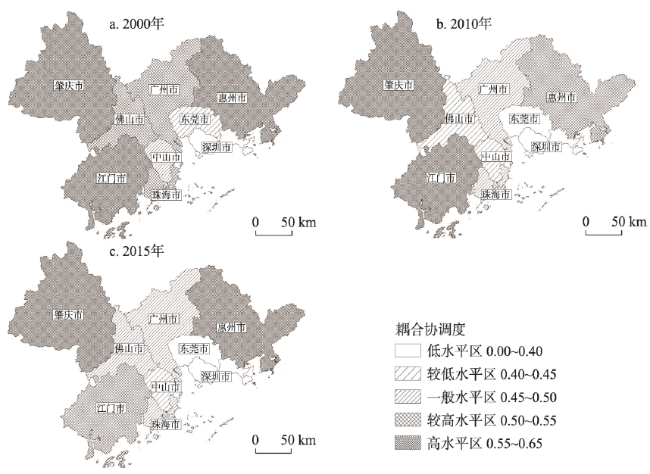
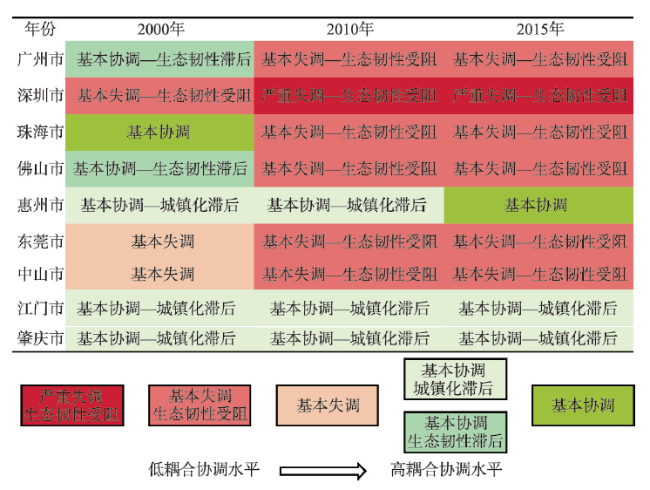
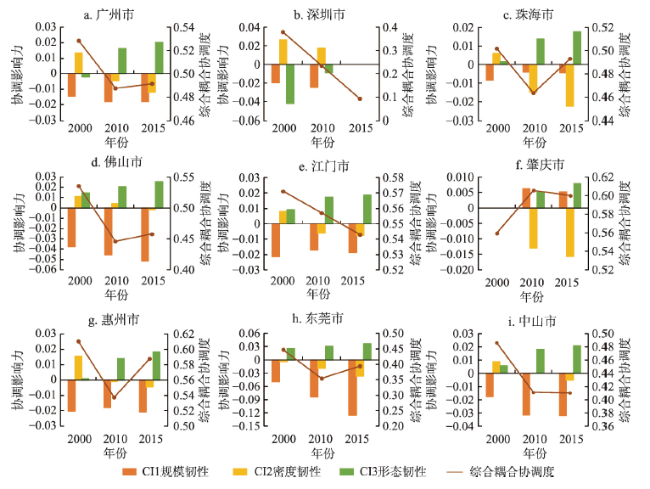
城市韧性是新兴的研究话题,其实质为城市面对不确定性扰动的抵抗、恢复及适应能力。本文构建“规模—密度—形态”三维城市生态韧性评价体系,借鉴物理学耦合模型测算2000—2015年珠三角城市城镇化与生态韧性的耦合协调度,并对其时空变化特征进行深入探讨。结果表明:2000—2015年珠三角各市的城镇化水平总体不断提升,生态韧性水平持续降低,两者耦合协调度总体由基本协调向基本失调下滑。在空间分布上,珠三角地区城镇化与生态韧性的耦合协调度呈现出以珠江入海口城市为中心、向外围递增的圈层式格局。从生态韧性子系统对城镇化与生态韧性耦合协调的作用来看,规模韧性主要起反向阻滞作用;形态韧性的协调影响力主要为正向,且随时间推移不断增强;密度韧性的正向协调影响力持续下降,且在低于零值后负向增长。以新型城镇化引领区域协调发展,并通过严守三区三线、适应生态承载力、合理布局城市绿地等方法提高生态韧性,是未来珠三角实现城镇化与生态韧性协调可持续发展的主要路径。
王少剑 , 崔子恬 , 林靖杰 , 谢金燕 , 苏坤 . 珠三角地区城镇化与生态韧性的耦合协调研究[J]. 地理学报, 2021 , 76(4) : 973 -991 . DOI: 10.11821/dlxb202104013
Urban resilience is an emerging research topic of urban studies, and its essence is the ability of cities to resist, recover and adapt to uncertain disturbances. This paper first constructs a "Size-Density-Morphology" urban ecological resilience evaluation system, and then uses the coupling coordination degree model to measure the degree of coupling coordination between urbanization and ecological resilience in the Pearl River Delta from 2000 to 2015, and conducts an in-depth discussion on its temporal and spatial characteristics. The results show that: (1) From 2000 to 2015, the urbanization level of cities in the study area generally increased while the level of ecological resilience declined. The coupling coordination degree between the two systems decreased from basic coordination to basic imbalance. (2) In terms of spatial distribution, the coupling coordination degree between ecological resilience and urbanization of cities presented a circle pattern that centered on the cities at the mouth of the Pearl River and increased toward the periphery. (3) Ecological resilience subsystems played different roles in the coupling coordination between urbanization and ecological resilience. Specifically, size resilience mainly played a reverse blocking role; the influence of morphological resilience was mainly positive and continued to increase over time; the effect of density resilience was positive and continued to decline and further became negative after falling below zero. Leading the coordinated development of regions with new urbanization, and improving ecological resilience by strictly observing the three areas and three lines, adapting to ecological carrying capacity, and rationally arranging urban green spaces, are the main path for achieving coordinated and sustainable development of urbanization and ecological resilience in the Pearl River Delta in the future.
表1 珠三角地区生态足迹的均衡因子与产量因子Tab. 1 Equivalence factors and yield factors of ecological footprint of the Pearl River Delta |
| 土地类型 | 均衡因子ri | 产量因子mj |
|---|---|---|
| 耕地 | 2.8 | 2.88 |
| 草地 | 0.5 | 1.38 |
| 林地 | 1.1 | 0.88 |
| 水域 | 0.2 | 2.01 |
| 化石燃料用地 | 1.1 | 0.00 |
| 建筑用地 | 2.8 | 2.88 |
表2 城镇化综合评价指标体系Tab. 2 The comprehensive index system of urbanization |
| 一级指标 | 权重 | 二级指标 | 权重 | 类型 |
|---|---|---|---|---|
| 人口城镇化 | 0.3316 | 城镇化率 | 0.0548 | + |
| 城市人口密度 | 0.1334 | + | ||
| 非农产业从业人员比重 | 0.0317 | + | ||
| 城市常住人口数 | 0.1117 | + | ||
| 经济城镇化 | 0.6684 | 人均GDP | 0.1311 | + |
| 第二产业产值占GDP比重 | 0.0412 | + | ||
| 第三产业产值占GDP比重 | 0.0582 | + | ||
| 城市经济密度 | 0.1428 | + | ||
| 固定资产投资 | 0.2059 | + |
表3 生态韧性综合评价指标体系Tab. 3 The comprehensive index system of ecological resilience |
| 指标 | 权重 | 类型 |
|---|---|---|
| 规模韧性 | 0.4473 | + |
| 密度韧性 | 0.3331 | + |
| 形态韧性 | 0.2197 | + |
表4 城镇化与生态韧性的耦合协调类型划分Tab. 4 Classification of coupling coordination degree of urbanization and ecological resilience |
| 类型 | 耦合协调度 | 亚类型 | U1与U2相对大小 |
|---|---|---|---|
| 高级协调 | 0.8 < D ≤ 1 | 高级协调—城镇化滞后 | U2-U1 > 0.1 |
| 高级协调—生态韧性滞后 | U1-U2 > 0.1 | ||
| 高级协调 | 0 ≤ |U1-U2 | ≤ 0.1 | ||
| 基本协调 | 0.5 < D ≤ 0.8 | 基本协调—城镇化滞后 | U2-U1 > 0.1 |
| 基本协调—生态韧性滞后 | U1-U2 > 0.1 | ||
| 基本协调 | 0 ≤ |U1-U2| ≤ 0.1 | ||
| 基本失调 | 0.3 < D ≤ 0.5 | 基本失调—城镇化受阻 | U2-U1 > 0.1 |
| 基本失调—生态韧性受阻 | U1-U2 > 0.1 | ||
| 基本失调 | 0 ≤ |U1-U2| ≤ 0.1 | ||
| 严重失调 | 0 < D ≤ 0.3 | 严重失调—城镇化受阻 | U2-U1 > 0.1 |
| 严重失调—生态韧性受阻 | U1-U2 > 0.1 | ||
| 严重失调 | 0 ≤ |U1-U2| ≤ 0.1 |
表5 2000—2015年珠三角各城市规模韧性指数Tab. 5 Resilience index of cities in the Pearl River Delta, 2000-2015 |
| 城市 | 已开发建设用地面积(km2) | 适宜建设用地面积(km2) | 规模韧性 | ||||
|---|---|---|---|---|---|---|---|
| 2000年 | 2010年 | 2015年 | 2000年 | 2010年 | 2015年 | ||
| 广州 | 708.054 | 1183.540 | 1257.113 | 4417.095 | 6.238 | 3.732 | 3.514 |
| 深圳 | 493.923 | 746.907 | 772.350 | 1346.315 | 2.726 | 1.803 | 1.743 |
| 珠海 | 127.323 | 183.679 | 193.981 | 1129.710 | 8.873 | 6.150 | 5.824 |
| 佛山 | 491.504 | 967.901 | 1046.979 | 2483.358 | 5.053 | 2.566 | 2.372 |
| 江门 | 458.461 | 595.465 | 665.087 | 6248.908 | 13.630 | 10.494 | 9.396 |
| 肇庆 | 249.645 | 331.106 | 358.134 | 7838.219 | 31.397 | 23.673 | 21.886 |
| 惠州 | 359.835 | 597.613 | 645.415 | 5928.079 | 16.474 | 9.920 | 9.185 |
| 东莞 | 553.752 | 1041.234 | 1079.704 | 1892.422 | 3.417 | 1.817 | 1.753 |
| 中山 | 185.572 | 423.043 | 445.965 | 1242.172 | 6.694 | 2.936 | 2.785 |
| 珠三角平均 | 3628.070 | 6070.488 | 6464.728 | 32526.277 | 8.965 | 5.358 | 5.031 |
表6 2000—2015年珠三角各城市密度韧性指数Tab. 6 Density resilience index of cities in the Pearl River Delta, 2000-2015 |
| 城市 | 生态足迹(万hm2) | 生态承载力(万hm2) | 密度韧性指数 | ||||||||
|---|---|---|---|---|---|---|---|---|---|---|---|
| 2000年 | 2010年 | 2015年 | 2000年 | 2010年 | 2015年 | 2000年 | 2010年 | 2015年 | |||
| 广州 | 828.335 | 1600.175 | 1830.351 | 187.383 | 204.888 | 211.433 | 0.226 | 0.128 | 0.116 | ||
| 深圳 | 583.898 | 1305.864 | 1542.616 | 85.245 | 114.950 | 124.777 | 0.146 | 0.088 | 0.081 | ||
| 珠海 | 102.959 | 196.610 | 221.536 | 26.824 | 27.562 | 28.101 | 0.261 | 0.140 | 0.127 | ||
| 佛山 | 444.685 | 906.387 | 1007.370 | 105.719 | 117.128 | 117.789 | 0.238 | 0.129 | 0.117 | ||
| 江门 | 329.102 | 560.368 | 612.711 | 149.367 | 151.862 | 151.554 | 0.454 | 0.271 | 0.247 | ||
| 肇庆 | 281.183 | 493.816 | 550.362 | 179.090 | 181.967 | 183.276 | 0.637 | 0.368 | 0.333 | ||
| 惠州 | 267.951 | 579.291 | 644.706 | 156.574 | 165.470 | 166.350 | 0.584 | 0.286 | 0.258 | ||
| 东莞 | 536.935 | 1035.526 | 1119.012 | 90.103 | 98.743 | 98.375 | 0.168 | 0.095 | 0.088 | ||
| 中山 | 196.900 | 393.157 | 435.127 | 47.506 | 50.535 | 50.971 | 0.241 | 0.129 | 0.117 | ||
| 珠三角平均 | 3571.948 | 7071.194 | 7963.791 | 1027.811 | 1113.105 | 1132.627 | 0.288 | 0.157 | 0.142 | ||
表7 2000—2015年珠三角各城市形态韧性指数Tab. 7 Morphological resilience index of cities in the Pearl River Delta, 2000-2015 |
| 城市 | “源—汇”景观平均距离指数 | 形态韧性指数 | |||||
|---|---|---|---|---|---|---|---|
| 2000年 | 2010年 | 2015年 | 2000年 | 2010年 | 2015年 | ||
| 广州 | 304.297 | 315.923 | 315.239 | 0.815 | 0.785 | 0.786 | |
| 深圳 | 560.833 | 562.260 | 569.518 | 0.442 | 0.441 | 0.435 | |
| 珠海 | 235.261 | 249.900 | 246.287 | 1.054 | 0.992 | 1.006 | |
| 佛山 | 212.443 | 316.319 | 314.872 | 1.167 | 0.784 | 0.787 | |
| 江门 | 122.806 | 136.230 | 140.238 | 2.019 | 1.820 | 1.768 | |
| 肇庆 | 98.173 | 119.432 | 118.569 | 2.525 | 2.076 | 2.091 | |
| 惠州 | 131.281 | 148.569 | 147.647 | 1.888 | 1.668 | 1.679 | |
| 东莞 | 180.442 | 294.512 | 297.585 | 1.374 | 0.842 | 0.833 | |
| 中山 | 239.535 | 307.397 | 310.544 | 1.035 | 0.806 | 0.798 | |
| 珠三角平均 | 247.884 | 295.297 | 294.746 | 1.000 | 0.839 | 0.841 | |
表8 2000—2015年珠三角各城市生态韧性指数Tab. 8 Ecological resilience index of cities in the Pearl River Delta, 2000-2015 |
| 城市 | 城市生态韧性 | ||
|---|---|---|---|
| 2000年 | 2010年 | 2015年 | |
| 广州 | 0.195 | 0.095 | 0.084 |
| 深圳 | 0.055 | 0.006 | 0.000 |
| 珠海 | 0.280 | 0.161 | 0.149 |
| 佛山 | 0.221 | 0.078 | 0.068 |
| 江门 | 0.569 | 0.391 | 0.355 |
| 肇庆 | 1.000 | 0.675 | 0.629 |
| 惠州 | 0.676 | 0.376 | 0.349 |
| 东莞 | 0.176 | 0.053 | 0.046 |
| 中山 | 0.234 | 0.085 | 0.076 |
| 珠三角平均 | 0.378 | 0.213 | 0.195 |
| [1] |
Xinhua News Agency. China's urbanization rate has risen significantly over the past 70 years. http://www.gov.cn/xinwen/2019-08/15/content_5421538.htm, 2019-08-15.
[ 新华社. 70年来我国城镇化率大幅提升. http://www.gov.cn/xinwen/2019-08/15/content_5421538.htm, 2019-08-15.]
|
| [2] |
[ 陆大道, 姚士谋, 李国平, 等. 基于我国国情的城镇化过程综合分析. 经济地理, 2007,27(6):883-887.]
|
| [3] |
[ 邵亦文, 徐江. 城市韧性: 基于国际文献综述的概念解析. 国际城市规划, 2015,30(2):48-54.]
|
| [4] |
|
| [5] |
[ 帕克, 麦肯齐. 城市社会学. 宋俊岭, 等, 译. 北京: 华夏出版社, 1987.]
|
| [6] |
|
| [7] |
[ 李亚, 翟国方. 我国城市灾害韧性评估及其提升策略研究. 规划师, 2017,33(8):5-11.]
|
| [8] |
|
| [9] |
|
| [10] |
|
| [11] |
|
| [12] |
[ 张明斗, 冯晓青. 长三角城市群内各城市的城市韧性与经济发展水平的协调性对比研究. 城市发展研究, 2019,26(1):82-91.]
|
| [13] |
[ 刘堃. 社会主义市场经济背景下韧性规划思想的显现与理论建构: 基于深圳市城市规划实践(1979—2011). 城市规划, 2014,38(11):59-64.]
|
| [14] |
[ 石婷婷. 从综合防灾到韧性城市: 新常态下上海城市安全的战略构想. 上海城市规划, 2016(1):13-18.]
|
| [15] |
[ 崔木花. 中原城市群9市城镇化与生态环境耦合协调关系. 经济地理, 2015,35(7):72-78.]
|
| [16] |
[ 黄金川, 方创琳. 城市化与生态环境交互耦合机制与规律性分析. 地理研究, 2003,22(2):211-220.]
|
| [17] |
[ 刘耀彬, 李仁东, 宋学锋. 中国区域城市化与生态环境耦合的关联分析. 地理学报, 2005,60(2):237-247.]
|
| [18] |
[ 王少剑, 方创琳, 王洋. 京津冀地区城市化与生态环境交互耦合关系定量测度. 生态学报, 2015,35(7):2244-2254.]
|
| [19] |
[ 张引, 杨庆媛, 闵婕. 重庆市新型城镇化质量与生态环境承载力耦合分析. 地理学报, 2016,71(5):817-828.]
|
| [20] |
[ 崔学刚, 方创琳, 刘海猛, 等. 城镇化与生态环境耦合动态模拟理论及方法的研究进展. 地理学报, 2019,74(6):1079-1096.]
|
| [21] |
[ 修春亮, 魏冶, 王绮. 基于“规模—密度—形态”的大连市城市韧性评估. 地理学报, 2018,73(12):2315-2328.]
|
| [22] |
[ 陈明星, 陆大道, 张华. 中国城市化水平的综合测度及其动力因子分析. 地理学报, 2009,64(4):387-398.]
|
| [23] |
[ 欧向军, 甄峰, 秦永东, 等. 区域城市化水平综合测度及其理想动力分析: 以江苏省为例. 地理研究, 2008,27(5):993-1002.]
|
| [24] |
[ 郑文升, 王晓芳, 李诚固. 1997年以来中国副省级城市区域城市化综合发展水平空间差异. 经济地理, 2007,27(2):256-260.]
|
| [25] |
[ 陈凤桂, 张虹鸥, 吴旗韬, 等. 我国人口城镇化与土地城镇化协调发展研究. 人文地理, 2010,25(5):53-58.]
|
| [26] |
[ 郭付友, 李诚固, 陈才, 等. 2003年以来东北地区人口城镇化与土地城镇化时空耦合特征. 经济地理, 2015,35(9):49-56.]
|
| [27] |
[ 陆大道. 我国的城镇化进程与空间扩张. 城市规划学刊, 2007(4):47-52.]
|
| [28] |
[ 吴传钧. 论地理学的研究核心: 人地关系地域系统. 经济地理, 1991,11(3):1-6.]
|
| [29] |
[ 徐新良, 刘纪远, 张树文, 等. 中国多时期土地利用土地覆被遥感监测数据集(CNLUCC). 中国科学院资源环境科学数据中心数据注册与出版系统 (http://www.resdc.cn/DOI), 2018. DOI: 10.12078/2018070201.]
|
| [30] |
Statistics Bureau of Guangdong Province. Statistical Yearbook of Guangdong Province. Beijing: China Statistics Press, 2001-2016.
[ 广东省统计局. 广东统计年鉴. 北京: 中国统计出版社, 2001-2016.]
|
| [31] |
National Bureau of Statistics. Statistical Yearbook of Urban Construction. Beijing China Statistics Press, 2001-2016.
[ 国家统计局. 城市建设统计年鉴. 北京: 中国统计出版社, 2001-2016.]
|
| [32] |
National Bureau of Statistics. China Energy Statistics Yearbook. Beijing China Statistics Press, 2001-2016.
[ 国家统计局. 中国能源统计年鉴. 北京: 中国统计出版社, 2001-2016.]
|
| [33] |
National Bureau of Statistics. China Urban Statistics Yearbook. Beijing China Statistics Press, 2001-2016.
[ 国家统计局. 中国城市统计年鉴. 北京: 中国统计出版社, 2001-2016.]
|
| [34] |
[ 徐新良. 中国陆地生态系统服务价值空间分布数据集. 中国科学院资源环境科学数据中心数据注册与出版系统 (http://www.resdc.cn/DOI), 2018. DOI: 10.12078/2018060503.]
|
| [35] |
[ 郭亚军. 综合评价理论、方法及应用. 北京: 科学出版社. 2007: 70-73.]
|
| [36] |
[ 白立敏, 冯兴华, 孙瑞丰, 等. 吉林省城镇韧性水平与城镇化质量耦合分析. 城市建筑, 2018,15(35):19-23.]
|
| [37] |
[ 俞孔坚. “反规划”途径. 北京: 中国建筑工业出版社, 2005.]
|
| [38] |
[ 俞孔坚, 李博, 李迪华. 自然与文化遗产区域保护的生态基础设施途径: 以福建武夷山为例. 城市规划, 2008,32(10):88-91, 96.]
|
| [39] |
[ 马琪, 刘康, 刘文宗, 等. 干旱半干旱区生态保护红线划分研究: 以“多规合一”试点榆林市为例. 地理研究, 2018,37(1):158-170.]
|
| [40] |
[ 王丽霞, 邹长新, 王燕, 等. 基于GIS识别生态保护红线边界的方法: 以北京市昌平区为例. 生态学报, 2017,37(18):6176-6185.]
|
| [41] |
|
| [42] |
[ 熊德国, 鲜学福, 姜永东. 生态足迹理论在区域可持续发展评价中的应用及改进. 地理科学进展, 2003,22(6):618-626.]
|
| [43] |
[ 徐中民, 张志强, 程国栋. 甘肃省1998年生态足迹计算与分析. 地理学报, 2000,55(5):607-616.]
|
| [44] |
[ 徐中民, 张志强, 程国栋, 等. 中国1999年生态足迹计算与发展能力分析. 应用生态学报, 2003,14(2):280-285.]
|
| [45] |
[ 刘某承, 李文华, 谢高地. 基于净初级生产力的中国生态足迹产量因子测算. 生态学杂志, 2010,29(3):592-597.]
|
| [46] |
|
| [47] |
[ 王成, 唐宁. 重庆市乡村三生空间功能耦合协调的时空特征与格局演化. 地理研究, 2018,37(6):1100-1114.]
|
| [48] |
|
| [49] |
[ 王少剑, 刘志涛, 张婷婷, 等. 服务业与多维城镇化的耦合协调研究: 以广州市为例. 热带地理, 2019,39(3):450-460.]
|
| [50] |
Shenzhen Academy of Social Sciences. Practice in empirical research of shenzhen urbanization. https://max.book118.com/html/2017/0808/126668775.shtm, 2015-06.
[ 深圳市社会科学院. 深圳推进城市化的实践于经验研究. https://max.book118.com/html/2017/0808/126668775.shtm, 2015-06.]
|
/
| 〈 |
|
〉 |