
环印度洋区域国家地缘经济格局分析
|
袁丽华(1988-), 女, 河北邯郸人, 博士生, 主要从事全球化与地缘关系研究。E-mail: ylh20070901@163.com |
收稿日期: 2020-09-27
要求修回日期: 2020-12-28
网络出版日期: 2021-06-25
基金资助
第二次青藏高原综合考察研究(2019QZKK0608)
版权
Spatio-temporal patterns of geo-economics of the countries in the Indian Ocean Region: Based on merchandise trade volume data from 1992 to 2017
Received date: 2020-09-27
Request revised date: 2020-12-28
Online published: 2021-06-25
Supported by
The Second Tibetan Plateau Scientific Expedition and Research Program(2019QZKK0608)
Copyright
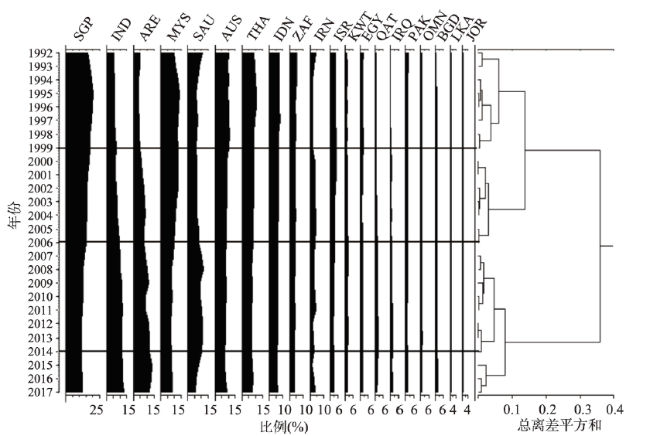
环印度洋区域不仅关乎中国贸易与能源安全,同时也涵盖“一带一路”倡议合作的部分区域。为便于中国更好地开展与环印度洋区域国家之间的贸易合作,需要定量考察环印度洋区域的地缘经济格局,掌握域内外大国在该区域的地缘经济竞争情况。首先基于有序聚类方法将1992—2017年环印度洋区域国家的商品贸易数据划分为4个阶段,然后探究环印度洋区域在各阶段全球经济中的地位变化、域内地缘经济特征以及域内外大国在该区域的地缘经济竞争格局。结果发现:① 从全球地位和空间结构来看,1992—2017年环印度洋区域在全球贸易中的地位明显提升。区域贸易的空间结构呈现出由新加坡和马来西亚构成的“双核心”发展为由印度、新加坡、马来西亚、澳大利亚、泰国和阿联酋构成的“多核心”。② 从区域内部来看,域内贸易联系与依赖程度趋于加强,区域贸易一体化程度有所提升,但仍然有限。③ 从域内外大国竞争来看,美国和日本两国在环印度洋区域的地缘经济影响力均呈下滑趋势;而中国的地缘经济影响力逐步提升且已超美日;印度的地缘影响力虽然同样呈上升趋势,但仍弱于中美日;澳大利亚则长期最低。研究从全球地位变化、域内贸易联系、域内外大国竞争3个方面定量揭示了环印度洋区域地缘经济的时空格局演变。此外,研究采用的分析框架和方法也可应用于考察其他热点区域的地缘经济格局。
袁丽华 , 陈小强 , 宋长青 , 程昌秀 , 沈石 . 环印度洋区域国家地缘经济格局分析[J]. 地理学报, 2021 , 76(4) : 955 -972 . DOI: 10.11821/dlxb202104012
The Indian Ocean Region (IOR) has become a crucial area for China, because it not only notably affects the country's international trade and energy security (especially oil), but also encompasses many countries under the Belt and Road Initiative. With advances of the Belt and Road regional cooperation, an important aspect is to strengthen trade and investment with a number of countries in the IOR. To facilitate China's development of better trade relations with the countries in the IOR, quantitatively investigating the trade links between the IOR and the globe and subsequently providing a better understanding of the trade competition patterns of the five major powers (i.e., the United States, Japan, China, India, and Australia) in this region are crucial. This study aimed to investigate the evolutions of the IOR's position in the global economy, spatial structures of its regional trade, and geo-economic competition patterns of the five major powers in this region from 1992 to 2017. To better identify the characteristics of these evolutions in the IOR, a sequential clustering method was employed to divide the period of 1992-2017 into four phases with the proportion data of merchandise trade volume of each country in the IOR as the basis. The results are summarized as follows. (1) The IOR's position in the global economy generally exhibited an increasing trend from 1992 to 2017, as indicated by the upward trends in the IOR's global shares of its regional trade volume, its regional eigenvector centrality, and its regional GDP. Furthermore, the spatial structures of the IOR's countries varied from "dual-core" (comprising Singapore and Malaysia) to "multi-core" (including India, the United Arab Emirates, Singapore, Malaysia, Australia, and Thailand). This was indicated by the clustering patterns of the countries based on each country's trade volume and eigenvector centrality. (2) The extent of the intra-regional trade integration of the IOR remained at a relatively low level despite that it generally showed a rising trend from 1992 to 2017. (3) The geo-economic influence of both the United States and Japan in the IOR declined from 1992 to 2017, as indicated by the downward trends in the trade dependence of the 47 countries (excluding India and Australia) in the IOR on the two countries. However, China's geo-economic influence in this region gradually increased and exceeded those of the United States and Japan in the third phase. India's geo-economic influence also showed an upward trend, but it was inferior to those of China, the United States, and Japan. Further, Australia's geo-economic influence remained the weakest in the entire period. This study quantitatively reveals the variations in the geo-economic patterns of the IOR from three aspects, i.e., its global trade position, extent of its intra-regional trade integration, and geo-economic competition patterns of the five major powers in the IOR. Moreover, the research framework and methods used in this study can also be used to investigate the geo-economic patterns of other regions (e.g., the Belt and Road region and the free trade zone of Regional Comprehensive Economic Partnership).
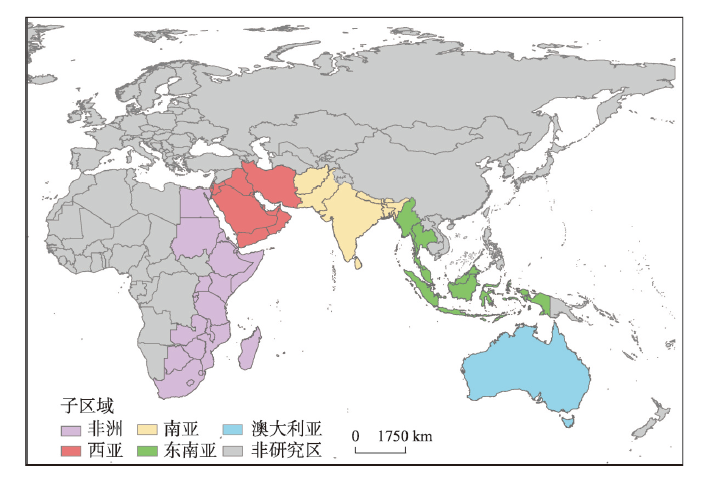
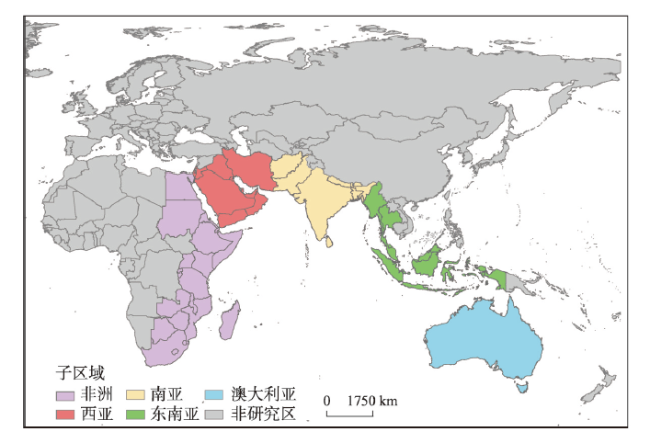
图1 环印度洋区域49国空间分布图注:基于自然资源部标准地图服务网站审图号为GS(2016)1666号的标准地图制作,底图无修改。 Fig. 1 Spatial distribution of the 49 countries in the Indian Ocean Region (IOR) |
表1 按子区域划分环印度洋区域国家Tab. 1 The 49 countries in the sub-regions in the Indian Ocean Region |
| 子区域名称 | 国家数量(个) | 国家名称 |
|---|---|---|
| 非洲 | 23 | 埃及(EGY)、埃塞俄比亚(ETH)、博茨瓦纳(BWA)、布隆迪(BDI)、厄立特里亚(ERI)、吉布提(DJI)、津巴布韦(ZWE)、科摩罗(COM)、肯尼亚(KEN)、莱索(LSO)、卢旺达(RWA)、马达加斯加(MDG)、马拉维(MWI)、毛里求斯(MUS)、莫桑比克(MOZ)、南非(ZAF)、塞舌尔(SYC)、斯威士兰(SWZ)、苏丹(SDN)、索马里(SOM)、坦桑尼亚(TZA)、乌干达(UGA)、赞比亚(ZMB) |
| 西亚 | 11 | 伊朗(IRN)、伊拉克(IRQ)、科威特(KWT)、沙特阿拉伯(SAU)、阿联酋(ARE)、巴林(BHR)、也门(YEM)、阿曼(OMN)、卡塔尔(QAT)、约旦(JOR)、以色列(ISR) |
| 南亚 | 8 | 印度(IND)、孟加拉国(BGD)、巴基斯坦(PAK)、斯里兰卡(LKA)、马尔代夫(MDV)、阿富汗(AFG)、不丹(BTN)、尼泊尔(NPL) |
| 东南亚 | 6 | 印度尼西亚(IDN)、马来西亚(MYS)、缅甸(MMR)、泰国(THA)、新加坡(SGP)、东帝汶(TLS) |
| 大洋洲 | 1 | 澳大利亚(AUS) |
注:括号内的3位英文字母为该国的国际标准英文名称缩写。 |
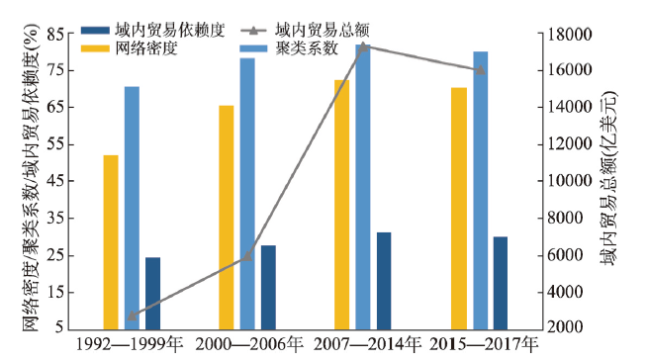
图5 1992—2017年环印度洋区域内部贸易网络与域内贸易依赖度变化Fig. 5 Variations of the intra-regional trade networks and the intra-regional trade share of the Indian Ocean Region from 1992 to 2017 |
表2 1992—2017年环印度洋区域内部贸易网络统计Tab.2 Statistics of the intra-regional trade networks of the Indian Ocean Region from 1992 to 2017 |
| 时段 | 域内贸易联系数量(个) | 平均贸易伙伴数量(个) | 平均双边贸易流量(亿美元) | 域内贸易总额 (亿美元) | 网络 密度(%) | 聚类 系数(%) |
|---|---|---|---|---|---|---|
| 1992—1999年 | 1071 | 23 | 1.29 | 2738.24 | 54.38 | 70.70 |
| 2000—2006年 | 1544 | 32 | 1.91 | 5962.06 | 65.63 | 78.21 |
| 2007—2014年 | 1700 | 35 | 5.08 | 17321.69 | 72.27 | 81.96 |
| 2015—2017年 | 1655 | 34 | 4.85 | 16034.60 | 70.37 | 80.27 |
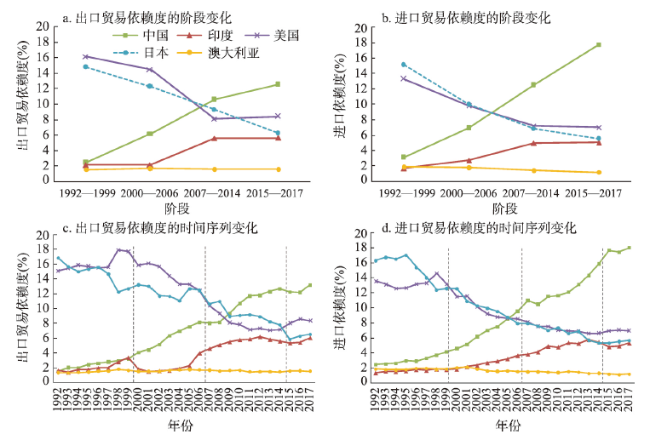
图6 1992—2017年环印度洋区域47国(印澳除外)对美日印澳中的贸易依赖度Fig. 6 Trade dependence of the 47 countries (excluding India and Australia) in the Indian Ocean Region on the United States, Japan, China, India, and Australia from 1992 to 2017 |
图7 1992—2017年环印度洋区域国家最大进口贸易伙伴国Fig. 7 Largest importer of each country in the Indian Ocean Region from 1992 to 2017 |
表3 1992—2017年环印度洋区域47国(印澳除外)最大贸易伙伴国为美日印中的数量统计Tab. 3 The numbers of the United States, Japan, China, and India as the largest trading partners of the 47 countries (excluding India and Australia) in the Indian Ocean Region from 1992 to 2017 |
| 时段 | 最大出口伙伴国数量(个) | 最大进口伙伴国数量(个) | 最大贸易伙伴国数量(个) | |||||||||||
|---|---|---|---|---|---|---|---|---|---|---|---|---|---|---|
| 美国 | 中国 | 日本 | 印度 | 美国 | 中国 | 日本 | 印度 | 美国 | 中国 | 日本 | 印度 | |||
| 1992—1999年 | 10 | 1 | 10 | 4 | 9 | 0 | 7 | 3 | 9 | 1 | 10 | 2 | ||
| 2000—2006年 | 15 | 3 | 6 | 3 | 6 | 6 | 1 | 3 | 8 | 2 | 8 | 2 | ||
| 2007—2014年 | 7 | 8 | 2 | 2 | 4 | 14 | 1 | 6 | 3 | 15 | 1 | 5 | ||
| 2015—2017年 | 10 | 14 | 1 | 3 | 2 | 27 | 0 | 3 | 1 | 27 | 1 | 3 | ||
注:澳大利亚始终不是任何一个环印度洋区域国家的最大进出口贸易伙伴国或最大贸易伙伴国。 |
感谢北京师范大学地理科学学部地理数据与应用分析中心的地学高性能计算平台支持(
| [1] |
|
| [2] |
|
| [3] |
[ 刘鹏. 印度洋地区研究的文献综述. 南亚研究, 2015(2):139-153, 159.]
|
| [4] |
[ 杨怡爽. “印太”的经济逻辑辨析. 国际展望, 2019,11(2):84-105, 152.]
|
| [5] |
|
| [6] |
[ 刘宗义. 冲突还是合作? “印太”地区的地缘政治和地缘经济选择. 印度洋经济体研究, 2014(4):4-20.]
|
| [7] |
[ 夏立平. 地缘政治与地缘经济双重视角下的美国“印太战略”. 美国研究, 2015,29(2):32-51.]
|
| [8] |
|
| [9] |
[ 李艳芳, 支天越. “印—太”地区经济发展与地缘经济格局演进. 亚太经济, 2019(1):5-13.]
|
| [10] |
[ 吴良, 秦奇, 张丹, 等. 印度洋通道及其对中国地缘环境影响. 地理科学进展, 2018,37(11):1510-1520.]
|
| [11] |
|
| [12] |
|
| [13] |
[ 萨本望. 新兴的“地缘经济学”. 世界知识, 1995(5):2-4.]
|
| [14] |
|
| [15] |
[ 陆大道, 杜德斌. 关于加强地缘政治地缘经济研究的思考. 地理学报, 2013,68(6):723-727.]
|
| [16] |
|
| [17] |
|
| [18] |
[ 谢宝剑, 朱小敏. 地缘经济研究进展. 社会科学, 2019(10):29-41.]
|
| [19] |
|
| [20] |
[ 刘志高, 王涛, 陈伟. 中国崛起与世界贸易网络演化: 1980—2018年. 地理科学进展, 2019,38(10):1596-1606.]
|
| [21] |
|
| [22] |
[ 杨文龙, 杜德斌, 刘承良, 等. 中国地缘经济联系的时空演化特征及其内部机制. 地理学报, 2016,71(6):956-969.]
|
| [23] |
|
| [24] |
|
| [25] |
|
| [26] |
|
| [27] |
|
| [28] |
[ 潘峰华, 赖志勇, 葛岳静. 经贸视角下中国周边地缘环境分析: 基于社会网络分析方法. 地理研究, 2015,34(4):775-786.]
|
| [29] |
|
| [30] |
|
| [31] |
[ 孟德友, 马颖忆, 王晗, 等. 中国商品贸易结构不均衡性对地缘经济格局的影响. 地理科学, 2015,35(10):1238-1246.]
|
| [32] |
[ 杜德斌, 段德忠, 杨文龙, 等. 中国经济权力空间格局演化研究: 基于国家间相互依存的敏感性与脆弱性分析. 地理学报, 2016,71(10):1741-1751.]
|
| [33] |
[ 马腾, 葛岳静, 刘晓凤, 等. 中美两国在南美洲的地缘经济格局比较. 经济地理, 2018,38(3):1-10.]
|
| [34] |
[ 黄宇, 葛岳静, 刘晓凤. 基于库仑引力模型的中美日地缘经济关系测算. 地理学报, 2019,74(2):285-296.]
|
| [35] |
[ 秦奇, 吴良, 李飞, 等. 基于社会网络分析的东南亚地缘关系研究. 地理学报, 2018,73(10):2014-2030.]
|
| [36] |
[ 郗笃刚, 刘建忠, 周桥, 等. “一带一路”建设在印度洋地区面临的地缘风险分析. 世界地理研究, 2018,27(6):14-23.]
|
| [37] |
|
| [38] |
[ 冯传禄. “海上丝路”视野下的印度洋地区地缘环境与地缘风险. 印度洋经济体研究, 2019(2):16-51.]
|
| [39] |
|
| [40] |
|
| [41] |
|
| [42] |
[ 陈小强, 袁丽华, 沈石, 等. 中国及其周边国家间地缘关系解析. 地理学报, 2019,74(8):1534-1547.]
|
| [43] |
|
| [44] |
[ 陈小强, 袁丽华, 宋长青, 等. 人文地理研究中时间阶段划分的量化工具与应用. 经济地理, 2021,41(1):21-29.]
|
| [45] |
|
| [46] |
|
| [47] |
|
| [48] |
|
| [49] |
[ 张亚雄. 98—99世界贸易形势展望. 中国经济信息, 1999(2):26-29.]
|
| [50] |
|
| [51] |
|
| [52] |
|
| [53] |
[ 王劲峰, 徐成东. 地理探测器: 原理与展望. 地理学报, 2017,72(1):116-134.]
|
| [54] |
|
| [55] |
|
| [56] |
[ 沈石, 宋长青, 程昌秀, 等. GDELT: 感知全球社会动态的事件大数据. 世界地理研究, 2020,29(1):71-76.]
|
| [57] |
|
| [58] |
[ 庞珣, 刘子夜. 基于海量事件数据的中美关系分析: 对等反应、政策惯性及第三方因素. 世界经济与政治, 2019(5):53-79.]
|
| [59] |
[ 沈石, 袁丽华, 叶思菁, 等. 近40年中美地缘政治关系波动及背景解析. 地理科学, 2019,39(7):1063-1071.]
|
| [60] |
[ 刘毅, 王云, 杨宇, 等. 粤港澳大湾区区域一体化及其互动关系. 地理学报, 2019,74(12):2455-2466.]
|
| [61] |
|
| [62] |
[ 许阳贵, 刘云刚. 中国与“一带一路”沿线国家贸易及其影响因素. 热带地理, 2019,39(6):855-868.]
|
| [63] |
[ 陈韬, 贺灿飞. 国际贸易地理研究进展. 地理科学进展, 2020,39(10):1732-1746.]
|
/
| 〈 |
|
〉 |


