
上市公司500强企业网络嵌入对中国城市经济增长的影响
|
盛科荣(1977-), 男, 山东日照人, 博士, 副教授, 硕士生导师, 主要从事城市地理和区域可持续发展等研究。E-mail: shengkerong@163.com |
收稿日期: 2019-06-28
要求修回日期: 2020-05-16
网络出版日期: 2021-06-25
基金资助
国家自然科学基金项目(41771173)
版权
Network embedding and urban economic growth in China: A study based on the corporate networks of top 500 public companies
Received date: 2019-06-28
Request revised date: 2020-05-16
Online published: 2021-06-25
Supported by
National Natural Science Foundation of China(41771173)
Copyright
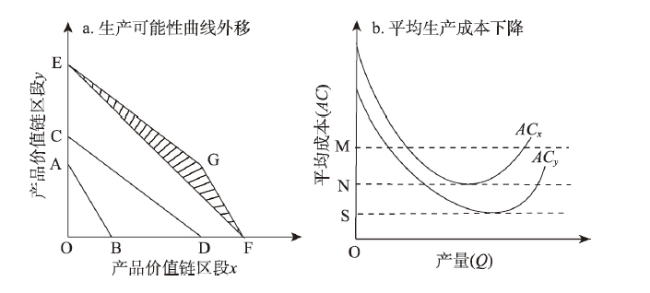
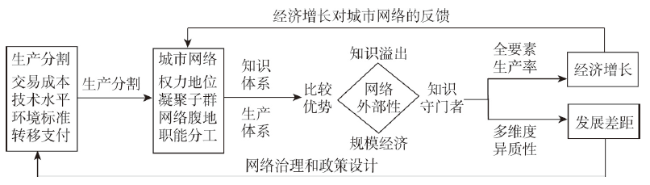
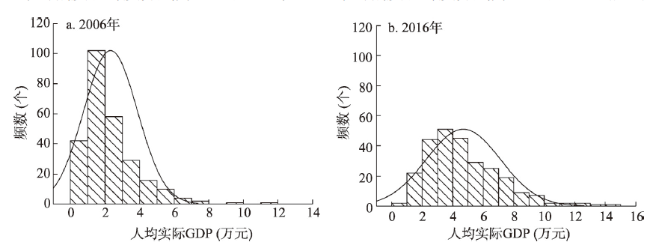
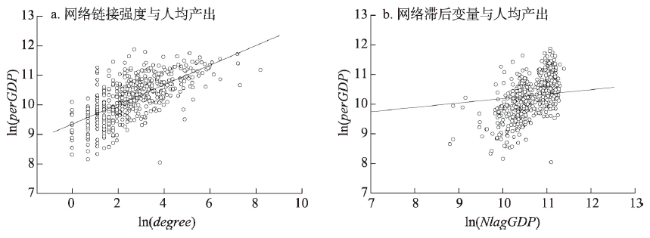
近些年来城市网络的快速发展深刻改变了中国城市经济的发展环境,城市网络外部性及其传导机制的研究已经成为新时期城市地理学的重要课题,也将为中国城镇化政策的优化调整提供直接参考。本文以产品价值链生产分割为主线,利用2017年中国上市公司500强企业和隶属联系模型建立城市网络,定量测度了网络链接强度和合作伙伴经济绩效对城市经济增长的影响,揭示了生产分割环境下网络外部性的多样性和异质性特征。研究发现:① 网络嵌入影响中国城市经济增长的传导机制具有不同的作用效果,总体来看网络链接强度对城市经济增长具有显著促进作用,但是合作伙伴经济绩效的影响不明显,表明网络嵌入主要是通过凸显比较优势和规模经济而不是知识外溢来提高城市经济绩效。② 网络嵌入对中国城市经济增长的影响具有异质性特征,东部地区、核心地位、较大规模城市从网络中获得的利益分别明显高于中西部地区、外围地位和较小规模城市,表明网络外部性的经济效果受到城市网络竞争力和知识利用能力的强烈约束。未来中国城镇化政策体系和治理模式需要做出相应调整,中国政府需要在更大空间尺度上推动城市之间的网络合作,同时高度重视网络环境下城市间多维度的发展差距问题。

盛科荣 , 张杰 , 张红霞 . 上市公司500强企业网络嵌入对中国城市经济增长的影响[J]. 地理学报, 2021 , 76(4) : 818 -834 . DOI: 10.11821/dlxb202104004
In recent years, increased attention has been given to the role of city networks in promoting economic performance. Nevertheless, the empirical evidence concerning urban network externalities and its transmission mechanisms is at best patchy. This study sets out to gain a better understanding of network externalities through the lens of corporate networks in China. Information on the headquarter and branch locations of China's top 500 public companies in 2017 are subjected to ownership linkage model to construct the urban network, resulting in a panel data with 265 cities in 2006 and 2016. Then the impacts of network linking strength and economic performance of partners on urban economic growth are quantitatively measured, and the dynamic mechanisms of network links that affect urban economic growth under the production fragmentation environment are discussed. Two conclusions are drawn. First, the transmission mechanisms of network embeddedness influencing urban economic growth in China have different effects. The analysis results of all samples show that the strength of network links has a profound impact on the quality of urban economic growth, but the impact of economic performance of partners is not obvious. This means that, in general, the transmission mechanisms of network embeddedness are to highlight the comparative advantages and economies of scale of cities, rather than to promote knowledge spillovers and technical progress. Second, the impact of network embeddedness on urban economic growth is heterogeneous in many dimensions. Cities in the eastern region, core position or with a large population size benefit more from the network competitive advantage and the knowledge flow system of "local buzz and global pipelines", while cities in the central and western regions, peripheral position or with a small population, bounded by lack of network competitiveness and "knowledge gatekeeper", increase the risks of low-end lock of industrial economy. In the future, the policy and governance of urbanization in China need to be adjusted accordingly. The Chinese government should promote network cooperation among cities on a larger spatial scale, and attach great importance to the multi-dimensional development gap between cities under the network environment.
表1 城市网络嵌入与经济增长的偏相关系数Tab. 1 Partial correlation coefficient between urban network embedding and economic growth |
| 样本类型 | 变量 | ln(perGDP) | |||||
|---|---|---|---|---|---|---|---|
| 核心 | 外围 | 东部 | 中西部 | 较大 | 较小 | ||
| 全部样本 | ln(degree) | 0.622*** | 0.501*** | 0.503*** | 0.533*** | 0.445*** | 0.433*** |
| ln(NlagGDP) | 0.584*** | 0.054 | 0.425*** | 0.094* | 0.459*** | 0.055 | |
| 2006年样本 | ln(degree) | 0.599*** | 0.434*** | 0.728*** | 0.482*** | 0.412*** | 0.315*** |
| ln(NlagGDP) | 0.433*** | -0.039 | 0.115 | -0.034 | 0.189* | -0.013 | |
| 2016年样本 | ln(degree) | 0.682*** | 0.312*** | 0.404*** | 0.474*** | 0.469*** | 0.421*** |
| ln(NlagGDP) | 0.452*** | 0.014 | 0.114 | -0.014 | 0.164** | 0.07 | |
注:ln(degree)和ln(perGDP)偏相关系数的控制变量为ln(NlagGDP),ln(NlagGDP)和ln(perGDP)偏相关系数的控制变量为ln(degree);***、**、*分别表示在1%、5%、10%的水平上显著,规模较大(较小)的城市定义为2016年市区人口规模超过(低于)200万的城市。 |
表2 变量的统计性描述Tab. 2 Statistical description of variables |
| 变量含义 | 平均值 | 中位数 | 标准差 | 最大值 | 最小值 | |
|---|---|---|---|---|---|---|
| ln(perGDP) | 人均实际GDP(元)对数 | 10.24 | 10.28 | 0.70 | 11.87 | 8.04 |
| ln(k) | 人均实际资本(元)对数 | 11.38 | 11.44 | 0.93 | 13.57 | 9.01 |
| ln(degree) | 度数的对数 | 2.70 | 2.56 | 1.36 | 8.20 | 0.00 |
| ln(NlagGDP) | 网络滞后变量(元)对数 | 10.36 | 10.61 | 1.77 | 11.39 | 0.00 |
| ln(density) | 人口密度(人/km2)对数 | 8.23 | 8.23 | 0.46 | 10.33 | 6.21 |
| ln(SlagGDP) | 空间滞后变量(元)对数 | 10.03 | 10.35 | 1.73 | 11.74 | 0.00 |
| manufact | 制造业工业占比(%) | 27.50 | 26.03 | 14.74 | 79.66 | 0.94 |
| reseacher | 研发人员占比(%) | 1.95 | 1.55 | 1.47 | 11.17 | 0.00 |
表3 基准模型回归结果Tab. 3 Regression results from benchmark models |
| 变量 | 模型(1) | 模型(2) | 模型(3) | 模型(4) | 模型(5) | 模型(6) | 模型(7) | 模型(8) |
|---|---|---|---|---|---|---|---|---|
| 全体 | 全体 | 东部 | 中西部 | 核心 | 外围 | 较大 | 较小 | |
| ln(k) | 0.726*** (26.65) | 0.727*** (26.68) | 0.603*** (10.57) | 0.774*** (24.15) | 0.541*** (11.37) | 0.754*** (23.45) | 0.550*** (9.55) | 0.771*** (26.37) |
| ln(degree) | 0.056*** (4.09) | 0.058*** (4.10) | 0.068*** (3.39) | 0.048*** (2.91) | 0.122*** (4.68) | 0.067** (2.59) | 0.118*** (4.58) | 0.031 (1.44) |
| ln(NlagGDP) | -0.005 (-0.69) | 0.168* (1.87) | -0.007 (-0.99) | 0.629*** (4.05) | -0.008 (-1.09) | 0.042** (2.26) | -0.007 (-1.25) | |
| ln(density) | 0.062** (2.06) | 0.061** (2.03) | 0.096** (2.21) | 0.033 (0.80) | 0.045 (0.81) | 0.062* (1.76) | 0.021 (0.39) | 0.050 (1.47) |
| ln(SlagGDP) | 0.011** (2.33) | 0.011** (2.31) | 0.026** (2.41) | 0.004 (0.84) | 0.026*** (3.18) | 0.009 (1.61) | 0.015 (1.58) | 0.010** (2.20) |
| manufact | 0.332*** (4.27) | 0.334*** (4.29) | 0.292* (1.98) | 0.093 (0.88) | -0.076 (-0.43) | 0.240*** (2.66) | 0.558** (2.50) | 0.322*** (3.86) |
| reseacher | 0.144 (1.50) | 0.142** (1.48) | -0.169 (-0.99) | 0.134 (1.52) | 0.224 (1.33) | 0.065 (0.74) | 0.029 (0.14) | 0.172 (1.60) |
| time | -0.121*** (-5.58) | -0.120*** (-5.48) | -0.116** (-2.49) | -0.164*** (-5.87) | -0.271*** (-4.75) | -0.147*** (-5.72) | -0.026 (-0.76) | -0.146*** (-5.85) |
| 样本数量 | 513 | 513 | 193 | 314 | 137 | 370 | 115 | 398 |
| max vif | 3.28 | 3.29 | 5.71 | 3.60 | 7.46 | 3.07 | 4.04 | 3.24 |
| mean vif | 2.06 | 2.00 | 2.94 | 2.07 | 3.75 | 1.94 | 2.64 | 1.94 |
| R2 | 0.852 | 0.853 | 0.767 | 0.873 | 0.868 | 0.834 | 0.889 | 0.839 |
注:括号中数值是估计参数相对应的稳健标准误的t检验值;***、**和*分别代表在1%、5%和10%的水平上显著,max vif和mean vif分别报告了方差膨胀因子的最大值和平均值,规模较大的城市为2016年市辖区人口规模超过200万人的城市,规模较小的城市为2016年市辖区人口规模小于200万人的城市。 |
表4 两阶段最小二乘法稳健估计结果Tab. 4 Robust estimation results from two-stage least squares method |
| 变量 | 模型(9) | 模型(10) | 模型(11) | 模型(12) | 模型(13) | 模型(14) | 模型(15) | 模型(16) |
|---|---|---|---|---|---|---|---|---|
| 全体 | 全体 | 东部 | 中西部 | 核心 | 外围 | 较大 | 较小 | |
| ln(k) | 0.709*** (26.72) | 0.712*** (26.84) | 0.579*** (11.00) | 0.755*** (24.13) | 0.538*** (11.87) | 0.741*** (24.30) | 0.534*** (9.68) | 0.753*** (26.77) |
| ln(degree) | 0.074*** (5.56) | 0.077*** (5.58) | 0.079*** (3.50) | 0.055*** (2.83) | 0.128*** (4.92) | 0.102*** (4.00) | 0.134*** (4.99) | 0.064*** (3.04) |
| ln(NlagGDP) | -0.008 (-1.20) | 0.117 (1.35) | -0.008 (-1.20) | 0.578*** (3.88) | -0.015* (-1.90) | 0.039** (2.23) | -0.014** (-2.17) | |
| ln(density) | 0.054* (1.83) | 0.053* (1.79) | 0.092** (2.07) | 0.013 (0.32) | 0.023 (0.42) | 0.055 (1.59) | 0.012 (0.23) | 0.049 (1.44) |
| ln(SlagGDP) | 0.010** (2.07) | 0.009** (2.04) | 0.025** (2.33) | 0.005 (1.10) | 0.026*** (3.32) | 0.009 (1.40) | 0.014 (1.61) | 0.009* (1.89) |
| manufact | 0.323*** (4.22) | 0.327*** (4.27) | 0.395*** (3.00) | 0.306*** (3.15) | 0.207 (1.12) | 0.317*** (3.78) | 0.576*** (2.70) | 0.307*** (3.78) |
| reseacher | 0.102 (1.07) | 0.101 (1.05) | 0.260 (1.03) | 0.178 (1.60) | 0.069 (0.39) | 0.085 (0.78) | -0.003 (-0.01) | 0.145 (1.36) |
| time | -0.119*** (-5.53) | -0.117*** (-5.40) | -0.089* (-1.84) | -0.143*** (-5.36) | -0.235*** (-4.29) | -0.145*** (-5.64) | -0.021 (-0.65) | -0.147*** (-5.87) |
| 样本数量 | 513 | 513 | 195 | 314 | 139 | 374 | 115 | 398 |
| Durbin | 0.003 | 0.003 | 0.023 | 0.039 | 0.045 | 0.016 | 0.048 | 0.013 |
| Wu-Hausman | 0.003 | 0.003 | 0.019 | 0.036 | 0.030 | 0.017 | 0.028 | 0.013 |
| R2 | 0.851 | 0.852 | 0.768 | 0.873 | 0.862 | 0.834 | 0.888 | 0.838 |
注:括号中的数值为估计参数相对应的异方差稳健标准误的z检验值;***、**和*分别代表在1%、5%和10%的水平上显著,Durbin、Wu-Hausman报告数值为解释变量内生性检验的p值。 |
| [1] |
|
| [2] |
|
| [3] |
[ 李小建. 公司地理论. 北京: 科学出版社, 1999.]
|
| [4] |
[ 宁越敏, 武前波. 企业空间组织与城市—区域发展. 北京: 科学出版社, 2011.]
|
| [5] |
[ 赵新正, 李秋平, 芮旸, 等. 基于财富500强中国企业网络的城市网络空间联系特征. 地理学报, 2019,74(4):694-709.]
|
| [6] |
[ 冷炳荣, 杨永春, 李英杰, 等. 中国城市经济网络结构空间特征及其复杂性分析. 地理学报, 2011,66(2):199-211.]
|
| [7] |
[ 李仙德. 基于上市公司网络的长三角城市网络空间结构研究. 地理科学进展, 2014,33(12):1587-1600.]
|
| [8] |
[ 盛科荣, 张红霞, 赵超越. 中国城市网络关联格局的影响因素分析: 基于电子信息企业网络的视角. 地理研究, 2019,38(5):1030-1044.]
|
| [9] |
[ 王成, 王茂军, 柴箐. 城市网络地位与网络权力的关系: 以中国汽车零部件交易链接网络为例. 地理学报, 2015,70(12):1953-1972.]
|
| [10] |
[ 朱查松, 王德, 罗震东. 中心性与控制力: 长三角城市网络结构的组织特征及演化: 企业联系的视角. 城市规划学刊, 2014(4):24-30.]
|
| [11] |
[ 贺灿飞, 肖晓俊, 邹沛思. 中国城市正在向功能专业化转型吗? 基于跨国公司区位战略的透视. 城市发展研究, 2012,19(3):20-29.]
|
| [12] |
[ 吴康. 城市网络的空间结构及其演化研究[D]. 北京: 中国科学院大学, 2013.]
|
| [13] |
|
| [14] |
|
| [15] |
|
| [16] |
|
| [17] |
|
| [18] |
|
| [19] |
|
| [20] |
|
| [21] |
|
| [22] |
|
| [23] |
|
| [24] |
|
| [25] |
|
| [26] |
|
| [27] |
|
| [28] |
|
| [29] |
|
| [30] |
[ 卢锋. 产品内分工. 经济学(季刊), 2004,3(4):55-82.]
|
| [31] |
|
| [32] |
|
| [33] |
|
| [34] |
|
| [35] |
|
| [36] |
|
| [37] |
|
| [38] |
|
| [39] |
|
| [40] |
[ 章元, 刘修岩. 聚集经济与经济增长: 来自中国的经验证据. 世界经济, 2008,31(3):60-70.]
|
| [41] |
[ 陈乐, 李郇, 姚尧, 等. 人口集聚对中国城市经济增长的影响分析. 地理学报, 2018,73(6):1107-1120.]
|
| [42] |
[ 张军, 吴桂英, 张吉鹏. 中国省际物质资本存量估算: 1952—2000. 经济研究, 2004,39(10):35-44.]
|
| [43] |
|
| [44] |
|
| [45] |
|
| [46] |
[ 方创琳, 关兴良. 中国城市群投入产出效率的综合测度与空间分异. 地理学报, 2011,66(8):1011-1022.]
|
| [47] |
[ 刘建国, 李国平, 张军涛, 等. 中国经济效率和全要素生产率的空间分异及其影响. 地理学报, 2012,67(8):1069-1084.]
|
| [48] |
[ 盛科荣, 杨雨, 孙威. 中国城市网络中心性的影响因素及形成机理: 基于上市公司500强企业网络视角. 地理科学进展, 2019,38(2):248-258.]
|
| [49] |
[ 贺胜兵, 刘友金, 段昌梅. 承接产业转移示范区具有更高的全要素生产率吗? 财经研究, 2019,45(3):127-140.]
|
| [50] |
[ 刘君德, 靳润成, 周克瑜. 中国政区地理. 北京: 科学出版社, 1999.]
|
/
| 〈 |
|
〉 |
