
东北三省城镇收缩的特征及机制与响应
|
马佐澎(1989-), 男, 山东潍坊人, 博士, 助理研究员, 主要从事城市地理与城乡规划研究。E-mail: mazuopeng@iga.ac.cn |
收稿日期: 2019-09-16
要求修回日期: 2020-12-13
网络出版日期: 2021-06-25
基金资助
国家自然科学基金项目(41871158)
国家自然科学基金项目(41771161)
国家自然科学基金项目(41801153)
国家自然科学基金项目(41771172)
吉林省教育厅“十三五”社会科学基金项目(JJKH20170958SK)
版权
Characteristics, mechanism and response of urban shrinkage in the three provinces of Northeast China
Received date: 2019-09-16
Request revised date: 2020-12-13
Online published: 2021-06-25
Supported by
National Natural Science Foundation of China(41871158)
National Natural Science Foundation of China(41771161)
National Natural Science Foundation of China(41801153)
National Natural Science Foundation of China(41771172)
"The 13th Five-year Plan" Social Science Fund Project of Education Department of Jilin(JJKH20170958SK)
Copyright
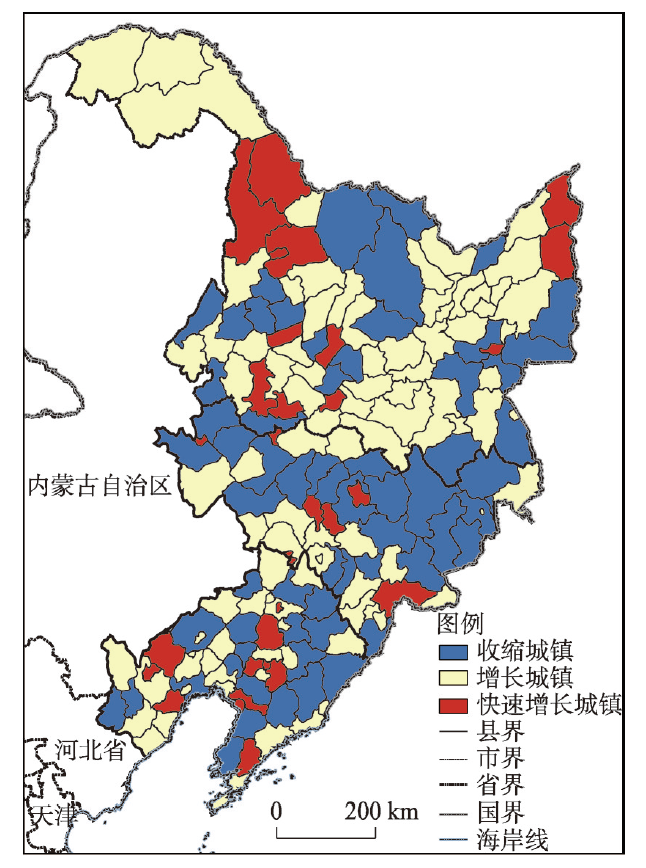
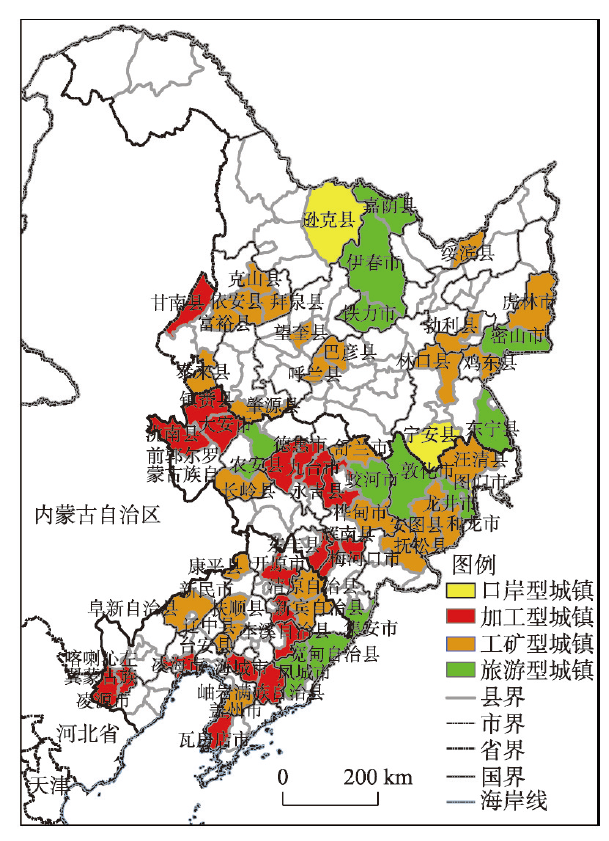
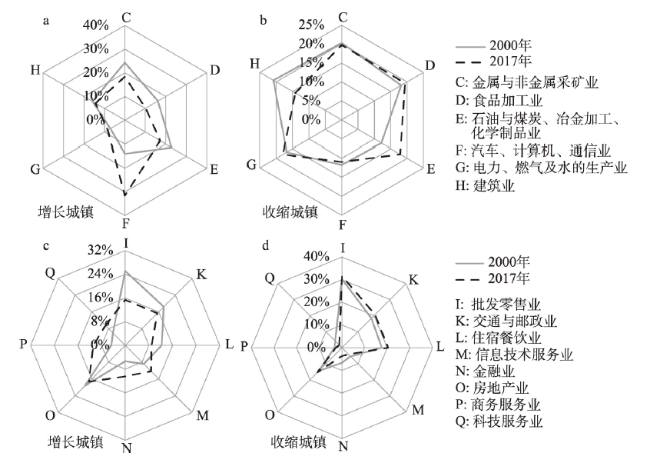
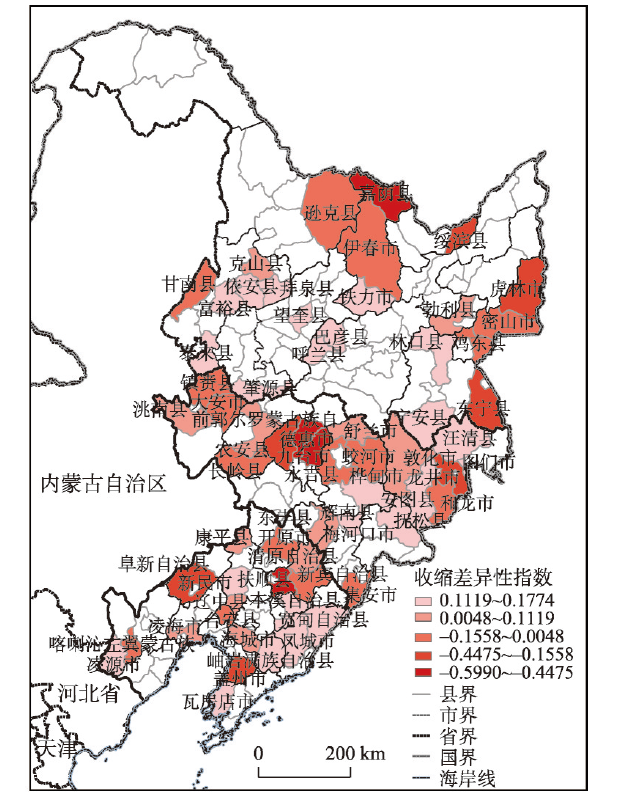
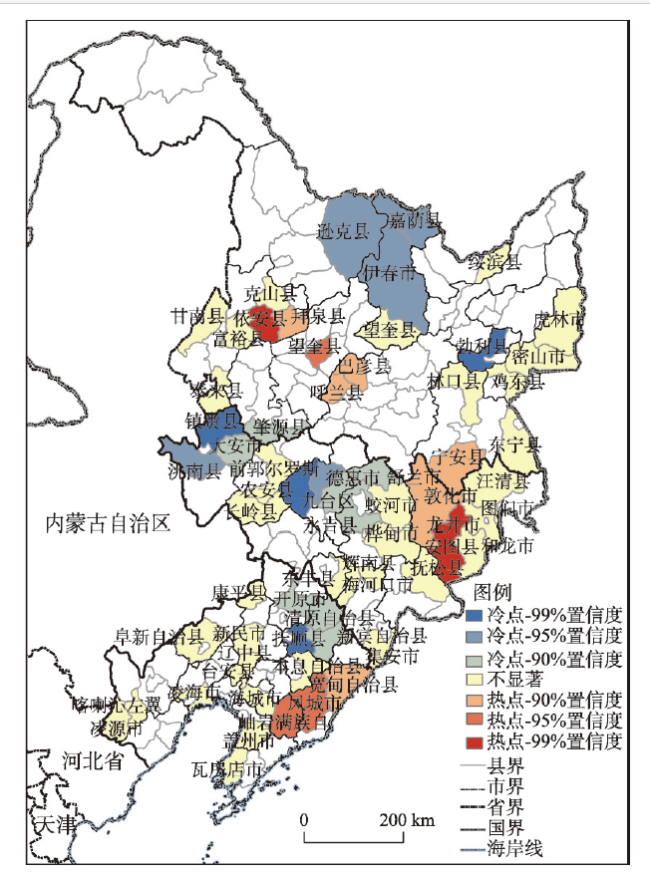
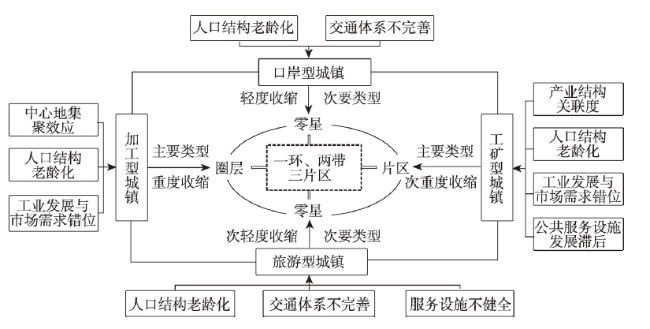
基于城镇收缩视角认识东北三省人口流失与经济衰退问题,对深化中国老工业基地转型理论具有重要意义。本文以东北三省县级市(县)为研究对象,利用ArcGIS与空间计量方法,分析增长与收缩城镇的特征与空间关系,研究收缩城镇的职能差异和空间分布格局,探讨区域城镇收缩的形成机制与应对措施。结果显示:2000年以来,东北三省出现了明显的城镇增长与收缩分异现象,42.85%的县(市)发生城镇收缩问题;增长型城镇制造业与服务业日益高级化;收缩型城镇新型产业发展与产业结构升级缓慢,经济竞争力不断弱化;增长与收缩城镇存在密切的空间关联,增长型城镇一方面通过集聚效应不断吸取收缩城镇的人口、资本等生产要素,另一方面通过传统产业的空间转移加重收缩型城镇的经济转型压力;城镇收缩程度由北至南呈高、低起伏状变化,由东至西呈先增强,后减弱的变化态势,并且加工型城镇收缩程度最高,工矿型城镇次之,旅游与口岸型城镇相对较低;城镇收缩的影响因素包括公共服务设施发展滞后、工业发展与市场需求错位、产业结构关联度低、人口结构老龄化和区域中心地的集聚效应5个方面,且作用强度依次增强。依据经济长波理论与地方发展实际,东北三省未来将经历长期的城镇收缩过程。主动适应收缩,通过城镇精明收缩,对人口与经济要素进行优化重组,是东北三省未来发展应做出的战略选择。
马佐澎 , 李诚固 , 张平宇 . 东北三省城镇收缩的特征及机制与响应[J]. 地理学报, 2021 , 76(4) : 767 -780 . DOI: 10.11821/dlxb202104001
Understanding the population loss and economic decline in the three provinces of Northeast China from a perspective of urban shrinkage is of great significance to deepening the transformation theory of China's old industrial bases. The main results can be summarized as follows. Since 2000, obvious differences in urban growth and shrinkage have occurred in Northeast China. Some 42.85% of cities showed an urban shrinkage. The manufacturing and service industries in cities of urban growth (growing cities) are increasingly advanced, while the development of new pattern industries and industrial structure upgrading are slow in cities of urban shrinkage (shrinking cities) and the economic competitiveness of these shrinking cities is weakening. There is a close spatial correlation between growing and shrinking cities. On the one hand, growing cities continuously absorb the production factors such as population and capital of shrinking cities through the agglomeration effect, and on the other hand, they increase the pressure of economic transformation of shrinking cities through the spatial transfer of traditional industries. The shrinkage degree varies from high to low from north to south, and shows a trend of 'first strengthening, then weakening' from east to west. The processing cities have the highest shrinkage degree, followed by industrial and mining cities, and the tourism and port cities have a relatively low shrinkage degree. The factors influencing urban shrinkage include the development lag of public service facilities, the misalignment of industrial development and market demand, the low correlation degree of industrial structure, the aging of population structure, and the agglomeration effect of regional central places, their intensity of action enhancing in turn. According to the economic long wave theory and local circumstances, Northeast China will experience a long-term urban shrinkage in the future. It should be a strategic choice to develop this region to actively adapt to the shrinkage, and optimize and reorganize population and economic factors through smart urban shrinkage.
Key words: urban shrinkage; characteristics; mechanism; response; Northeast China
表1 东北三省城镇收缩现象影响因素的OLS回归结果Tab. 1 OLS regression of factors affecting urban shrinkage in the three provinces of Northeast China |
| 收缩城镇 | 加工型 | 工矿型 | 旅游型 | 口岸型 | |
|---|---|---|---|---|---|
| 常数 | 1.043 | 2.301 | 1.173 | 1.305 | 0.941 |
| 人均公共财政收入 | 0.007 | -0.247 | -0.853** | -0.215 | -0.234 |
| 人均固定资产投资 | 0.316* | -0.220 | -0.439 | -0.515 | -0.356 |
| 工业化水平 | -0.054* | -0.174 | -0.531** | 0.094 | -0.052 |
| 工业集约化水平 | 0.114* | 0.302 | 0.277** | -0.061 | -0.031 |
| 工业绿色化水平 | -0.093* | 0.135* | -0.476** | 0.006 | 0.024 |
| 服务业发展规模 | 0.361** | 0.547 | 0.608* | -0.631 | 0.514 |
| 万人在校生 | 0.711*** | 0.324 | 0.279** | 0.169 | 0.231 |
| 万人医疗床位 | -1.124** | -0.976 | -1.532 | -2.041* | -1.032 |
| 交通优势度 | 0.210** | 1.498*** | 0.348 | -1.312* | -1.272 |
| 老年人口比例 | -0.456* | -0.573* | -0.379** | -1.231 | -0.54 |
| R2 | 0.638 | 0.579 | 0.524 | 0.507 | 0.432 |
| 调整R2 | 0.577 | 0.566 | 0.523 | 0.493 | 0.407 |
| F统计 | 10.394 | 9.725 | 10.061 | 8.301 | 5.430 |
注:*、**、***分别表示在0.1、0.05、0.01水平上显著。 |
| [1] |
|
| [2] |
|
| [3] |
|
| [4] |
|
| [5] |
|
| [6] |
|
| [7] |
|
| [8] |
|
| [9] |
|
| [10] |
|
| [11] |
|
| [12] |
|
| [13] |
|
| [14] |
|
| [15] |
|
| [16] |
|
| [17] |
|
| [18] |
|
| [19] |
|
| [20] |
|
| [21] |
|
| [22] |
|
| [23] |
[ 刘合林. 收缩城市量化计算方法进展. 现代城市研究, 2016,31(2):17-22.]
|
| [24] |
[ 马佐澎, 李诚固, 张婧, 等. 发达国家城市收缩现象及其对中国的启示. 人文地理, 2016,31(2):13-17.]
|
| [25] |
[ 杨振山, 孙艺芸. 城市收缩现象、过程与问题. 人文地理, 2015,30(4):6-10.]
|
| [26] |
[ 黄鹤. 精明收缩: 应对城市衰退的规划策略及其在美国的实践. 城市与区域规划研究, 2011,4(3):157-168.]
|
| [27] |
[ 张京祥, 冯灿芳, 陈浩. 城市收缩的国际研究与中国本土化探索. 国际城市规划, 2017,32(5):1-9.]
|
| [28] |
[ 姜鹏, 周静, 崔勋. 基于中日韩实例研究的收缩城市应对思辨. 现代城市研究, 2016,31(2):2-7.]
|
| [29] |
[ 林雄斌, 杨家文, 张衔春, 等. 我国城市收缩测度与影响因素分析: 基于人口与经济变化的视角. 人文地理, 2017,32(1):82-89.]
|
| [30] |
|
| [31] |
|
| [32] |
[ 郭源园, 李莉. 中国收缩城市及其发展的负外部性. 地理科学, 2019,39(1):52-60.]
|
| [33] |
[ 吴康, 龙瀛, 杨宇. 京津冀与长江三角洲的局部收缩: 格局、类型与影响因素识别. 现代城市研究, 2015,30(9):26-35.]
|
| [34] |
[ 李郇, 杜志威, 李先锋. 珠江三角洲城镇收缩的空间分布与机制. 现代城市研究, 2015,30(9):36-43.]
|
| [35] |
[ 杜志威, 张虹鸥, 叶玉瑶, 等. 2000年以来广东省城市人口收缩的时空演变与影响因素. 热带地理, 2019,39(1):20-28.]
|
| [36] |
[ 杜志威, 李郇. 珠三角快速城镇化地区发展的增长与收缩新现象. 地理学报, 2017,72(10):1800-1811.]
|
| [37] |
[ 杜志威, 李郇. 基于人口变化的东莞城镇增长与收缩特征和机制研究. 地理科学, 2018,38(11):1837-1846.]
|
| [38] |
[ 周恺, 钱芳芳, 严妍. 湖南省多地理尺度下的人口“收缩地图”. 地理研究, 2017,36(2):267-280.]
|
| [39] |
[ 王萍萍, 王毅. 经济长波: 现象、理论与展望. 技术经济, 2017,36(1):110-116.]
|
| [40] |
[ 李彦军. 产业长波、城市生命周期与城市转型. 发展研究, 2009(11):4-8.]
|
| [41] |
[ 敬东. 经济长波理论与城市发展和城市开发. 现代城市研究, 2000,15(2):8-13, 63.]
|
| [42] |
[ 刘彦随, 李进涛. 中国县域农村贫困化分异机制的地理探测与优化决策. 地理学报, 2017,72(1):161-173.]
|
| [43] |
|
/
| 〈 |
|
〉 |
