
COVID-19疫情对中国区域经济及产业的影响
|
吴锋(1979-), 男, 河北张家口人, 博士, 副研究员, 硕导, 主要从事复杂系统建模与可持续发展研究。E-mail: wufeng@igsnrr.ac.cn |
收稿日期: 2020-05-27
要求修回日期: 2021-03-04
网络出版日期: 2021-06-25
基金资助
国家自然科学基金项目(72042020)
版权
The effects of COVID-19 epidemic on regional economy and industry in China
Received date: 2020-05-27
Request revised date: 2021-03-04
Online published: 2021-06-25
Supported by
National Natural Science Foundation of China(72042020)
Copyright
科学评估重大突发公共卫生事件的经济系统影响,调控其负效应,提升经济系统韧性,是国家重要战略需求。目前,新型冠状病毒肺炎(COVID-19)疫情在中国得以有效遏制,而外源性输入与局部风险仍存,系统辨识其影响路径与作用强度,对经济系统恢复具有指导意义。基于改进的中国多区域一般均衡分析模型,测度了中国不同疫情风险等级区的经济与产业影响,模拟了生产资料供给和产品需求变化下产业经济发展趋势及受损程度。结果表明,宏观经济层面,2020年中国GDP相比常态损失约0.4%~0.8%,导致短期消费平均下降约2%,就业平均下降约0.7%,而物价平均上涨约0.9%。产业经济层面,疫情对消费型及劳动密集型产业短期冲击最大,如服务业产值相比常态下降6.3%。从疫情对产业经济系统的影响分区来看,受疫情影响冲击较大的省份是风险一级区湖北省,呈现出以湖北为中心向四周扩散的蔓延格局,而不同地区受损的主要产业存在显著差异。此外,复工复产和积极财政政策两类疫情应对情景下区域经济系统的恢复强度模拟结果显示,相较于有序复工复产,增加财政刺激政策对GDP的提升率高了0.3%,但物价水平上涨约1.8%,而复工复产举措拉动产业恢复的辐射空间范围更广。
吴锋 , 刘桂君 , 郭纳良 , 李志慧 , 邓祥征 . COVID-19疫情对中国区域经济及产业的影响[J]. 地理学报, 2021 , 76(4) : 1034 -1048 . DOI: 10.11821/dlxb202104017
To scientifically assess the effects of major public health emergencies on economic system, regulate its negative effect and improve the resilience of the economic system is an important national strategic requirement. Currently, the novel coronavirus disease (COVID-19) epidemic has been effectively contained in China, while exogenous and regional risks remain. Systematical identification of influence path and strength of COVID-19 epidemic on economic system has guiding significance for economic system recovery. Based on the improved multi-regional computable general equilibrium model for China, this research measures the output changes in economic system and major industries in China under different COVID-19 epidemic prevention and control scenarios with different changes in factors supply and products demand. The results show that the provincial economic growth in China falls by 0.4%-0.8% compared with the normal situation in 2020, and residential consumption and employment falls by about 2% and 0.7% respectively, while commodity prices rise by about 0.9% in the short term. From the perspective of industrial economy, consumption-oriented and labor-intensive industries are the most adversely affected in the short term. For example, the output value of the service sector will decrease by 6.3% compared with normal levels. Besides, regarding the regional differences of the effects of COVID-19 epidemic on the economic system and industrial economy, Hubei province, as one of the regions with first-level epidemic prevention and control risk, faces the greatest challenge. The effects of COVID-19 epidemic present a spatial spreading pattern with Hubei province as the center. The major industries that suffer from the impacts of COVID-19 epidemic vary in different regions. In addition, this research assesses the intensity of the regional economic recovery under the resumption of work and production scenario and the proactive fiscal policy scenario respectively. The results show that compared with the resumption of work and production, the effect of increasing fiscal stimulus has more potential for economic system recovery, up by 0.3% in GDP and by 1.8% in commodity price, while resumption of work and production has a wider range of spatial pulling effects on industries.
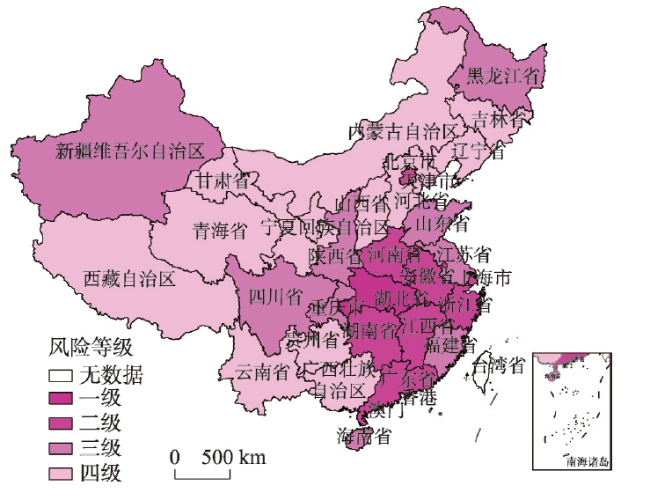
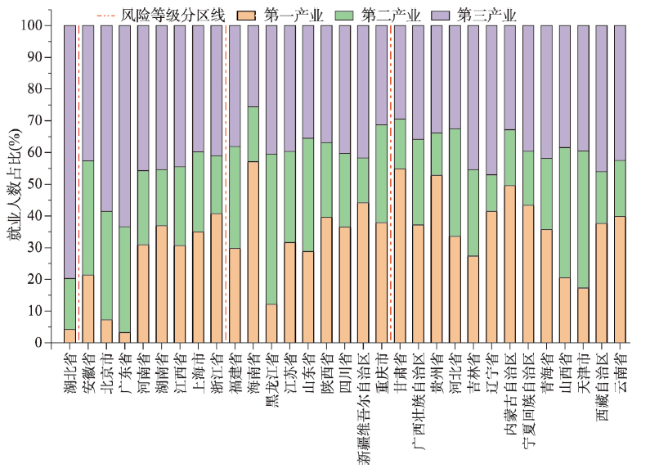
表1 中国各省(直辖市、自治区)COVID-19疫情防控风险分级各项指标统计Tab. 1 Statistics of indicators for COVID-19 epidemic prevention and control risk classification in China |
| 确诊人数 (人) | 总人口数 (万人) | 一级到二级(d) | 二级到三级(d) | 一级到三级(d) | 流出人口 占比(%) | 分级 | |
|---|---|---|---|---|---|---|---|
| 湖北省 | 68139 | 5917.00 | 99 | 44 | 143 | 0.00 | 1 |
| 广东省 | 1758 | 11346.00 | 32 | 75 | 107 | 8.07 | 2 |
| 浙江省 | 1278 | 5737.00 | 39 | 21 | 60 | 2.97 | 2 |
| 河南省 | 1276 | 9605.00 | 54 | 47 | 101 | 19.22 | 2 |
| 湖南省 | 1019 | 6898.83 | 47 | 21 | 68 | 16.82 | 2 |
| 安徽省 | 991 | 6323.60 | 32 | 19 | 51 | 6.74 | 2 |
| 北京市 | 935 | 2154.20 | 97 | 37 | 134 | 1.44 | 2 |
| 江西省 | 935 | 4647.59 | 48 | 8 | 56 | 7.86 | 2 |
| 上海市 | 913 | 2424.00 | 60 | 46 | 106 | 1.36 | 2 |
| 黑龙江省 | 948 | 3773.00 | 39 | 21 | 60 | 0.45 | 3 |
| 重庆市 | 583 | 3101.79 | 46 | 14 | 60 | 8.40 | 3 |
| 新疆维吾尔自治区 | 902 | 2487.00 | 31 | 11 | 42 | 0.24 | 3 |
| 江苏省 | 665 | 8050.70 | 31 | 32 | 63 | 3.84 | 3 |
| 山东省 | 831 | 10047.23 | 44 | 59 | 103 | 2.18 | 3 |
| 四川省 | 656 | 8341.00 | 33 | 28 | 61 | 4.14 | 3 |
| 福建省 | 384 | 3941.01 | 33 | 22 | 55 | 2.52 | 3 |
| 陕西省 | 373 | 3864.39 | 0 | 0 | 34 | 3.28 | 3 |
| 海南省 | 171 | 934.32 | 0 | 0 | 32 | 0.89 | 3 |
| 河北省 | 365 | 7556.29 | 97 | 37 | 134 | 1.87 | 4 |
| 内蒙古自治区 | 261 | 2533.98 | 0 | 0 | 31 | 0.26 | 4 |
| 天津市 | 230 | 1560.00 | 97 | 37 | 134 | 0.23 | 4 |
| 辽宁省 | 263 | 4358.99 | 0 | 0 | 28 | 0.46 | 4 |
| 广西壮族自治区 | 257 | 4925.99 | 0 | 0 | 31 | 1.86 | 4 |
| 山西省 | 203 | 3718.36 | 30 | 15 | 45 | 1.20 | 4 |
| 甘肃省 | 169 | 2637.27 | 0 | 0 | 27 | 0.71 | 4 |
| 云南省 | 199 | 4829.99 | 0 | 0 | 31 | 1.12 | 4 |
| 宁夏回族自治区 | 75 | 688.00 | 34 | 68 | 102 | 0.07 | 4 |
| 吉林省 | 157 | 2704.00 | 32 | 23 | 55 | 0.28 | 4 |
| 贵州省 | 147 | 3600.00 | 0 | 0 | 30 | 1.40 | 4 |
| 青海省 | 18 | 603.21 | 0 | 0 | 32 | 0.08 | 4 |
| 西藏自治区 | 1 | 344.00 | 36 | 22 | 58 | 0.02 | 4 |
表2 COVID-19疫情经济影响与适应性分析的情景设计与参数Tab. 2 Scenario design and parameters for economic impact and adaptation analysis of COVID-19 epidemic |
| 情景设计 | 影响 情景一 | 影响情景二 (+情景一) | 影响情景三 (+情景二) | 影响情景四 (+情景三) | 适应性情景一 (+情景四) | 适应性情景二 (+情景四) |
|---|---|---|---|---|---|---|
| 冲击条件 | 劳动供给 下降 | 交通管制 | 各地区产业需求下降一致: | 各地区出口商品减少幅度均等 | 企业复工复产 | 政府支出 |
| a.卫生与社会工作 | ||||||
| b.信息传输与技术 | ||||||
| c.住宿和餐饮 | ||||||
| d.批发和零售 | ||||||
| f.文娱 | ||||||
| 一级地区 | -3.20% | -53% | a.18.2% | -1% | 1.12% | 13.08% |
| b.9.7% | ||||||
| 二级地区 | -2.40% | -34% | c.-18.0% | -1% | 0.96% | 18.70% |
| 三级地区 | -1.60% | -30% | d.-7.5% | -1% | 0.64% | 15.00% |
| 四级地区 | -1.20% | -26% | f.-9.0% | -1% | 0.48% | 10.00% |
图5 不同疫情防控情景下影响的中国各省GDP变化情况Fig. 5 Rates of change in GDP of China by province under different COVID-19 epidemic prevention and control scenarios |
表3 不同疫情防控情景下GDP、CPI、就业、家庭消费、进口和出口变化率模拟结果(%)Tab. 3 Rates of change in GDP, CPI, employment rate, residential consumption, import, and export under different COVID-19 epidemic prevention and control scenarios (%) |
| 宏观指标 | GDP | CPI | 就业 | 家庭消费 | 进口 | 出口 |
|---|---|---|---|---|---|---|
| 一级地区 | Ⅰ-0.768 | Ⅰ1.101 | Ⅰ-1.387 | Ⅰ-2.575 | Ⅰ0.142 | Ⅰ-0.935 |
| Ⅱ-0.786 | Ⅱ1.243 | Ⅱ-1.381 | Ⅱ-2.432 | Ⅱ-0.331 | Ⅱ-0.939 | |
| Ⅲ-0.796 | Ⅲ1.113 | Ⅲ-1.339 | Ⅲ-2.710 | Ⅲ-0.544 | Ⅲ-0.734 | |
| Ⅳ-0.810 | Ⅳ1.010 | Ⅳ-1.347 | Ⅳ-2.178 | Ⅳ-0.686 | Ⅳ-0.744 | |
| 二级地区 | Ⅰ-0.546 | Ⅰ0.910 | Ⅰ-1.045 | Ⅰ-2.577 | Ⅰ0.035 | Ⅰ-0.644 |
| Ⅱ-0.546 | Ⅱ0.979 | Ⅱ-1.044 | Ⅱ-2.514 | Ⅱ-0.036 | Ⅱ-0.629 | |
| Ⅲ-0.514 | Ⅲ1.004 | Ⅲ-0.881 | Ⅲ-2.408 | Ⅲ0.100 | Ⅲ-0.456 | |
| Ⅳ-0.530 | Ⅳ0.897 | Ⅳ-0.894 | Ⅳ-1.860 | Ⅳ-0.041 | Ⅳ-0.465 | |
| 三级地区 | Ⅰ-0.356 | Ⅰ0.882 | Ⅰ-0.676 | Ⅰ-3.032 | Ⅰ0.142 | Ⅰ-0.527 |
| Ⅱ-0.355 | Ⅱ0.962 | Ⅱ-0.671 | Ⅱ-2.951 | Ⅱ0.060 | Ⅱ-0.519 | |
| Ⅲ-0.366 | Ⅲ0.755 | Ⅲ-0.573 | Ⅲ-3.194 | Ⅲ0.115 | Ⅲ-0.280 | |
| Ⅳ-0.378 | Ⅳ0.654 | Ⅳ-0.581 | Ⅳ-2.141 | Ⅳ-0.010 | Ⅳ-0.299 | |
| 四级地区 | Ⅰ-0.236 | Ⅰ0.870 | Ⅰ-0.479 | Ⅰ-3.073 | Ⅰ0.342 | Ⅰ-0.417 |
| Ⅱ-0.240 | Ⅱ0.929 | Ⅱ-0.478 | Ⅱ-3.021 | Ⅱ0.267 | Ⅱ-0.394 | |
| Ⅲ-0.284 | Ⅲ0.647 | Ⅲ-0.402 | Ⅲ-3.380 | Ⅲ0.256 | Ⅲ-0.077 | |
| Ⅳ-0.294 | Ⅳ0.549 | Ⅳ-0.408 | Ⅳ-2.216 | Ⅳ0.133 | Ⅳ-0.091 |
注:Ⅰ是影响情景一,Ⅱ是影响情景二,Ⅲ是影响情景三,Ⅳ是影响情景四;数据来源为TERM-China模型模拟结果。 |
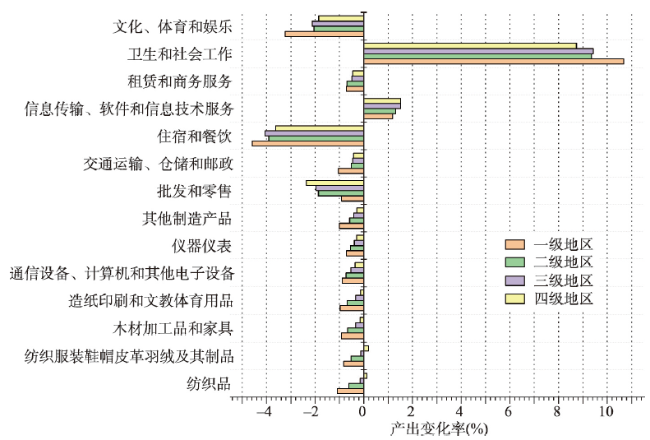
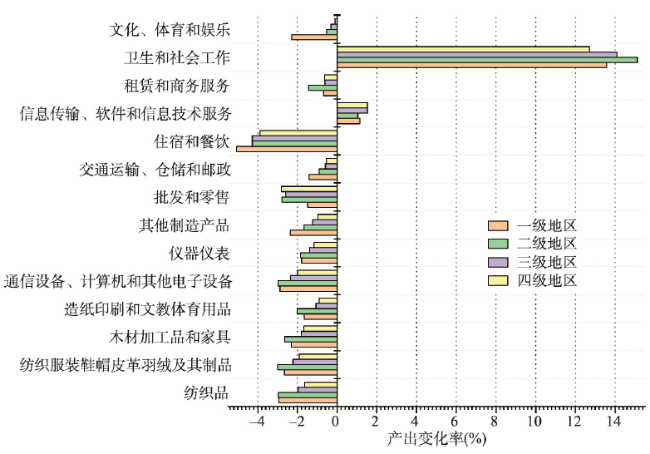
表4 不同疫情防控情景下影响的第二产业主要部门产出变化率模拟结果(%)Tab. 4 Rates of output change in major sectors of the secondary industry under different COVID-19 epidemic prevention and control scenarios (%) |
| 产业部门 | 一级地区 | 二级地区 | 三级地区 | 四级地区 |
|---|---|---|---|---|
| 纺织品 | Ⅰ-1.852 | Ⅰ-1.329 | Ⅰ-1.061 | Ⅰ-0.943 |
| Ⅱ-1.846 | Ⅱ-1.320 | Ⅱ-1.051 | Ⅱ-0.908 | |
| Ⅲ-1.708 | Ⅲ-1.105 | Ⅲ-0.527 | Ⅲ-0.179 | |
| Ⅳ-1.744 | Ⅳ-1.132 | Ⅳ-0.563 | Ⅳ-0.218 | |
| 纺织服装鞋帽皮革羽绒及其制品 | Ⅰ-1.283 | Ⅰ-1.105 | Ⅰ-0.896 | Ⅰ-0.732 |
| Ⅱ-1.134 | Ⅱ-1.066 | Ⅱ-0.860 | Ⅱ-0.662 | |
| Ⅲ-1.244 | Ⅲ-0.935 | Ⅲ-0.432 | Ⅲ-0.054 | |
| Ⅳ-1.264 | Ⅳ-0.959 | Ⅳ-0.465 | Ⅳ-0.086 | |
| 木材加工品和家具 | Ⅰ-1.316 | Ⅰ-0.981 | Ⅰ-0.712 | Ⅰ-0.600 |
| Ⅱ-1.303 | Ⅱ-0.972 | Ⅱ-0.708 | Ⅱ-0.577 | |
| Ⅲ-1.356 | Ⅲ-1.025 | Ⅲ-0.585 | Ⅲ-0.352 | |
| Ⅳ-1.380 | Ⅳ-1.045 | Ⅳ-0.611 | Ⅳ-0.379 | |
| 造纸印刷和文教体育用品 | Ⅰ-1.361 | Ⅰ-1.008 | Ⅰ-0.746 | Ⅰ-0.642 |
| Ⅱ-1.380 | Ⅱ-1.016 | Ⅱ-0.758 | Ⅱ-0.635 | |
| Ⅲ-1.411 | Ⅲ-1.056 | Ⅲ-0.595 | Ⅲ-0.353 | |
| Ⅳ-1.437 | Ⅳ-1.078 | Ⅳ-0.621 | Ⅳ-0.380 | |
| 通信设备、计算机和其他电子设备 | Ⅰ-1.291 | Ⅰ-1.152 | Ⅰ-0.957 | Ⅰ-0.790 |
| Ⅱ-1.259 | Ⅱ-1.157 | Ⅱ-0.962 | Ⅱ-0.785 | |
| Ⅲ-1.281 | Ⅲ-1.123 | Ⅲ-0.850 | Ⅲ-0.638 | |
| Ⅳ-1.338 | Ⅳ-1.168 | Ⅳ-0.893 | Ⅳ-0.662 | |
| 仪器仪表 | Ⅰ-1.128 | Ⅰ-0.954 | Ⅰ-0.804 | Ⅰ-0.719 |
| Ⅱ-1.154 | Ⅱ-0.965 | Ⅱ-0.819 | Ⅱ-0.730 | |
| Ⅲ-1.130 | Ⅲ-0.927 | Ⅲ-0.700 | Ⅲ-0.593 | |
| Ⅳ-1.137 | Ⅳ-0.936 | Ⅳ-0.705 | Ⅳ-0.590 | |
| 其他制造产品 | Ⅰ-1.385 | Ⅰ-0.880 | Ⅰ-0.730 | Ⅰ-0.602 |
| Ⅱ-1.409 | Ⅱ-0.876 | Ⅱ-0.728 | Ⅱ-0.590 | |
| Ⅲ-1.436 | Ⅲ-0.895 | Ⅲ-0.652 | Ⅲ-0.488 | |
| Ⅳ-1.484 | Ⅳ-0.921 | Ⅳ-0.681 | Ⅳ-0.511 |
注:Ⅰ是影响情景一,Ⅱ是影响情景二,Ⅲ是影响情景三,Ⅳ是影响情景四。 |
表5 不同疫情防控情景下影响的第三产业主要部门产出变化率模拟结果(%)Tab. 5 Rates of output change in major sectors of the tertiary industry under different COVID-19 epidemic prevention and control scenarios (%) |
| 产业部门 | 一级地区 | 二级地区 | 三级地区 | 四级地区 |
|---|---|---|---|---|
| 批发和零售 | Ⅰ-0.875 | Ⅰ-0.667 | Ⅰ-0.460 | Ⅰ-0.293 |
| Ⅱ-0.904 | Ⅱ-0.662 | Ⅱ-0.454 | Ⅱ-0.285 | |
| Ⅲ-1.213 | Ⅲ-2.117 | Ⅲ-2.134 | Ⅲ-2.478 | |
| Ⅳ-1.226 | Ⅳ-2.128 | Ⅳ-2.146 | Ⅳ-2.486 | |
| 交通运输、仓储和邮政 | Ⅰ-0.706 | Ⅰ-0.574 | Ⅰ-0.422 | Ⅰ-0.347 |
| Ⅱ-1.261 | Ⅱ-0.749 | Ⅱ-0.610 | Ⅱ-0.523 | |
| Ⅲ-1.277 | Ⅲ-0.727 | Ⅲ-0.598 | Ⅲ-0.531 | |
| Ⅳ-1.293 | Ⅳ-0.744 | Ⅳ-0.613 | Ⅳ-0.545 | |
| 住宿和餐饮 | Ⅰ-0.671 | Ⅰ-0.601 | Ⅰ-0.387 | Ⅰ-0.360 |
| Ⅱ-0.472 | Ⅱ-0.551 | Ⅱ-0.333 | Ⅱ-0.314 | |
| Ⅲ-4.833 | Ⅲ-4.146 | Ⅲ-4.221 | Ⅲ-3.770 | |
| Ⅳ-4.827 | Ⅳ-4.146 | Ⅳ-4.218 | Ⅳ-3.768 | |
| 信息传输、软件和 信息技术服务 | Ⅰ-0.419 | Ⅰ-0.330 | Ⅰ-0.177 | Ⅰ-0.118 |
| Ⅱ-0.407 | Ⅱ-0.314 | Ⅱ-0.160 | Ⅱ-0.108 | |
| Ⅲ1.034 | Ⅲ1.175 | Ⅲ1.433 | Ⅲ1.458 | |
| Ⅳ1.034 | Ⅳ1.173 | Ⅳ1.433 | Ⅳ1.458 | |
| 租赁和商务服务 | Ⅰ-0.927 | Ⅰ-0.840 | Ⅰ-0.582 | Ⅰ-0.514 |
| Ⅱ-0.970 | Ⅱ-0.858 | Ⅱ-0.605 | Ⅱ-0.529 | |
| Ⅲ-1.053 | Ⅲ-1.020 | Ⅲ-0.721 | Ⅲ-0.650 | |
| Ⅳ-1.054 | Ⅳ-1.029 | Ⅳ-0.724 | Ⅳ-0.655 | |
| 卫生和社会工作 | Ⅰ-0.180 | Ⅰ-0.139 | Ⅰ-0.026 | Ⅰ0.018 |
| Ⅱ0.144 | Ⅱ-0.049 | Ⅱ0.070 | Ⅱ0.100 | |
| Ⅲ10.606 | Ⅲ9.281 | Ⅲ9.406 | Ⅲ8.736 | |
| Ⅳ10.610 | Ⅳ9.283 | Ⅳ9.411 | Ⅳ8.740 | |
| 文化、体育和娱乐 | Ⅰ-0.610 | Ⅰ-0.717 | Ⅰ-0.471 | Ⅰ-0.390 |
| Ⅱ-0.425 | Ⅱ-0.702 | Ⅱ-0.447 | Ⅱ-0.367 | |
| Ⅲ-3.472 | Ⅲ-2.346 | Ⅲ-2.324 | Ⅲ-2.024 | |
| Ⅳ-3.457 | Ⅳ-2.341 | Ⅳ-2.316 | Ⅳ-2.016 |
注:Ⅰ是影响情景一,Ⅱ是影响情景二,Ⅲ是影响情景三,Ⅳ是影响情景四。 |
| [1] |
|
| [2] |
|
| [3] |
[ 曾春媛, 冯艳. 从SARS疫情看国民经济抗危机能力. 北京理工大学学报(社会科学版), 2004,6(4):13-15.]
|
| [4] |
[ 何诚颖, 闻岳春, 常雅丽, 等. 新冠病毒肺炎疫情对中国经济影响的测度分析. 数量经济技术经济研究, 2020,37(5):3-22.]
|
| [5] |
|
| [6] |
|
| [7] |
[ 黄益平. 新冠肺炎的经济影响与政策应对. 企业观察家, 2020(1):76-77.]
|
| [8] |
[ 唐文进, 廖荣荣, 刘静. 突发公共事件经济影响研究述评. 经济学动态, 2009(4):112-116.]
|
| [9] |
|
| [10] |
|
| [11] |
|
| [12] |
|
| [13] |
[ 王若兰. 新冠肺炎疫情对全球经济的影响及应对策略: 基于全球生产供应链视角. 国际金融, 2020(4):31-36.]
|
| [14] |
|
| [15] |
[ 孙久文. 新冠肺炎疫情对中国区域经济发展的影响初探. 区域经济评论, 2020(2):8-11.]
|
| [16] |
|
| [17] |
|
| [18] |
|
| [19] |
|
| [20] |
|
| [21] |
|
| [22] |
|
| [23] |
|
| [24] |
|
| [25] |
|
| [26] |
|
| [27] |
|
| [28] |
[ 周一鸣, 姜彩良. “非典”和新冠肺炎疫情对我国客货运输的影响比较与分析. 交通运输研究, 2020,6(1):24-32.]
|
| [29] |
[ 祝坤福, 高翔, 杨翠红, 等. 新冠肺炎疫情对全球生产体系的冲击和我国产业链加速外移的风险分析. 中国科学院院刊, 2020,35(3):283-288.]
|
| [30] |
|
| [31] |
|
| [32] |
|
| [33] |
|
| [34] |
|
| [35] |
|
| [36] |
|
| [37] |
|
| [38] |
[ 姜玲, 张伟, 刘宇. 基于多区域CGE模型的洪灾间接经济损失评估: 以长三角流域为例. 管理评论, 2016,28(6):25-31.]
|
| [39] |
|
| [40] |
[ 解伟, 李宁, 胡爱军, 等. 基于CGE模型的环境灾害经济影响评估: 以湖南雪灾为例. 中国人口·资源与环境, 2012,22(11):26-31.]
|
| [41] |
|
| [42] |
[ 李辉智, 易大莉, 李高明. 重庆市新型冠状病毒肺炎疫情风险分区分级评估方法比较研究. 重庆医科大学学报, 2020,45(7):870-875.]
|
| [43] |
[ 屠鸿薇, 钟若曦, 肖建鹏, 等. 广东省新型冠状病毒肺炎分区分级防控策略研究. 中国公共卫生, 2020,36(4):486-492.]
|
| [44] |
|
| [45] |
|
| [46] |
[ 周梅芳, 刘宇, 张金珠, 等. 新冠肺炎疫情的宏观经济效应及其应对政策有效性研究. 数量经济技术经济研究, 2020,37(8):24-41.]
|
| [47] |
[ 周健. 新冠肺炎疫情对交通运输行业的影响及政策建议. 交通运输研究, 2020,6(1):13-18.]
|
| [48] |
KPMG China. The impact of coVID-19 on China's macro economy. http://www.china-cer.com.cn/hongguanjingji/202002072162.html, 2020-02-27.
[ 毕马威中国. 新冠肺炎疫情对中国宏观经济的影响. http://www.china-cer.com.cn/hongguanjingji/202002072162.html, 2020-02-27.]
|
| [49] |
[ 王维, 李孜沫, 王晓伟. 长江经济带产业协同发展格局研究. 管理现代化, 2017,37(1):23-25.]
|
/
| 〈 |
|
〉 |
