气候变化与地表过程

过去1500 a亚洲夏季风降水的强迫特征

  • 王志远 , 1 ,
  • 王江林 2 ,
  • 贾佳 1 ,
  • 刘健 3
展开
  • 1.浙江师范大学地理与环境科学学院,金华 321004
  • 2.中国科学院西北生态环境资源研究院 沙漠与沙漠化重点实验室,兰州 730000
  • 3.南京师范大学地理科学学院 虚拟地理环境教育部重点实验室,南京 210003

王志远(1984-), 男, 内蒙古通辽人, 博士, 讲师, 主要从事全球环境变化与古气候模拟研究。E-mail:

收稿日期: 2020-01-04

  要求修回日期: 2020-10-14

  网络出版日期: 2021-05-25

基金资助

国家自然科学基金项目(41901095)

版权

版权所有,未经授权,不得转载、摘编本刊文章,不得使用本刊的版式设计。

The forced response of Asian summer monsoon precipitation during the past 1500 years based on the CESM

  • WANG Zhiyuan , 1 ,
  • WANG Jianglin 2 ,
  • JIA Jia 1 ,
  • LIU Jian 3
Expand
  • 1. College of Geography and Environmental Science, Zhejiang Normal University, Jinhua 321004, Zhejiang, China
  • 2. Key Laboratory of Desert and Desertification, Northwest Institute of Eco-Environment and Resources, CAS, Lanzhou 730000, China
  • 3. Key Laboratory for Virtual Geographic Environment of Ministry of Education, School of Geography Science, Nanjing Normal University, Nanjing 210023, China

Received date: 2020-01-04

  Request revised date: 2020-10-14

  Online published: 2021-05-25

Supported by

National Natural Science Foundation of China(41901095)

Copyright

Copyright reserved © 2020

摘要

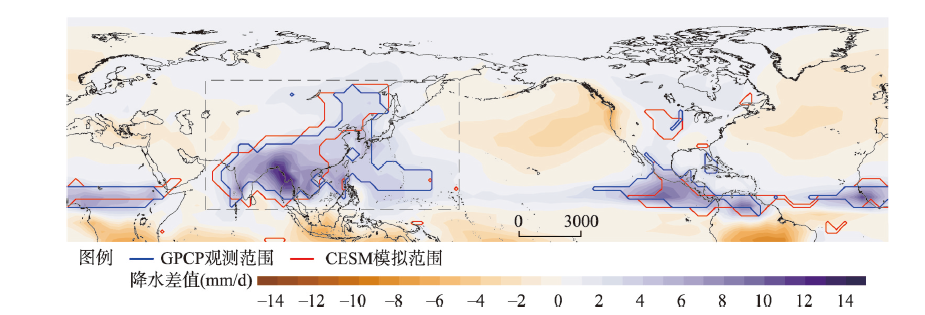
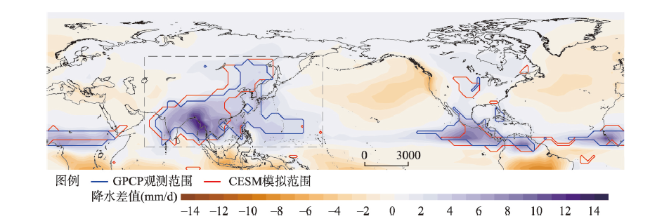
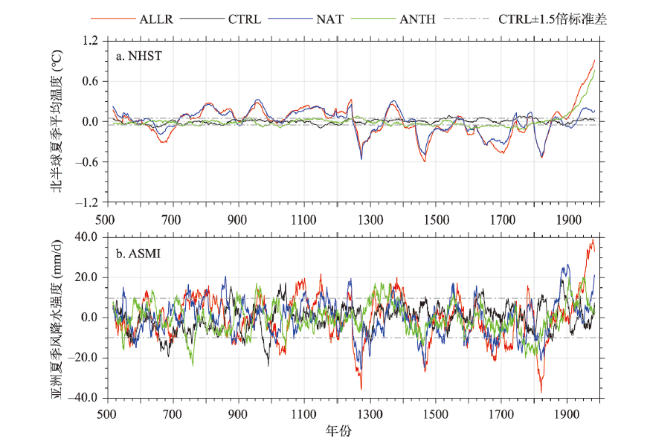
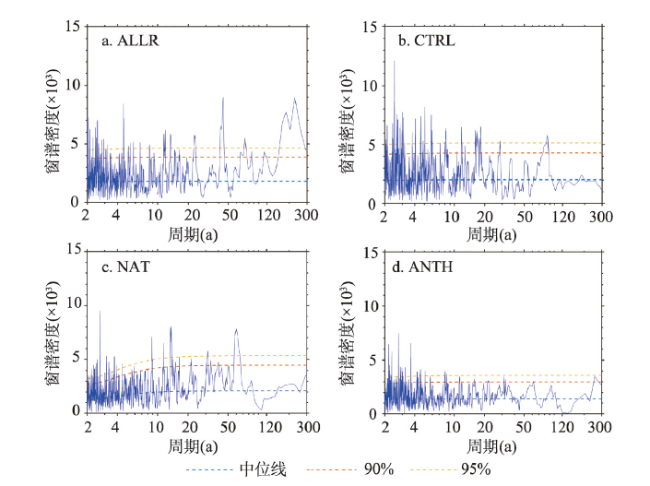
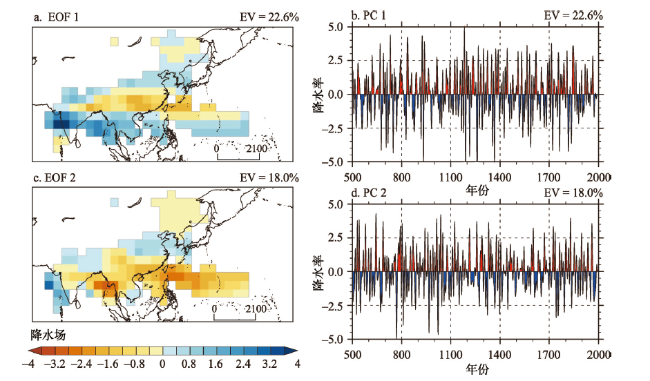
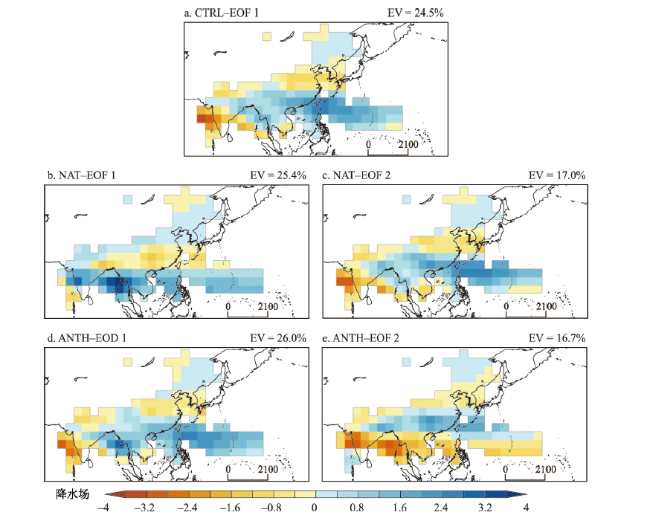
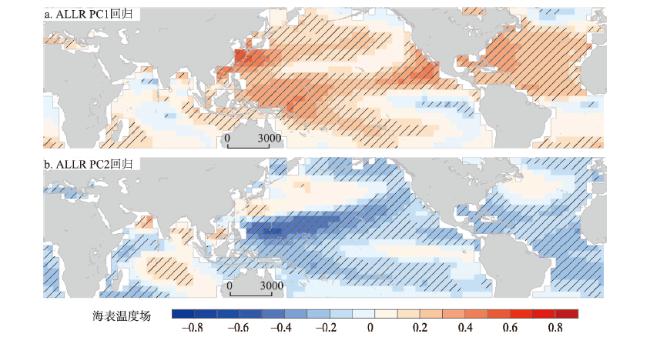
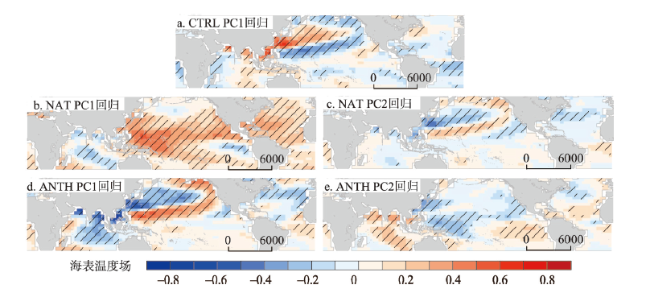
基于通用地球系统模式(CESM)进行了4组长达1500 a的模拟试验(全强迫试验,控制试验,自然外强迫试验和人类活动外强迫试验)。在评估模式模拟亚洲夏季风降水可靠性的基础上,对模拟结果进行10~100 a的带通滤波以获取年代—百年际亚洲夏季风降水信号。主要结论为:① 过去1500 a亚洲夏季风降水强度存在显著的约15 a、25 a、40 a和70 a的年代—百年际周期信号;② 年代—百年际亚洲夏季风降水的主要时空变化模态表现为外强迫模态和气候系统内部变化模态;③ 过去1500 a亚洲夏季风降水的强迫模态表现为经向“三明治”结构,即中国北方季风区和热带季风区同向变化,而在东亚中纬度一带季风降水反向变化特征。这种降水的空间分布模态主要由自然外强迫(太阳辐射+火山活动)作用所导致。本文为历史时期亚洲季风降水变化的研究提供了材料支撑,为全球变暖背景下亚洲季风降水演变提供参考。

本文引用格式

王志远 , 王江林 , 贾佳 , 刘健 . 过去1500 a亚洲夏季风降水的强迫特征[J]. 地理学报, 2021 , 76(3) : 550 -565 . DOI: 10.11821/dlxb202103005

Abstract

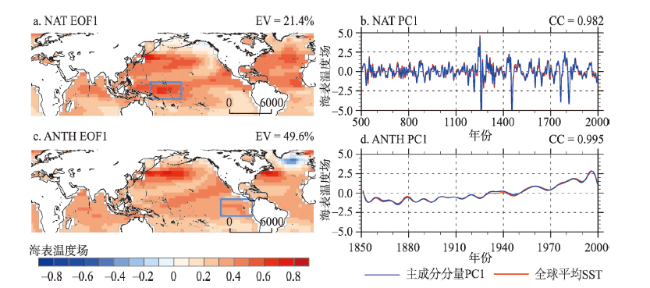
Asian summer monsoon (ASM), one of the key elements of the global climate system, strongly affects food production and security of most people over Asia. However, the characteristics and the forcing drivers of the ASM system at decadal to centennial time scales remain unclear. To address these issues, we report four 1500-a long climate model simulations based on the Community Earth System Model (CESM), including full-forced run (ALLR), control run (CTRL), natural run (NAT), and anthropogenic run (ANTH). After evaluating the performances of the CESM in simulating ASM precipitation, a 10-100 bandpass filter is applied to obtain the decadal-centennial signals in ASM precipitation. The main conclusions are as follows: (1) the variation of ASM intensity shows significant decadal to centennial periodicities in the ALLR, such as ~15, ~25, ~40 and ~70 years. (2) The major spatial-temporal distributions of ASM precipitation in the ALLR show an external forced mode and a climate internal variability mode. (3) The leading forced mode of ASM precipitation is mainly affected by natural forcing over the past 1500 years and characterizes a meridional spatial 'triple' mode. In the NAT (solar irradiation and volcanic eruptions), the substantial warming (cooling) over the western tropical Pacific enhances (or reduces) the SST gradient change in the tropical Pacific and modifies the ASM rainfall distribution. Our findings contribute to a better understanding of the ASM in the past and provide implications for future projections of the ASM under global warming.

1 引言

可靠而稳定的淡水资源是粮食生产和人类生存的重要保障[1,2]。季风作为中低纬度重要的环流系统,为全球大部分地区提供淡水补给,其中亚洲季风更是全球季风系统重要的组成部分[3],影响了全球约60%的人口[4]。因此,研究亚洲季风区的降水特征与机制,有助于预测未来情景下亚洲季风降水的发展规律。
现阶段,学者们已针对亚洲季风的各个子系统的变化特征展开研究,包括东亚季风区[5,6,7]、印度季风区(或南亚季风区)[8,9,10]和西北太平洋季风区[11,12]。观测/再分析资料揭示了1870年以来,亚洲季风降水的年际和年代际变化特征[13,14,15,16,17];来自亚洲季风区域和临近海域的多种气候代用资料重建了东亚季风降水[18,19,20,21]和印度季风降水[22,23,24,25]的多百年、千年甚至轨道尺度上的变化特征。不仅对东亚夏季风降水的水汽来源问题进行了探究[26,27],也在不同时间尺度上对东亚夏季风与印度夏季风的位相关系等现象进行深入分析[28,29]。然而,由于高分辨率的时空重建资料和气候模拟资料相对匮乏,未能深入理解亚洲季风降水的年代—百年际尺度变化特征及规律,这仍是当前所面临的科学难题之一[30]
自2000年以来,随着过去1000~2000 a高分辨率气候代用资料的发表,亚洲季风降水的年代—百年际变化特征,特别是夏季风降水对强迫因子的响应备受关注。在年代—百年际尺度上,亚洲季风降水变化与外强迫因子关系密切[31,32],且在亚洲季风各个子系统的降水变化中都可以检测出自然外强迫[33,34,35]和气候系统内部变率[36,37]的信号。谱分析结果亦表明,东亚[39,40,41,42,43]和印度[44,45,46]夏季风降水与太阳辐射以及年代—多年代际气候系统内部振荡[34, 47-49]的周期特征相一致。此外,部分研究表明人类活动亦对亚洲夏季风降水强度有显著影响,相对于千年平均结果,主要受人类活动影响的“现代暖期”(1850年以来)夏季风降水强度较高,但在近百年来的夏季风降水强度呈现年代际减弱现象[32, 50-51]。然而,气候代用资料虽然较好地表现了亚洲夏季风降水的年代—百年际变化特征和影响因素,但对机理分析上相对乏力。因此,足够时间长度的气候模拟结果必不可少。
2013年第三阶段的古气候模拟比较计划(Paleoclimate Modelling Intercomparison Project Phase Ⅲ, PMIP3)过去千年时段试验完成,亚洲季风气候的机理研究得以快速发展。研究显示在年代—百年际尺度上,“现代暖期”全球平均降水较过去千年显著增加[52],这种现象同样也反映到亚洲夏季风降水强度变化上[53],即随着温室气体浓度升高,亚洲夏季风各个子系统的降水强度都有所增加[54]。另外,在亚洲季风区域内,年代—多年代际热带夏季风降水强度对自然外强迫(太阳辐射+火山活动)的响应没有人类活动外强迫敏感[55];热带以外区域的夏季风降水变化对自然外强迫的响应则更为敏感[56,57]。这表明亚洲/东亚夏季风降水变化具有一定的纬度依赖性[58,59]。然而,亦有研究表明,外强迫因子并没有对季风降水起到决定性作用[60],气候系统内部振荡,例如太平洋年代际涛动(Pacific Decadal Oscillation, PDO)[61]、北大西洋多年代际振荡(Atlantic Multidecadal Oscillation/variability, AMO/AMV)[56, 62-63]和北大西洋涛动(North Atlantic Oscillation)等[64],与季风降水变率更具相关性。综上所述,亚洲季风降水变化对不同气候强迫因子的响应并不一致,特别是人类活动在其中的作用也备受争议[65,66]。此外,上述研究大都关注于亚洲季风系统的重要组成部分上,对其整体研究相对缺乏,这不利于在大视野下窥察整个亚洲季风系统的变化特征及驱动机制。
20世纪90年代以来全球季风概念逐渐被提出和完善。Webster[67]首先提出了全球季风的概念,并展示了全球季风的影响范围。此后,全球季风开始被当作一个系统进行研究,向外长波辐射[12]、风速[68]、亮温[69]等气候指标都被用来定义全球季风的范围及强度,但其定义仅适用于现代器测时期的全球季风变化的研究,并不能广泛地应用到古气候研究领域当中。随后Wang等[70]提出了利用降水指标划分全球季风区域的方法,不仅更为方便地研究现代全球季风的变化特征,同时也使现代全球季风与古全球季风的研究方法相统一,可以更好地探究不同时期不同时间尺度上全球季风的发展过程。
综上所述,由于历史时期亚洲季风区域高分辨率空间重建资料较少,且PMIP3过去千年模拟结果多为全强迫试验结果,缺乏自然强迫和人类活动试验结果。因此,本文基于通用地球系统模式(Community Earth System Model, CESM)的4组试验被设计用于研究过去1500 a来年代—百年际亚洲季风的变化规律,揭示亚洲季风降水的年代—百年际时空特征及其强迫模态的主要影响因素。

2 模式和试验

2.1 模式描述

本文使用通用地球系统模式CESM进行历史时期的气候模拟试验,模式包括大气模型(CAM4)、海洋模型(POP2)、陆面模型(CLM4)和海冰模型(CICE2),各个模型通过NCAR开发的中央耦合器(CPL7)进行变量间交换。模拟试验中大气模型和陆面模型的空间分辨率都为3.75°×3.75°;海洋模型为纬向116格点×经向110格点的非规则分配,且越靠近赤道地区格点分布越密集。试验中各个模块更为详细的物理过程和基本的参数设置可参考文献[71,72]。
本文共设计4组模拟试验:控制试验(Control Run, CTRL)、全强迫试验(Full Forced Run, ALLR)、自然外强迫试验(Natural Forced Run, NAT)和人类活动外强迫试验(Anthropogenic Forced Run, ANTH)。其中CTRL为1850年外强迫条件下(为减少spin-up时长,轨道参数设置为1990年)的平衡态试验;ALLR是在轨道参数(Orbital Parameters, Orb)、总太阳辐照度(Total Solar Irradiation, TSI)、火山活动(Volcanic Eruption, VOL)、温室气体浓度(Greenhouse Gases, GHGs)、土地利用和覆盖(Land Use and Land Cover, LULC)共同驱动下的瞬变积分模拟试验;NAT是在TSI和VOL共同驱动下的瞬变积分模拟试验,其他条件同CTRL设置;ANTH是在GHGs和LULC共同驱动下的瞬变积分模拟试验,其他条件同CTRL设置。模拟试验的积分时长和驱动设置条件具体如表1所示。
表1 本文4组试验的具体设置

Tab. 1 Details of experimental design

序号 试验名称 强迫条件(年份) 时间(a)
全称 简称 TSI VOL GHGs LULC Orb
1 控制试验 CTRL 1850 1850 1850 1850 1990 1~2000
2 全强迫试验 ALLR 1~2000
3 自然外强迫试验 NAT 1850 1850 1990 1~2000
4 人类活动外强迫试验 ANTH 1850 1850 1990 1~2000

注:强迫条件中的年份表示使用当年的外强迫条件驱动模型;√表示使用连续变化的外强迫条件驱动模型,其中TSI、VOL、GHGs、LULC和Orb分别来自文献[73,74,75,76,77]。

本文所使用外强迫因子的变化特征可参考文献[72]。其中,主要温室气体浓度(CO2、CH4、N2O)的重建结果与PMIP3的推荐设置相一致[78],主要来自于过去2000 a的冰芯重建资料[75];在TSI强迫资料的选取上,前人研究表明较小的太阳活动振幅对EASM强度影响较小[46],所以本试验选用Shapiro等[73]利用宇宙同位素重建的过去2000 a的TSI序列,这也是PMIP3过去千年时段模拟推荐选用的最大振幅变化TSI重建资料(太阳活动的蒙德极小期与现代比值约为0.4%)[79];火山强迫资料采用Gao等[74]利用冰芯提取的过去1500 a硫酸盐资料重建结果(501—2000年);相比之下[80],LULC选用Kaplan等根据人口特征重建的全球0.5°×0.5°格点资料[76];轨道参数设置采用Berger的计算结果。
总而言之,主要外强迫条件中,LULC和VOL为格点重建资料,Orb、GHGs和TSI为全球平均资料。最后,由于进行模拟试验时,未能找到公开发表的过去2000 a高分辨率火山活动重建资料,所以涉及到火山强迫的模拟试验(ALLR和NAT)结果,前500 a(1—500年)火山气溶胶含量均设置为0 W/m2。为了科学严谨,本文只截取所有试验结果的最后1500 a(501—2000年)进行分析。

2.2 模拟结果的可靠性验证

模式模拟结果的可靠性验证是本文进行的重要基础。前期研究已经验证了模式在模拟全球平均气候态和气候系统内部变率的可靠性[81]。同时,在对过去1000~2000 a全球/半球/区域的气候变化研究上,模拟结果与气候重建资料亦较为一致[72, 82-88]。以上成果都为本文结论的可靠性创造了前提条件。因此,为避免重复,本文仅对CESM模拟的亚洲季风区域进行说明和验证。
本文对亚洲季风区域的划定参考Wang等[70]对全球季风区的定义,即年平均降水量大于2 mm/d,且夏季降水量占全年降水量的55%以上,其中北半球夏季为5—9月,南半球夏季为11—次年3月。图1为根据上述定义利用观测资料(粗蓝线)和CESM全强迫试验结果(粗红线)描绘的北半球夏季风区域范围,其中黑色虚线框内为本文关注的亚洲季风区域范围。由图1可见,CESM较好地描绘了北半球季风区域,但在模拟西北太平洋季风区时表现出明显不足,即模拟结果未能达到全球季风定义中的夏季风降水量标准,以至相对于观测资料,模拟结果未能完全刻画出西北太平洋季风区范围,这也是现阶段众多模式存在的共性问题[89]。虽然模拟结果与观测资料在西北太平洋区域模拟有所偏差,但是模拟区域的降水变率较为一致[81, 85],这并不影响本文探讨亚洲夏季风降水变率问题。因此,本文仍以观测资料所刻画的亚洲夏季风区域为研究区域(黑虚线框内的粗蓝线实线范围),定义夏季为5—9月平均,亚洲夏季风强度为亚洲季风区域内各个格点的夏季降水率之和(不同纬度降水需乘以权重系数)。前人研究表明,这一指标在各个时间尺度上都具有一定的代表性[90,91],可以用于表征夏季风降水强度。最后,为表述简便,文中将亚洲夏季风简称为ASM(Asian Summer Monsoon);亚洲夏季风强度简称为ASMI(Asian Summer Monsoon Intensity);东亚夏季风简称为EASM(Eastern Asian Summer Monsoon);印度(或南亚)夏季风简称ISM(Indian Summer Monsoon);北半球平均地表温度简称为NHST(Northern Hemisphere Surface Temperature);海洋表层温度简称为SST(Sea Surface Temperature)。如不做特殊说明,文中提及的季风降水,均指代夏季风降水;距平参考时段均为501—2000年平均。
图1 1979—2000年北半球夏季风区范围及夏季与冬季降水差值

Fig. 1 Northern Hemisphere Summer Monsoon (NHSM) domain and the mean MJJAS-minus-NDJFM precipitation using the GPCP data from 1979 to 2000

3 过去1500 a亚洲夏季风降水强度变化特征

图2为模拟的过去1500 a的NHST和ASMI距平变化特征(数据经过31 a滑动平均处理)。ALLR结果显示(图2b,红线),ASMI在1600—1900年相对较低,而在750—850年、1050—1150年和1900—2000年相对较高,这与NHST变化特征较为一致(图2a,红线,相关系数为0.74,有效自由度为31,P < 0.05),即ASMI相对较弱时期对应着过去千年的“小冰期”时段;相对较强时期则对应于过去千年的“中世纪暖期”和“现代暖期”时段。ASMI和NHST的一致性变化在NAT(相关系数为0.56,有效自由度为24,P < 0.05)和ANTH(相关系数为0.28,有效自由度为41,P < 0.05)中均有所体现,而在CTRL试验中未表现出显著相关性(相关系数为0.16,有效自由度为38,P > 0.1)。由于CTRL为固定外强迫条件下的平衡态模拟试验,多用来表征气候系统内部的反馈作用[88]。因此,ASMI的多年代际变化特征受外强迫因子影响较大。然而,在外强迫因子的影响下,ALLR、ANTH和NAT试验中ASMI的变幅并没有普遍超出其自然振幅(图2b,灰色虚线,为CTRL中ASMI的±1.5倍标准差)的阈值范围,只在较强外强迫影响下才发生显著振幅变化(如“小冰期”和“现代暖期”),这与NHST振幅对外强迫因子的响应状况不同。各个强迫试验的NHST变幅均显著增加,仅ANTH的NHST在工业革命前期与CTRL结果相当,主要原因是由于驱动因子(GHGs和LULC)在工业革命以前数值变化较小;工业革命后期,由于人类活动影响加剧,NHST快速增温,并与ALLR的NHST变化相一致(图2a)。总而言之,过去1500 a的ASMI多年代际变化受外强迫因子影响较大,存在“暖湿—冷干”的变化特征,但其振幅变化主要受气候系统的调制作用。
图2 过去1500 a CESM模拟的北半球夏季平均地表气温和亚洲夏季风降水强度变化

注:所有数据经过31 a滑动平均处理。

Fig. 2 The multidecadal-scale variations of the Northern Hemisphere surface temperature (NHST) and Asian summer monsoon intensity (ASMI) over the past 1500 years

通过对过去1500 a的ASMI进行多窗谱(multi-taper method, MTM)分析可以发现(图3a),ALLR的ASMI存在约2~9 a的高频信号,以及约15 a、25 a、40 a、70 a和220 a的显著周期信号(超过95%的置信水平)。其中,约2~9 a、15 a、25 a和70 a的信号与CTRL中ASMI的MTM结果相一致(图3b)。此外,这种周期特征也在NAT(图3c)和ANTH(图3d)中有所体现,表明这些显著的周期特征并没有因为外强迫因子的加入而改变。前人研究发现,厄尔尼诺—南方涛动(El Niño-Southern Oscillation, ENSO)存在典型3~9 a和10~25 a周期特征[93],ENSO引起的赤道太平洋SST变化亦是影响季风降水的主要原因之一[94,95]。因此,上述周期特征可能为气候系统内部作用所致,且可能受ENSO的调制作用。
图3 亚洲夏季风降水强度的多窗谱模拟分析

Fig. 3 MTM spectral density of the AMSIs derived from the ALLR, CTRL, NAT, and ANTH

ASMI在ALLR和CTRL中的周期信号差异则可能来自于外强迫的影响。ALLR中ASMI(图3a)存在约40 a的显著周期信号,这在CTRL(图3b)和ANTH(图3d)中的ASMI谱分析结果中并没有体现,但在NAT试验(图3c)中重现了这一周期特征(达到90%置信水平),表明这一周期信号特征可能与自然外强迫关系密切。此外,在ANTH中也没有刻画出约40 a和70 a的显著周期信号,可能是由于人类活动强迫因子并没有显著的周期特征,而只表现出明显的非线性趋势特征,从而抑制了ASMI的多年代际周期信号。综上所述,过去1500 a的ASMI存在显著的年代—百年际周期信号,且主要为气候系统内部反馈和自然外强迫因子共同作用所致。

4 年代—百年际ASM降水的主模态特征

为获取过去1500 a年代—百年际ASM降水的主要模态特征,首先将ASM区域内所有格点降水率进行10~100 a的Butterworth带通滤波;其次将滤波后的结果进行经验正交函数(Empirical Orthogonal Function, EOF)分解。图4为过去1500 a的ALLR年代—百年际ASM降水EOF分解后的主要特征模态(图4a、4c)及其对应的主成分向量(图4b、4d)。其中ASM降水的EOF第一模态(EOF1)和第二模态(EOF2)的解释方差分别为22.6%和18.0%,并通过North显著性检验[96]
图4 ALLR模拟的过去1500 a亚洲夏季风降水的EOF模态特征及其主成分向量

注:所有数据结果经过10~100 a带通滤波和标准化处理;EV为解释方差。

Fig. 4 The first two EOF modes of the ASM variation over the past 1500 years

年代—百年际ASM降水的EOF1模态(图4a)在中国北方和热带季风区域,如西北太平洋季风区和印度季风区的大部分地区等,表现为同向变化特征,季风降水变化中心出现在印度季风区西部;而在中纬度的东亚季风区,包括青藏高原以东—中国南方大部—台湾省区一带,降水变化与其他季风区域反相。由此可见,在东亚季风区表现为南北反向的偶极子模态,而在印度和西北太平洋季风区表现为基本全区一致的变化特征,这种EASM降水的型态特征与其动力机制相一致,而与热带季风变化机制不同[57]。总体来说,过去1500 a年代—百年际ASM降水主要表现为经向“三明治”结构。EOF2模态(图4c)表现为华北平原区域和印度季风区北部降水同向变化;而中国东北地区、西北太平洋季风区、中国南方地区、孟加拉湾以及印度南部地区的降水反相变化,即EASM降水主要呈现经向“三明治”的分布模态,在ISM降水呈现东西“偶极子”模态。前人研究推测EASM降水的经向“三明治”分布型态很可能是气候系统内部变率所致[97]。因此,ASM的年代—百年际降水表现出了2种不同主模态特征。

5 年代—百年际ASM的强迫模态和气候系统内部振荡模态

为鉴别过去1500 a年代—百年际ASM降水主要模态的成因,同样对CTRL、NAT和ANTH的ASM降水进行EOF分解(与ALLR相同,数据经过10~100 a带通滤波,文中所有讨论模态均经过North显著检验[96]),以获取相应试验的年代—百年际ASM降水的主模态特征。如图5所示,ALLR的EOF1(图4a)与NAT的EOF1(图5c)及ANTH的EOF2(图5e)的降水空间分布特征较为一致,空间相关系数分别为0.83和-0.98(P < 0.05);而ALLR-EOF1与CTRL的EOF1(图5a)并不显著相关。如前所述,CTRL为固定外强迫因子的模拟试验,主要表征气候系统内部自然变率。因此,ALLR-EOF1可能为强迫模态,即自然外强迫和人类活动共同作用所致。然而,ALLR的EOF2(图4c)与CTRL-EOF1的空间分布特征较为相似(空间相关系数为-0.86,P < 0.05),表明ALLR-EOF2的ASM降水空间分布很可能主要由气候系统内部变率所致,而受外强迫因子影响较小。同样,NAT的EOF2(图5c)和ANTH的EOF1(图5d)都表现出了与CTRL-EOF1相似的ASM空间降水变化特征(空间相关系数分别为0.92和0.98,P < 0.05),说明气候系统的内部反馈作用亦是影响过去1500 a代—百年际ASM降水分配的主要原因之一,且这种降水模态特征不会因为自然和人类活动外强迫因子的加入而改变或消失。
图5 亚洲季风降水的EOF特征模态模拟

注:所有数据结果经过10~100 a带通滤波和标准化处理。

Fig. 5 The EOF spatial patterns of the ASM precipitation variations over the past 1500 years

6 ASM降水强迫模态的可能影响机制

要想进一步确定过去1500 a年代—百年际ASM降水的主要分布型态(图4a、4c),还需要从影响机制上验证。研究表明,SST型态特征是影响ASM降水模态和强度变化的最主要原因之一[3, 92, 98]。因此,可通过ASM降水的对应主成分向量(简称PC)回归到相应试验的SST场来探究其对应关系。图6为通过ALLR的PC(图4b、4d)回归的SST场分布特征。ALLR-EOF1降水分布对应于全球一致变暖(或变冷、图6a)的SST分布特征,其中热带和亚热带太平洋SST对ALL-EOF1降水模态的相应更为敏感,特别在西太平洋暖池区域SST显著变暖(或变冷、P < 0.1);赤道东太平洋SST则表现为显著变冷(或变暖、P < 0.1)。这种赤道太平洋地区SST梯度增加(或降低)导致Walker环流加强(或减弱),而Walker环流强度在年代—多年代际尺度上都与全球降水关系密切[99]。对于热带季风区,海陆温差和赤道辐合带(Intertropical Convergence Zone,ITCZ)的位置变化是影响其季风降水强度的主要原因之一[92]。此外,赤道太平洋地区的海—汽环流异常也可以直接影响西北太平洋季风区域降水,即SST增高(或降低)导致蒸发量升高(或下降),区域对流运动加强(或减弱),致使区域降水强度增加(或减少)。另外,由于海陆热容性差异,外强迫引起的海陆温度差异加大(或减小),也可以改变水汽传输作用,这也是季风降水增加(减少)的主要原因之一[58];对于中纬度东亚季风区域,区域季风降水变化主要取决于ITCZ[100]和副热带高压带[92]的位置,而副热带高压的西伸位置可影响中国南方降水强度[101]。这种季风降水的分布型态已被观测/再分析资料在多种时间尺度上验证过[6]
图6 全强迫试验ASM降水的主成分向量回归的海表温度场变化

注:数据经过标准化处理。

Fig. 6 Regressed summer SST patterns onto ALLR-PC1 and ALLR-PC2 over the past 1500 years. Black slash denotes values passing a 10% significance level

同样,本文也验证了CTRL、NAT和ANTH试验结果(与ALLR相同,利用各试验ASM降水的PC回归到各自试验的SST场)。由图7可知,ALLR的PC2回归的SST场(图6b)与CTRL的PC1回归的SST场(图7a)具有较高空间一致性。除此之外,NAT的PC2和ANTH的PC1的各自回归的SST空间模态(图7c和7d)亦都与CTRL PC1回归的SST场相似,这充分表明ALLR-EOF2、NAT-EOF2和ANTH-EOF1为气候系统内部原因所致。而ALLR PC1回归的SST空间分布与NAT PC1的回归结果(图7b)较为一致(空间相关系数为0.85,P < 0.05),都表现为赤道西太平洋SST显著增暖(或变冷),而与ANTH PC2回归的SST场表现相反(图7e)。在ANTH试验中,回归的SST场表现为赤道东太平洋SST显著变暖(或变冷),而西太平洋SST与之相反。然而,这种SST分布模态是否为自然变化和人类活动所致?
图7 ASM降水的主成分向量回归的海表温度场变化

注:a为控制试验;b、c为自然强迫试验;d、e为人类活动试验。

Fig. 7 Regressed summer SST patterns onto CTRL-PC1, NAT-PC1, NAT-PC2, ANTH-PC1 and ANTH-PC2

由于温度对外强迫因子的响应更为敏感(图2a),所以对NAT和ANTH的SST场进行EOF分解来检验自然和人类活动外强迫因子对其贡献。对过去1500 a的NAT的SST场进行EOF分解(图8a),主模态向量的解释方差可达21.4%(数据经过10~100 a滤波处理,经过North显著性检验)。EOF1分布表现为全球一致的SST变化特征,且PC1与NAT全球平均SST基本一致(图8b,相关系数为0.982,P < 0.05,数据经过10~100 a滤波处理),说明NAT SST的EOF1模态为自然强迫影响下的分布模态;对比NAT PC1回归的SST场(图7b)可以发现,其具有显著的空间相关性,都表现为SST场较为一致的变化特征,且在赤道西太平洋暖池区域SST变化(图8a,蓝色方框)对自然外强迫因子的响应异常敏感[52, 99]。ANTH中,由于工业革命以前人类活动影响较小,所以选取ANTH的1851—2000年的SST场进行EOF分解。随着人类活动影响的增加,主特征模态(EOF1,解释方差为49.6%)亦表现为全球SST一致变暖的状况(图8c),但与NAT结果不同,在赤道太平洋区域SST梯度不变或较弱(图8c,蓝色方框),即赤道东太平洋SST对人类活动的影响更为敏感[83, 102],且其PC向量表现为上升趋势,亦与其全球平均SST相一致(图8d,相关系数为0.995,P < 0.05)。前人研究表明,NAT和ANTH的SST EOF1模态均为外强迫影响下的模态特征[103,104,105]。此外,本文也对ANTH的1851—2000年的ASM降水进行EOF分解,其主模态特征与ALLR的ASM降水EOF1并不一致。由此可见,相对于人类活动影响,ASM降水的强迫模态对自然强迫因子的变化更为敏感,这也与其他模拟研究结论相一致[52]。因此,过去1500 a的年代—百年际ASM降水强迫模态主要为自然强迫因子所致。
图8 模拟的海表温度的主特征模态及其主成分向量

注:a、c中蓝框分别为热带太平洋暖池区域和东太平洋区域;EV为解释方差;CC为相关系数。

Fig. 8 The leading spatial structures and corresponding PCs derived from the NAT over the past 1500 years (a, b) and the ANTH over the past 150 years (c, d)

7 讨论和结论

年代—百年际气候变化主要由自然强迫和人类活动共同作用所致。本文首先利用Butterworth带通滤波对亚洲季风区域降水进行10~100 a滤波处理,并通过EOF分析获取其年代—百年际亚洲季风降水的主要模态特征。结果发现ASM降水的年代—百年际变化特征主要分为强迫模态(EOF1)和气候系统内部变率模态(EOF2)。强迫模态表现为ASM降水分布呈现中国北部季风区和热带季风区降水同向变化,而中纬度东亚季风区降水反向变化的特征,即“三明治”结构;PC1回归的SST场表现为全球一致变暖(或变冷),海汽蒸发量增加(或减少),导致区域季风降水量增加(或减少),由于季风陆地和邻近海域的温差加大(或减小),导致海陆温度差异加大(或减小),致使季风增强(或减弱)。此外,热带太平洋水平SST梯度变化,也是影响ASM降水强度和型态变化的主要原因之一[52]。这些变化特征在NAT中也有所体现,但在ANTH中没有,说明自然外强迫是影响过去1500 a年代—百年际ASM降水强迫模态的主要原因。前人研究亦表明,过去千年多年代际全球平均地表气温受人类活动影响(温室气体浓度)较大[106],但在亚洲季风降水的空间型态上并没有体现。这可能表示一定强度的人类活动只对亚洲季风降水强度有所影响[54],但对其空间分布型态影响较小。
因此,本文主要结论如下:
(1)ASMI变化基本表现为“暖湿”和“冷干”的变化特征,且存在约2~9 a、15 a、 25 a、40 a、70 a和220 a的显著周期特征,其中一些周期,如约2~9 a、15 a、25 a、70 a等,在CTRL结果中也有所体现。
(2)年代—百年际ASM降水的主要时空模态分为外强迫模态和气候系统内部振荡模态。外强迫模态表现为中国北方季风区与热带季风区同向变化,而中纬度东亚季风区一带反向变化的经向“三明治”结构。
(3)ASM的外强迫模态主要为自然外强迫因子所致:在自然外强迫影响下,SST呈现一致性变化。此外,赤道西太平洋暖期变暖(或变冷),而赤道东太平洋变冷(或变暖),增加了热带太平洋SST梯度,从而增加了局地季风降水,改变ASM降水分配模态。
最后,本文尝试将亚洲季风系统作为一个整体,以不同视角探讨年代—百年际亚洲季风降水的主要强迫模态和影响因素。本文虽然仅对亚洲季风降水做定性探讨并加以对比前人研究成果,但也验证了CESM模拟亚洲季风降水的可靠性。然而,气候模拟结果本应该进行定量化分析,为未来长尺度气候变化提供科学参考。因此,未来工作将关注于定量化区分外强迫因子(如TSI和VOL等)与气候系统内部变率(如AMV[107]和PDO[108]等)对亚洲季风降水的贡献。
[1]
Biemans H, Speelman L H, Ludwig F, et al. Future water resources for food production in five South Asian river basins and potential for adaptation: A modeling study. Science of the Total Environment, 2013,468/469:S117-S131.

DOI

[2]
Ahmed F, Al-Amin A Q, Mohamad Z F , et al. Agriculture and food security challenge of climate change: A dynamic analysis for policy selection. Scientia Agricola, 2016,73(4):311-321.

DOI

[3]
Wang P X, Wang B, Cheng H, et al. The global monsoon across time scales: Mechanisms and outstanding issues. Earth-Science Reviews, 2017,174:84-121.

DOI

[4]
Wang B. The Asian Monsoon. Berlin: Springer Berlin Heidelberg, 2006: 32.

[5]
Ding Y H, Johnny C. The East Asian summer monsoon: An overview. Meteorology and Atmospheric Physics, 2005,89(1-4):117-142.

DOI

[6]
Ding Y H, Wang Z Y, Sun Y. Inter-decadal variation of the summer precipitation in East China and its association with decreasing Asian summer monsoon. Part I: Observed evidences. International Journal of Climatology, 2008,28(9):1139-1161.

DOI

[7]
Ding Y, Sun Y, Wang Z Y, et al. Inter-decadal variation of the summer precipitation in China and its association with decreasing Asian summer monsoon Part II: Possible causes. International Journal of Climatology, 2009,29(13):1926-1944.

DOI

[8]
Kripalani R H, Kumar P. Northeast monsoon rainfall variability over south peninsular India vis-à-vis the Indian Ocean dipole mode. International Journal of Climatology, 2004,24(10):1267-1282.

DOI

[9]
Chen T C, Yoon J H. Interannual variation in Indochina summer monsoon rainfall: Possible mechanism. Journal of Climate, 2000,13(11):1979-1986.

DOI

[10]
Qian Y F, Wang S Y, Shao H. A possible mechanism effecting the earlier onset of southwesterly monsoon in the South China Sea compared to the Indian monsoon. Meteorology and Atmospheric Physics, 2001,76(3/4):237-249.

DOI

[11]
Wang B, LinHo. Rainy season of the Asian-Pacific summer monsoon. Journal of Climate, 2002,15(4):386-398.

DOI

[12]
Wang B. Climatic regimes of tropical convection and rainfall. Journal of Climate, 1994,7(7):1109-1118.

DOI

[13]
Goswami B N. Interdecadal change in potential predictability of the Indian summer monsoon. Geophysical Research Letters, 2004,31(16):L16208. DOI: 10.1029/2004GL020337.

DOI

[14]
Gao H, Jiang W, Li W J. Changed relationships between the East Asian summer monsoon circulations and the summer rainfall in Eastern China. Journal of Meteorological Research, 2014,28(6):1075-1084.

DOI

[15]
Wang B, Wu Z W, Li J P, et al. How to measure the strength of the East Asian summer monsoon. Journal of Climate, 2008,21(17):4449-4463.

DOI

[16]
Pal J, Chaudhuri S, Roychowdhury A, et al. An investigation of the influence of the southern annular mode on Indian summer monsoon rainfall. Meteorological Applications, 2017,24(2):172-179.

DOI

[17]
Krishnamurthy L, Krishnamurthy V. Decadal scale oscillations and trend in the Indian monsoon rainfall. Climate Dynamics, 2014,43(1/2):319-331.

DOI

[18]
Chen R, Shen J, Li C H, et al. Mid- to late-Holocene East Asian summer monsoon variability recorded in lacustrine sediments from Jingpo Lake, Northeastern China. The Holocene, 2015,25(3):454-468.

DOI

[19]
Li J F, Liu X Q. Orbital- and suborbital-scale changes in the East Asian summer monsoon since the last deglaciation. The Holocene, 2018,28(8):1216-1224.

DOI

[20]
Lu F Z, Ma C M, Zhu C, et al. Variability of East Asian summer monsoon precipitation during the Holocene and possible forcing mechanisms. Climate Dynamics, 2019,52(1/2):969-989.

DOI

[21]
Jia J, Lu H, Wang Y J, et al. Variations in the iron mineralogy of a loess section in Tajikistan during the mid-Pleistocene and late Pleistocene: Implications for the climatic evolution in Central Asia. Geochemistry, Geophysics, Geosystems, 2018,19(4):1244-1258.

[22]
Cai Y, Fung I Y, Edwards R L, et al. Variability of stalagmite-inferred Indian monsoon precipitation over the past 252000 y. PNAS, 2015,112(10):2954-2959.

DOI PMID

[23]
Srivastava P, Agnihotri R, Sharma D, et al. 8000-year monsoonal record from Himalaya revealing reinforcement of tropical and global climate systems since mid-Holocene. Scientific Reports, 2017,7(1):14515. DOI: 10.1038/s41598-017-15143-9.

DOI PMID

[24]
Joshi L M, Kotlia B S, Ahmad S M, et al. Reconstruction of Indian monsoon precipitation variability between 4.0 and 1.6 ka BP using speleothem δ18O records from the Central Lesser Himalaya, India. Arabian Journal of Geosciences, 2017,10(16):365. DOI: 10.1007/s12517-017-3141-7.

DOI

[25]
Kotlia B S, Singh A K, Joshi L M, et al. Precipitation variability in the Indian Central Himalaya during last ca. 4, 000 years inferred from a speleothem record: Impact of Indian Summer Monsoon (ISM) and Westerlies. Quaternary International, 2015,371:244-253.

DOI

[26]
Jiang Z H, Jiang S, Shi Y, et al. Impact of moisture source variation on decadal-scale changes of precipitation in North China from 1951 to 2010. Journal of Geophysical Research: Atmospheres, 2017,122(2):600-613.

DOI

[27]
Liu J B, Chen S Q, Chen J H, et al. Chinese cave δ18O records do not represent northern East Asian summer monsoon rainfall. PNAS, 2017,114(15):E2987-E2988. DOI: 10.1073/pnas.1703471114.

DOI PMID

[28]
Wang B, Wu R G, Lau K M. Interannual variability of the Asian summer monsoon: Contrasts between the Indian and the Western North Pacific-East Asian monsoons. Journal of Climate, 2001,14(20):4073-4090.

DOI

[29]
Wang Y, Liu X Q, Herzschuh U. Asynchronous evolution of the Indian and East Asian Summer Monsoon indicated by Holocene moisture patterns in monsoonal central Asia. Earth-Science Reviews, 2010,103(3/4):135-153.

[30]
Wang B. Thrusts and prospects on understanding and predicting Asian monsoon climate. Journal of Meteorological Research, 2008,22(4):383-403.

[31]
Wang Y B, Cheng H, Edwards R L, et al. The Holocene Asian monsoon: Links to solar changes and North Atlantic climate. Science, 2005,308(5723):854-857.

DOI PMID

[32]
Zhang P Z, Cheng H, Edwards R L, et al. A test of climate, sun, and culture relationships from an 1810-year Chinese cave record. Science, 2008,322(5903):940-942.

DOI PMID

[33]
Liu J B, Chen F H, Chen J H, et al. Weakening of the East Asian summer monsoon at 1000-1100 A.D. within the Medieval Climate Anomaly: Possible linkage to changes in the Indian Ocean-western Pacific. Journal of Geophysical Research: Atmospheres, 2014,119(5):2209-2219.

DOI

[34]
Shi F, Fang K Y, Xu C X, et al. Interannual to centennial variability of the South Asian summer monsoon over the past millennium. Climate Dynamics, 2017,49(7/8):2803-2814.

DOI

[35]
Shi F, Zhao S, Guo Z Tv, et al. Multi-proxy reconstructions of May-September precipitation field in China over the past 500 years. Climate of the Past, 2017,13(12):1919-1938.

DOI

[36]
Shi H, Wang B, Cook E R, et al. Asian summer precipitation over the past 544 years reconstructed by merging tree rings and historical documentary records. Journal of Climate, 2018,31(19):7845-7861.

DOI

[37]
Shi H, Wang B. How does the Asian summer precipitation-ENSO relationship change over the past 544 years? Climate Dynamics, 2019,52(7/8):4583-4598.

DOI

[38]
Tan L C, Cai Y J, Cheng H, et al. Summer monsoon precipitation variations in central China over the past 750 years derived from a high-resolution absolute-dated stalagmite. Palaeogeography, Palaeoclimatology, Palaeoecology, 2009,280(3/4):432-439.

DOI

[39]
Zheng J Y, Wang W C, Ge Q S, et al. Precipitation variability and extreme events in Eastern China during the past 1500 years. Terrestrial, Atmospheric and Oceanic Sciences, 2006,17(3):579. DOI: 10.3319/TAO.2006.17.3.579(A).

DOI

[40]
Tan L C, Cai Y J, Cheng H, et al. Centennial- to decadal-scale monsoon precipitation variations in the upper Hanjiang River region, China over the past 6650 years. Earth and Planetary Science Letters, 2018,482:580-590.

DOI

[41]
Hao Z X, Zheng J Y, Zhang X Z, et al. Spatial patterns of precipitation anomalies in eastern China during centennial cold and warm periods of the past 2000 years. International Journal of Climatology, 2016,36(1):467-475.

DOI

[42]
Yang B, Wang J L, Liu J J. A 1556 year-long early summer moisture reconstruction for the Hexi Corridor, Northwestern China. Science China Earth Sciences, 2019,62(6):953-963.

DOI

[43]
Yang B, Kang S Y, Ljungqvist F C, et al. Drought variability at the northern fringe of the Asian summer monsoon region over the past millennia. Climate Dynamics, 2014,43(3/4):845-859.

DOI

[44]
Agnihotri R, Dutta K, Bhushan R, et al. Evidence for solar forcing on the Indian monsoon during the last millennium. Earth and Planetary Science Letters, 2002,198(3/4):521-527.

DOI

[45]
Gu Y S, Liu H Y, Traoré D D, et al. ENSO-related droughts and ISM variations during the last millennium in tropical southwest China. Climate Dynamics, 2020,54(1/2):649-659.

DOI

[46]
Yamada K, Kohara K, Ikehara M, et al. The variations in the East Asian summer monsoon over the past 3 kyrs and the controlling factors. Scientific Reports, 2019,9(1):5036. DOI: 10.1038/s41598-019-41359-y.

DOI PMID

[47]
Shi H, Wang B, Liu J, et al. Decadal-multidecadal variations of Asian Summer rainfall from the Little Ice Age to the Present. Journal of Climate, 2019,32(22):7663-7674.

DOI

[48]
Wang J L, Yang B, Ljungqvist F C, et al. The relationship between the Atlantic Multidecadal Oscillation and temperature variability in China during the last millennium. Journal of Quaternary Science, 2013,28(7):653-658.

DOI

[49]
Wang J L, Yang B, Qin C, et al. Spatial patterns of moisture variations across the Tibetan Plateau during the past 700 years and their relationship with Atmospheric Oscillation modes. International Journal of Climatology, 2014,34(3):728-741.

DOI

[50]
Gupta A K, Das M, Anderson D M. Solar influence on the Indian summer monsoon during the Holocene. Geophysical Research Letters, 2005,32(17):L17703. DOI: 10.1029/2005GL022685.

[51]
Shi F, Li J, Wilson R J. A tree-ring reconstruction of the South Asian summer monsoon index over the past millennium. Scientific Reports, 2014,4:6739. DOI: 10.1038/srep06739.

DOI PMID

[52]
Liu J, Wang B, Cane M A, et al. Divergent global precipitation changes induced by natural versus anthropogenic forcing. Nature, 2013,493(7434):656-659.

DOI

[53]
Dong L, Zhou T J. The Indian ocean sea surface temperature warming simulated by CMIP5 models during the twentieth century: Competing forcing roles of GHGs and anthropogenic aerosols. Journal of Climate, 2014,27(9):3348-3362.

DOI

[54]
Lee J-Y, Wang B. Future change of global monsoon in the CMIP5. Climate Dynamics, 2014,42(1/2):101-119.

DOI

[55]
Burke C, Stott P. Impact of anthropogenic climate change on the East Asian summer monsoon. Journal of Climate, 2017,30(14):5205-5220.

DOI

[56]
Li S L, Perlwitz J, Quan X W, et al. Modelling the influence of North Atlantic multidecadal warmth on the Indian summer rainfall. Geophysical Research Letters, 2008,35(5):L05804. DOI: 10.1029/2007GL032901.

[57]
Liu J, Wang B, Wang H L, et al. Forced response of the East Asian summer rainfall over the past millennium: Results from a coupled model simulation. Climate Dynamics, 2011,36(1/2):323-336.

DOI

[58]
Man W M, Zhou T J, Jungclaus J H. Simulation of the East Asian summer monsoon during the last millennium with the MPI earth system model. Journal of Climate, 2012,25(22):7852-7866.

DOI

[59]
Shi J, Yan Q, Jiang D B, et al. Precipitation variation over eastern China and arid central Asia during the past millennium and its possible mechanism: Perspectives from PMIP3 experiments. Journal of Geophysical Research: Atmospheres, 2016,121(20):11989-12004.

DOI

[60]
Li J P, Wu Z W, Jiang Z H, et al. Can global warming strengthen the East Asian summer monsoon? Journal of Climate, 2010,23(24):6696-6705.

DOI

[61]
Qian C, Zhou T J. Multidecadal variability of North China aridity and its relationship to PDO during 1900-2010. Journal of Climate, 2014,27(3):1210-1222.

DOI

[62]
Lu R Y, Dong B W, Ding H. Impact of the Atlantic Multidecadal Oscillation on the Asian summer monsoon. Geophysical Research Letters, 2006,33(24):L24701. DOI: 10.1029/2006GL027655.

DOI

[63]
Luo F F, Li S L, Gao Y Q, et al. The connection between the Atlantic Multidecadal Oscillation and the Indian summer monsoon in CMIP5 models. Climate Dynamics, 2018,51(7/8):3023-3039.

DOI

[64]
Wu Z W, Wang B, Li J P, et al. An empirical seasonal prediction model of the East Asian summer monsoon using ENSO and NAO. Journal of Geophysical Research: Atmospheres, 2009,114(D18):D18120. DOI: 10.1029/2009JD011733.

DOI

[65]
Kumar K K, Rajagopalan B, Cane M A. On the weakening relationship between the Indian monsoon and ENSO. Science, 1999,284(5423):2156-2159.

DOI PMID

[66]
Zhou Xin, Guo Zhengtang, Qin Li. Natural and anthropogenic impacts on the Asian monsoon precipitation during the 20th century. Scientia Sinica (Terrae), 2010,40(12):1718-1724.

[ 周鑫, 郭正堂, 秦利. 近百年来自然和人为因素对亚洲季风降水影响的时间序列分析研究. 中国科学: 地球科学, 2010,40(12):1718-1724.]

[67]
Webster P. The elementary monsoon//Fein J S, Stephens P L. Monsoons. New York: Wiley Interscience, 1987: 3-32.

[68]
Trenberth K E, Stepaniak D P, Caron J M. The global monsoon as seen through the divergent atmospheric circulation. Journal of Climate, 2000,13(22):3969-3993.

DOI

[69]
Qian W H. Dry/wet alternation and global monsoon. Geophysical Research Letters, 2000,27(22):3679-3682.

DOI

[70]
Wang B, Ding Q H. Global monsoon: Dominant mode of annual variation in the tropics. Dynamics of Atmospheres and Oceans, 2008,44(3/4):165-183.

DOI

[71]
Kay J E, Deser C, Phillips A, et al. The Community Earth System Model (CESM) large ensemble project: A community resource for studying climate change in the presence of internal climate variability. Bulletin of the American Meteorological Society, 2015,96(8):1333-1349.

DOI

[72]
Wang Z Y, Wang J L, Zhang S J. Variations of the global annual mean surface temperature during the past 2000 years: Results from the CESM1. Theoretical and Applied Climatology, 2019,137(3/4):2877-2887.

DOI

[73]
Shapiro A I, Schmutz W, Rozanov E, et al. A new approach to the long-term reconstruction of the solar irradiance leads to large historical solar forcing. Astronomy & Astrophysics, 2011,529:A67. DOI: 10.1051/0004-6361/201016173.

[74]
Gao C C, Robock A, Ammann C. Volcanic forcing of climate over the past 1500 years: An improved ice core-based index for climate models. Journal of Geophysical Research: Atmospheres, 2008,113(D23):D23111. DOI: 10.1029/2008JD010239.

DOI

[75]
MacFarling Meure C, Etheridge D, Trudinger C, et al. Law Dome CO2, CH4 and N2O ice core records extended to 2000 years BP. Geophysical Research Letters, 2006,33(14):L14810. DOI: 10.1029/2006GL026152.

DOI

[76]
Kaplan J O, Krumhardt K M, Ellis E C, et al. Holocene carbon emissions as a result of anthropogenic land cover change. The Holocene, 2011,21(5):775-791.

DOI

[77]
Berger A. Long-term variations of daily insolation and quaternary climatic changes. Journal of the Atmospheric Sciences, 1978,35(12):2362-2367.

DOI

[78]
Bothe O, Jungclaus J H, Zanchettin D. Consistency of the multi-model CMIP5/PMIP3-past1000 ensemble. Climate of the Past, 2013,9(6):2471-2487.

DOI

[79]
Schmidt G A, Jungclaus J H, Ammann C M, et al. Climate forcing reconstructions for use in PMIP simulations of the Last Millennium (v1.1). Geoscientific Model Development, 2012,5(1):185-191.

DOI

[80]
Yan M, Wang Z Y, Kaplan J O, et al. Comparison between reconstructions of global anthropogenic land cover change over past two millennia. Chinese Geographical Science, 2013,23(2):131-146.

DOI

[81]
Wang Z Y, Li Y, Liu B, et al. Global climate internal variability in a 2000-year control simulation with Community Earth System Model (CESM). Chinese Geographical Science, 2015,25(3):263-273.

DOI

[82]
Liu F, Li J B, Wang B, et al. Divergent El Niño responses to volcanic eruptions at different latitudes over the past millennium. Climate Dynamics, 2018,50(9/10):3799-3812.

DOI

[83]
Ning L, Liu J, Wang Z Y, et al. Different influences on the tropical Pacific SST gradient from natural and anthropogenic forcing. International Journal of Climatology, 2018,38(4):2015-2028.

DOI

[84]
Sun W Y, Liu J, Wang B, et al. A "La Niña-like" state occurring in the second year after large tropical volcanic eruptions during the past 1500 years. Climate Dynamics, 2019,52(12):7495-7509.

DOI

[85]
Liu F, Chai J, Wang B, et al. Global monsoon precipitation responses to large volcanic eruptions. Scientific Reports, 2016,6:24331. DOI: 10.1038/srep24331.

DOI PMID

[86]
Yan M, Liu J, Wang Z. Global climate responses to land use and land cover changes over the past two millennia. Atmosphere, 2017,8(12):64. DOI: 10.3390/atmos8040064.

DOI

[87]
Sun W Y, Liu J, Wang Z Y. Simulation of centennial-scale drought events over eastern China during the past 1500 years. Journal of Meteorological Research, 2017,31(1):17-27.

DOI

[88]
Chai J, Liu F, Liu J, et al. Enhanced global monsoon in Present Warm Period due to natural and anthropogenic forcings. Atmosphere, 2018,9(4):136. DOI: 10.3390/atmos9040136.

DOI

[89]
He C, Zhou T J. The two interannual variability modes of the Western North Pacific Subtropical High simulated by 28 CMIP5-AMIP models. Climate Dynamics, 2014,43(9/10):2455-2469.

DOI

[90]
Wang B, Liu J, Kim H J, et al. Recent change of the global monsoon precipitation (1979-2008). Climate Dynamics, 2012,39(5):1123-1135.

DOI

[91]
Wang B, Liu J, Kim H J, et al. Northern Hemisphere summer monsoon intensified by mega-El Nino/southern oscillation and Atlantic multidecadal oscillation. PNAS, 2013,110(14):5347-5352.

DOI PMID

[92]
Liu J, Wang B, Yim S Y, et al. What drives the global summer monsoon over the past millennium? Climate Dynamics, 2012,39(5):1063-1072.

DOI

[93]
Diaz H F, Markgraf V. El Niño and the Southern Oscillation:Multiscale Variability and Global and Regional Impacts. Cambridge: Cambridge University Press, 2000:1-14.

[94]
Wang B, Li J, He Q. Variable and robust East Asian monsoon rainfall response to El Niño over the past 60 years (1957-2016). Advances in Atmospheric Sciences, 2017,34(10):1235-1248.

DOI

[95]
Wang B, Li J, Cane M A, et al. Toward predicting changes in the land monsoon rainfall a decade in advance. Journal of Climate, 2018,31(7):2699-2714.

DOI

[96]
North G R, Bell T L, Cahalan R F, et al. Sampling errors in the estimation of Empirical Orthogonal Functions. Monthly Weather Review, 1982,110(7):699-706.

DOI

[97]
Huang R H, Wu Y F. The influence of ENSO on the summer climate change in China and its mechanism. Advances in Atmospheric Sciences, 1989,6(1):21-32.

DOI

[98]
Wang P X, Wang B, Cheng H, et al. The global monsoon across timescales: Coherent variability of regional monsoons. Climate of the Past, 2014,10(6):2007-2052.

DOI

[99]
Clement A C, Seager R, Cane M A, et al. An ocean dynamical thermostat. Journal of Climate, 1996,9(9):2190-2196.

DOI

[100]
Wang P X. Global monsoon in a geological perspective. Chinese Science Bulletin, 2009,54(7):1113-1136.

[101]
Matsumura S, Horinouchi T. Pacific Ocean decadal forcing of long-term changes in the western Pacific subtropical high. Scientific Reports, 2016,6(1):37765. DOI: 10.1038/srep37765.

DOI

[102]
Vecchi G A, Soden B J, Wittenberg A T, et al. Weakening of tropical Pacific atmospheric circulation due to anthropogenic forcing. Nature, 2006,441(7089):73-76.

DOI PMID

[103]
Folland C K, Parker D E, Colman A W, et al. Large Scale Modes of Ocean Surface Temperature since the Late Nineteenth Century. Berlin: Springer, 1999: 73-102.

[104]
Wu B, Zhou T J, Li T. Impacts of the Pacific-Japan and circumglobal teleconnection patterns on the interdecadal variability of the East Asian summer monsoon. Journal of Climate, 2016,29(9):3253-3271.

DOI

[105]
Dong L, Zhou T, Dai A, et al. The footprint of the inter-decadal Pacific Oscillation in Indian Ocean sea surface temperatures. Scientific Reports, 2016,6:21251. DOI: 10.1038/srep21251.

DOI PMID

[106]
Schurer A P, Tett S F B, Hegerl G C . Small influence of solar variability on climate over the past millennium. Nature Geoscience, 2014,7(2):104-108.

DOI

[107]
Wang J L, Yang B, Ljungqvist F C, et al. Internal and external forcing of multidecadal Atlantic climate variability over the past 1200 years. Nature Geoscience, 2017,10(7):512-517.

DOI

[108]
Ratna S B, Osborn T J, Joshi M, et al. Identifying teleconnections and multidecadal variability of East Asian surface temperature during the last millennium in CMIP5 simulations. Climate of the Past, 2019,15(5):1825-1844.

DOI

文章导航

/