
基于POI的土地利用与轨道交通客流的空间特征
|
彭诗尧(1996-), 女, 四川人, 硕士, 研究方向为城市轨道交通客流与土地利用。E-mail: 17120865@bjtu.edu.cn |
收稿日期: 2019-07-08
要求修回日期: 2020-10-28
网络出版日期: 2021-04-25
基金资助
中央高校基本科研业务费专项资金(2019JBM034)
国家自然科学基金项目(71621001)
国家自然科学基金项目(71890972/71890970)
版权
Spatial characteristics of land use based on POI and urban rail transit passenger flow
Received date: 2019-07-08
Request revised date: 2020-10-28
Online published: 2021-04-25
Supported by
Fundamental Research Funds for the Central Universities(2019JBM034)
National Natural Science Foundation of China(71621001)
National Natural Science Foundation of China(71890972/71890970)
Copyright
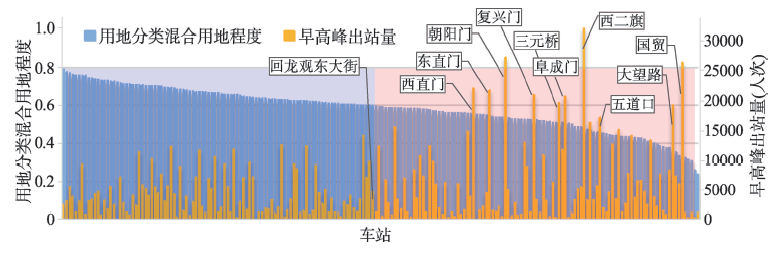
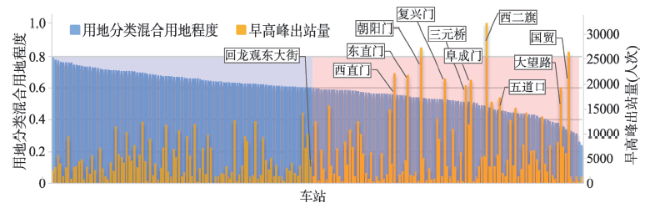
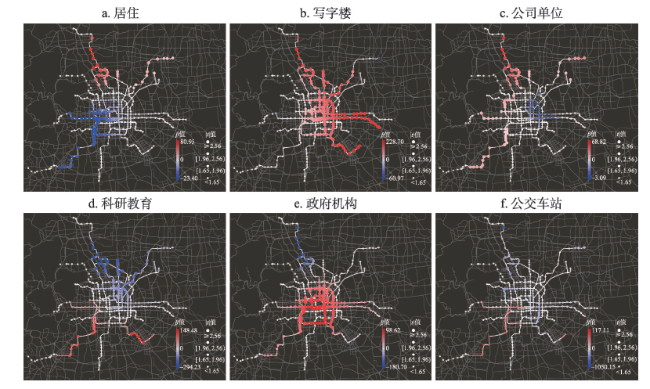
城市轨道交通及其沿线土地一体化发展是城市可持续发展的关键问题。提高城市轨道交通可持续性和土地资源配置合理性的关键需掌握轨道交通客流与土地功能之间的依赖关系,而回归分析是研究二者关系的主要方法。既有研究对于土地利用的描述多基于用地面积等概略数据,难以揭示各类属性的用地对客流的影响机理及其空间效应。采用百度地图POI数据以刻画用地信息,提出城市轨道交通车站吸引范围内用地功能的细粒度描述方法,基于全局常参数和局部变参数的回归模型研究车站早高峰出站客流与粗细粒度土地利用的相互依赖关系及其空间效应。针对北京地铁的案例研究表明:车站出站客流与不同功能用地及POI的依赖程度和空间特征存在显著差异。早高峰出站客流更多地受到与就业通勤相关的商业服务业设施用地、公共管理与公共服务用地的影响。在细粒度层面上,出站客流对写字楼和政府机构的依赖性更大,二者显著分布在就业岗位密集的中心城区功能分区和城市核心区。基于细粒度POI的局部变参数模型能较好地识别各类土地利用对车站客流的影响及其空间异质性,案例研究表明车站客流与土地利用的依赖关系是各类属性功能用地影响及其空间效应的叠加。
彭诗尧 , 陈绍宽 , 许奇 , 牛家祺 . 基于POI的土地利用与轨道交通客流的空间特征[J]. 地理学报, 2021 , 76(2) : 459 -470 . DOI: 10.11821/dlxb202102015
The integrated development of urban rail transit and land use nearby is one of the most important issues for sustainable development of cities. To improve the sustainability of urban rail transit and the rationality of land resource allocation, it is of great importance to understand the dependence relationship between passenger flow of urban rail transit and functions of land use. Regression analysis is the main method to study this relationship. However, the descriptions of land use in existing research are mostly based on sketchy data such as land area, which is difficult to reveal the impact mechanism and spatial effects of land use of various attributes on passenger flow. To this end, this study utilizes Point of Interest (POI) data of Baidu Map to describe land use information, and proposes a fine-grained description method of land use function within the attraction scope of urban rail transit station. Based on the case of Beijing Subway, global regression models with constant parameters and local regression model with variable parameters are employed to study the dependence relationship and spatial effects of coarse and fine-grained land use with outbound passenger flow at morning peak. The case study of Beijing Subway shows that comprehensively considering the tradeoff between the explanatory power and complexity of models, and the effect of dealing with spatial dependence and heterogeneity, the geographically weighted regression (GWR) model with variable parameters has the best estimation compared with the global model with constant parameter. Its interpretation ability is 84%, and Moran's I index of residuals is 0.0001, which can describe the spatial heterogeneity of the dependence of station outbound passenger flow and POI. The results also display that the Beijing's urban rail transit station basically covers the social and economic center of the central city. These areas are usually developed in a high-intensity hybrid manner for land development. Moreover, the impact and spatial characteristics of land use with different attributes and functions on the morning peak outbound passenger flow are significantly different. For example, the morning peak outbound passenger flow is closely related with the land for commercial and business facilities, administration and public services, which are related to housing and employment, and the commuter between the two places. At the fine-grained level, the outbound passenger flow is more dependent on POI of office buildings and government agencies, which are significantly distributed in the central city functional areas and urban core areas with dense employment. The local model with variable parameters based on fine-grained POI can better identify the impact and spatial heterogeneity of various types of land use on station passenger flow. The case study indicates that the dependence of station passenger flow and land use is the superposition of impacts and spatial effects of various attribute functions of land use.
表1 基于不同粒度水平POI的城市建设用地分类Tab. 1 Urban construction land classification based on different granularity level POIs |
| 用地分类 | I级POI | II级POI |
|---|---|---|
| 商业服务业 设施用地 | 酒店 | 星级酒店、其他(酒店) |
| 美食 | 中餐厅、外国餐厅、小吃快餐店、蛋糕甜品店、咖啡厅、茶座、酒吧、其他(美食) | |
| 丽人 | 美容、美甲、美体 | |
| 购物 | 购物中心、百货商场、超市、便利店、家居建材、家电数码、商铺、集市 | |
| 金融 | 银行、ATM、信用社、投资理财、典当行 | |
| 写字楼 | 写字楼 | |
| 公司单位 | 公司、物流公司、园区、农林园艺、文化传媒、新闻出版、艺术团体、广播电视 | |
| 商业服务 | 通讯营业厅、售票处、洗衣店、图文快印店、照相馆、房产中介机构、维修点、家政服务、殡葬服务、彩票销售点、宠物服务、报刊亭、诊所、药店 | |
| 休闲娱乐 | 度假村、农家院、电影院、KTV、剧院、歌舞厅、网吧、游戏场所、洗浴按摩、游乐园、水族馆、海滨浴场 | |
| 运动健身 | 极限运动场所、健身中心、体育场馆 | |
| 商业培训 | 成人教育、亲子教育、留学中介机构、培训机构、文化宫 | |
| 汽车服务 | 汽车维修 | |
| 居住用地 | 居住 | 住宅区、宿舍 |
| 道路与交通 设施用地 | 对外交通 | 飞机场、火车站、长途汽车站 |
| 公交车站 | 公交车站 | |
| 其他交通 | 停车场、加油加气站、充电站 | |
| 工业用地 | 工业厂矿 | 厂矿 |
| 公用设施用地 | 公用设施 | 邮局、公用事业、公共厕所 |
| 公共管理与 公共服务用地 | 公共游览 | 博物馆、文物古迹、教堂、图书馆、美术馆、展览馆 |
| 科研教育 | 大学、中学、小学、幼儿园、特殊教育学校、科研机构 | |
| 政府机构 | 各级政府、行政单位、公检法机构、涉外机构、党派团体、福利机构、政治教育机构 | |
| 公共医疗 | 综合医院、专科医院、体检机构、急救中心、疾控中心、疗养院 | |
| 绿地与广场用地 | 绿地广场 | 公园、动物园、植物园、风景区、休闲广场 |
表2 回归模型的参数β估计结果Tab. 2 Parameter estimation results of regression models |
| 粒度水平 | 影响因素/lip | OLS/β | SLM/β | SEM/β | SDM/β | GWR/β | |||
|---|---|---|---|---|---|---|---|---|---|
| 1% | 5% | 10% | 不显著 | ||||||
| 粗 粒 度 | 居住用地 | -4.929 | -4.733 | -4.519 | -2.532 | -13.274(18%) | -4.631(17%) | -2.155(8%) | -1.102(57%) |
| 商业服务业设施用地 | 12.137*** | 12.057*** | 12.044*** | 11.721*** | 6.887(31%) | 4.237(12%) | 4.496(6%) | 1.342(51%) | |
| 公共管理与公共服务用地 | 54.224*** | 51.411*** | 53.537*** | 42.654*** | 9.663(41%) | 34.181(9%) | 8.592(4%) | 5.091(46%) | |
| 道路与交通设施用地 | 4.836* | 4.576 | 4.522 | 3.226 | 81.913(85%) | 96.526(1%) | 7.922(2%) | 11.669(12%) | |
| 绿地与广场用地 | -24.262 | -23.074 | -24.259 | -11.633 | -62.629(6%) | -1.910(5%) | -17.206(7%) | -6.857(82%) | |
| ρ | 0.464 | -0.278 | |||||||
| λ | 0.304 | ||||||||
| 细 粒 度 | 居住 | -4.405 | -4.452 | -4.657 | -0.596 | 4.305(28%) | -4.103(13%) | -2.146(3%) | -2.044(56%) |
| 写字楼 | 136.630*** | 136.930*** | 138.361*** | 131.143*** | 146.738(66%) | 102.819(5%) | 70.582(7%) | 22.748(22%) | |
| 公司单位 | 6.415 | 6.430 | 6.079 | 8.988 | 30.325(19%) | 13.698(7%) | 10.624(6%) | 1.245(68%) | |
| 科研教育 | -5.119 | -6.508 | -1.729 | -34.545 | -204.995(14%) | -46.527(12%) | -21.512(12%) | -11.767(62%) | |
| 政府机构 | 42.241 | 39.633 | 43.904* | 29.315 | 54.225(54%) | 44.685(10%) | 26.300(8%) | 13.107(28%) | |
| 对外交通 | -62.564*** | -61.790*** | -63.434*** | -58.885*** | 3.315(20%) | 58.661(27%) | 45.774(11%) | 19.068(42%) | |
| 公交车站 | -46.889 | -39.879 | -58.888 | -64.629 | (0%) | -581.734(2%) | -300.432(5%) | -70.24(93%) | |
| 绿地广场 | 6.227 | 6.876 | 6.577 | 11.821 | -90.427(3%) | 38.195(10%) | 87.552(1%) | 11.356(86%) | |
| ρ | 0.380 | -0.999* | |||||||
| λ | -0.355 | ||||||||
注:*、**、***分别表示在10%、5%、1%显著水平上通过检验。 |
表3 基于I级POI的回归模型拟合效果评价指标对比Tab. 3 Comparison of evaluation indexes of regression models fitting effect based on I-level POI |
| 模型 | R2 | 校正的R2 | 对数似然值 | AIC | 残差的Moran's I |
|---|---|---|---|---|---|
| OLS | 0.650 | 0.612 | - | 4636.620 | 0.0775 |
| SLM | 0.653 | 0.616 | -2212.674 | 4471.348 | -0.0033 |
| SEM | 0.651 | 0.613 | -2213.029 | 4472.059 | -0.0035 |
| SDM | 0.684 | 0.608 | -2198.581 | 4443.162 | -0.0145 |
| GWR | 0.841 | 0.824 | - | 4449.164 | 0.0001 |
表4 周六回归拟合参数估计结果Tab. 4 Results of Saturday's regression fitting parameter estimation |
| 粒度水平 | 影响因素/lip | OLS/β | SLM/β | SEM/β | SDM/β | GWR/β | |||
|---|---|---|---|---|---|---|---|---|---|
| 1% | 5% | 10% | 不显著 | ||||||
| 粗 粒 度 | 居住用地 | -2.432 | -2.424 | -2.395 | -2.503 | -6.213(12%) | -4.414(16%) | -3.935(15%) | -1.596(57%) |
| 商业服务业设施用地 | 4.359*** | 4.359*** | 4.357*** | 4.346*** | 3.358(69%) | 1.504(7%) | 0.854(4%) | 0.125(20%) | |
| 公共管理与公共服务用地 | 9.679* | 9.432* | 9.629* | 8.695 | 18.115(7%) | 2.651(6%) | -2.217(9%) | -1.678(78%) | |
| 道路与交通设施用地 | -0.608 | -0.611 | -0.618 | -0.852 | 17.062(42%) | 10.451(15%) | 8.118(11%) | 6.130(32%) | |
| 绿地与广场用地 | -5.360 | -5.196 | -5.274 | -4.197 | -67.081(8%) | -30.039(2%) | 10.025(4%) | 0.028(86%) | |
| ρ | 0.127 | -0.024 | |||||||
| λ | 0.092 | ||||||||
| 细 粒 度 | 居住 | -1.319 | -1.354 | -1.303 | -1.999 | 5.797(10%) | 3.334(19%) | 2.375(12%) | -0.034(59%) |
| 美食 | 9.472** | 9.511*** | 9.393*** | 10.792*** | 18.912(76%) | 4.220(4%) | 4.224(3%) | 0.514(17%) | |
| 酒店 | 23.898 | 21.507 | 23.515 | 8.540 | -33.005(17%) | 15.636(21%) | -30.626(6%) | -3.314(56%) | |
| 写字楼 | 59.568*** | 59.713*** | 59.404*** | 57.193*** | 63.240(56%) | 51.826(9%) | 27.864(3%) | 10.797(32%) | |
| 公司单位 | -4.544* | -4.481* | -4.512* | -4.774* | -6.861(29%) | -4.987(17%) | -4.195(5%) | -1.504(49%) | |
| 休闲娱乐 | -58.196* | -58.977* | -58.585* | -107.261*** | -94.921(15%) | -68.644(48%) | -56.245(18%) | -40.797(19%) | |
| 公共游览 | 19.067 | 18.578 | 18.655 | 15.450 | 55.573(10%) | 25.549(26%) | 20.895(10%) | 12.053(54%) | |
| 科研教育 | -45.515 | -45.479* | -45.732* | 53.231** | -61.216(14%) | -59.024(43%) | -46.242(14%) | -25.193(29%) | |
| 政府机构 | 11.991 | 12.107 | 12.286 | 11.545 | 31.377(19%) | 18.163(8%) | 8.609(7%) | 4.756(66%) | |
| 对外交通 | -6.547 | -6.174 | -6.451 | -11.179 | 59.435(65%) | 12.966(8%) | -3.128(6%) | 4.881(21%) | |
| 公交车站 | 15.901 | 17.128 | 16.064 | 11.746 | 193.295(1%) | -83.031(5%) | 43.392(6%) | 7.562(88%) | |
| 绿地广场 | -2.843 | -2.437 | -2.695 | -1.360 | (0%) | -25.855(4%) | -8.709(2%) | 0.272(94%) | |
| ρ | 0.247 | -0.972 | |||||||
| λ | 0.088 | ||||||||
注:*、**、***分别表示在10%、5%、1%显著水平上通过检验。 |
| [1] |
|
| [2] |
|
| [3] |
|
| [4] |
[ 谭章智, 李少英, 黎夏, 等. 城市轨道交通对土地利用变化的时空效应. 地理学报, 2017,72(5):850-862.]
|
| [5] |
[ 顾介澄, 石小法. 深圳市轨道站点客流特征与周边土地利用的关系. 交通与运输, 2019,35(5):47-50.]
|
| [6] |
|
| [7] |
|
| [8] |
|
| [9] |
|
| [10] |
|
| [11] |
|
| [12] |
[ 申犁帆, 王烨, 张纯, 等. 轨道站点合理步行可达范围建成环境与轨道通勤的关系研究: 以北京市44个轨道站点为例. 地理学报, 2018,73(12):2423-2439.]
|
| [13] |
[ 王淑伟, 孙立山, 郝思源, 等. 基于精细化用地的轨道客流直接估计模型. 交通运输系统工程与信息, 2015,15(3):37-43.]
|
| [14] |
|
| [15] |
|
| [16] |
|
| [17] |
|
| [18] |
[ 李俊芳, 姚敏峰, 季峰, 等. 土地利用混合度对轨道交通车站客流的影响. 同济大学学报(自然科学版), 2016,44(9):1415-1423.]
|
| [19] |
Code for Classification of Urban Land Use and Planning Standards of Development Land. Beijing: China Architecture & Building Press, 2011.
[ 中华人民共和国住房和城乡建设部. GB50137-2011城市用地分类与规划建设用地标准. 北京: 中国建筑工业出版社, 2011.]
|
| [20] |
|
| [21] |
Baidu Map. POI industry classification. http://lbsyun.baidu.com/index.php?title=lbscloud/poitags, 2018-12-03.
[ 百度地图. POI行业分类. http://lbsyun.baidu.com/index.php?title=lbscloud/poitags, 2018-12-03.]
|
| [22] |
|
/
| 〈 |
|
〉 |