
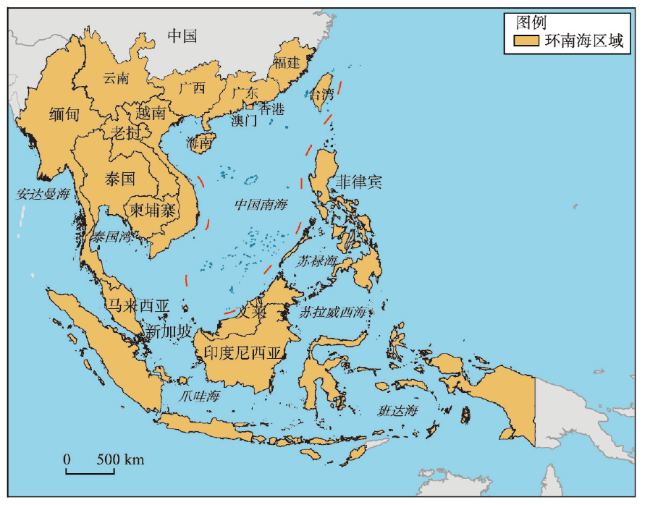
环南海区域发展特征与一体化经济区建设前景
|
金凤君(1961-), 男, 内蒙古赤峰人, 研究员, 博士生导师, 主要从事区域经济学与经济地理学研究。E-mail: jinfj@igsnrr.ac.cn |
收稿日期: 2019-08-26
要求修回日期: 2020-10-01
网络出版日期: 2021-04-25
基金资助
中国科学院战略性先导科技专项(XDA19040403)
国家自然科学基金项目(41771134)
版权
Development characteristics and construction prospects for an integrated economic zone in the South China Sea Region
Received date: 2019-08-26
Request revised date: 2020-10-01
Online published: 2021-04-25
Supported by
Strategic Priority Research Program of the Chinese Academy of Sciences(XDA19040403)
National Natural Science Foundation of China(41771134)
Copyright
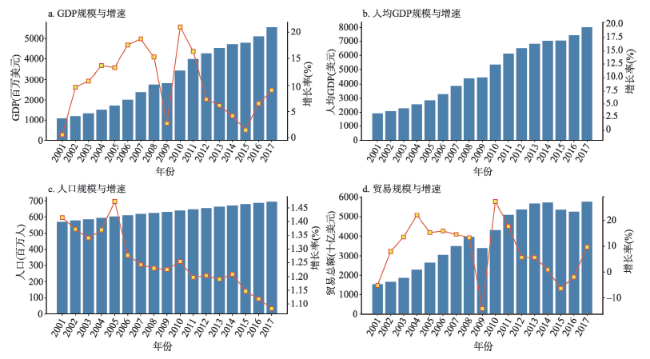
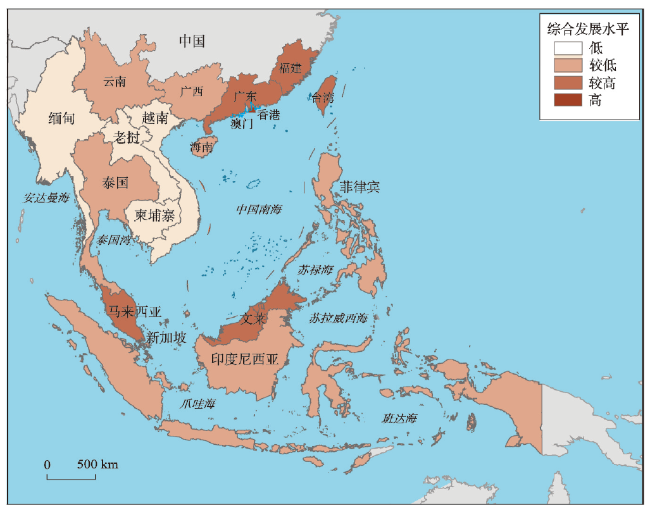
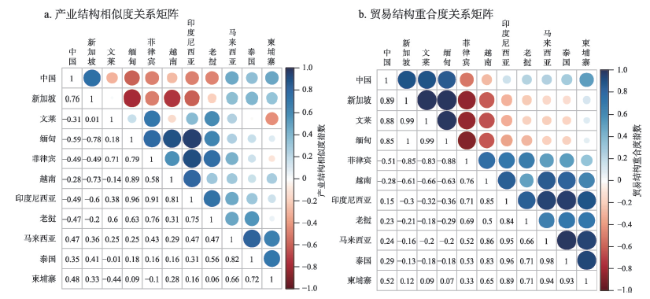
《区域全面经济伙伴关系协定》(RCEP)合作框架正催化全球经济版图格局发生剧烈演变,为应对“百年未有之大变局”,中国需要以“一带一路”倡议为契机,以环南海区域为战略基点,在深入研究区域发展特征的基础上,探讨建设“中国+东南亚”战略性一体化经济区的可能性并付诸实施。本文以环南海区域为重点,结合区域发展重点指标描述了其整体发展特征,利用产业结构相似度指数和贸易结构重合度指数,对环南海区域产业与对外贸易的结构性特征进行了剖析,并刻画了环南海区域核心增长区域的空间网络特征,最后讨论了环南海区域构建多元一体化经济区的前景并提出政策建议。结果表明:① 2000—2017年环南海区域主要发展指标增长态势强劲,发展速度和质量远超全球同期平均水平。② 在全球产业转移周期阶段与空间路径的双重驱动下,环南海区域形成了“澳新港—粤闽台文马—滇桂琼泰印菲越—缅老柬”四大梯级发展格局。③ 环南海区域11个国家间产业结构相似度指数和贸易结构重合度指数均处于较高水平,兼具“横向一体化”和“纵向梯级化”复合特征;产业结构与全球贸易商品结构呈现出“高端化”和“低端化”并举的态势。④ 环南海区域已经形成九大核心增长区域,增长极的极化与扩散效应使得不同区域之间的优势产业和出口商品类型呈现相似性和互补性。⑤ 展望未来,新一轮全球产业转移及其引致的全球价值链重组将构建起深度匹配地区资源禀赋特征的区域一体化生产—消费网络,而城市群、高速交通等空间实体所构建的“点—轴”空间网络和“内—外”开放合作政策平台也将更好保障一体化经济区的构建与发展。

金凤君 , 姚作林 , 陈卓 . 环南海区域发展特征与一体化经济区建设前景[J]. 地理学报, 2021 , 76(2) : 428 -443 . DOI: 10.11821/dlxb202102013
The Belt and Road Initiative (BRI) of China is sharply catalyzing the evolution of the global economic landscape. In order to cope with these great changes, China needs to take South China Sea Region (SCSR) as its strategic pivot and explore the construction possibility of a strategic integrated economic zone combining China and ASEAN. Based on key indicators, this paper outlines the overall development characteristics of SCSR, analyses the structural characteristics of industry and trade based on the indexes of industrial structure similarity and trade structure coincidence, depicts the spatial network characteristics of the core growth area around SCSR, and discusses the construction prospect of multiple integrated economic zone in SCSR. The results show that: (1) From 2000 to 2017, the main economic indicators of SCSR grew pretty well, the development speed and quality were much higher than the global average level in the same period. (2) Driven by the global industrial transfer stages and spatial paths, SCSR has evolved into four levels, the first level includes Macao, Singapore, and Hong Kong, the second level includes Guangdong, Fujian, Taiwan, Brunei and Malaysia, the third level includes Yunnan, Guangxi, Hainan, Thailand, Indonesia, Philippines and Vietnam, the fourth level includes Myanmar, Laos and Cambodia. (3) The indexes of industrial structure similarity and trade structure coincidence of 11 countries in SCSR keep at a high level, which do not only show the integration trend from the horizontal and vertical dimensions, but also from the upgrading and downgrading states. (4) SCSR has formed nine core growth regions, and the advantage industries and export commodity types between different regions are characterized by convergence and complementarity due to the polarization and diffusion effect of the growth poles. (5) From a long-term perspective, SCSR has had the external and internal conditions for building a multiple integrated economic zone. The 5th round of global industrial transfer and the reconstruction of the global value chain will build a production-consumption network which can match the characteristics of regional resource endowments, while the spatial network will be built by spatial entities such as urban agglomeration and high-speed transportation, and the cooperation policy platform from internal and external conditions will better guarantee the construction of the multiple integrated economic zone as well.
表1 环南海区域综合发展水平评价指标体系Tab. 1 Evaluation index system of comprehensive development level of SCSR |
| 目标层 | 准则层 | 指标层 |
|---|---|---|
| 国家(地区) 发展水平 | 经济发展 水平 | 人均GDP(美元) |
| 人均GNI(美元) | ||
| 人均GDP增长率(%) | ||
| 产业发展 水平 | 非农产业产值比重(%) | |
| 非农产业对国内生产总值的贡献率(%) | ||
| 制造业生产指数 | ||
| 社会发展 水平 | 失业率(%) | |
| 人均居民消费支出(美元) | ||
| 抚养比(%) | ||
| 基础设施 水平 | 互联网普及率(%) | |
| 新注册企业密度(个/万人) | ||
| 公路密度(km/百km2) |
图4 2017年环南海区域国家产业结构和对外贸易结构关系矩阵注:中国数据不包括香港特别行政区、澳门特别行政区和中国台湾省的数据。 Fig. 4 Relationship matrix of industrial and foreign trade structure between countries of SCSR in 2017 |
表2 2017年环南海区域国家产业和对外贸易主要商品结构Tab. 2 Industry and main foreign trade commodity structure between countries of SCSR in 2017 |
| 类别 | 行业/门类 | ISIC/HS 编码 | 占比(%) | ||||||||||
|---|---|---|---|---|---|---|---|---|---|---|---|---|---|
| 中国 | 文莱 | 柬埔寨 | 印度尼 西亚 | 老挝 | 马来 西亚 | 缅甸 | 菲律宾 | 新加坡 | 泰国 | 越南 | |||
| 产业 结构 | 农林牧渔 | A-B | 8.4 | 1.0 | 21.3 | 11.3 | 16.9 | 7.3 | 19.2 | 8.1 | 0.0 | 6.8 | 14.6 |
| 采矿、制造与公共事业 | C-E | 34.4 | 50 | 16.6 | 24.9 | 25.8 | 28.1 | 24.1 | 19.6 | 17.2 | 25.6 | 26.3 | |
| 制造业 | D | 0.0 | 11.1 | 14.6 | 17.3 | 7.8 | 18.4 | 19.1 | 16.3 | 16.1 | 21.3 | 14.6 | |
| 建筑业 | F | 6.8 | 2.2 | 11.3 | 8.9 | 6.3 | 4.0 | 5.2 | 5.9 | 3.6 | 2.0 | 5.4 | |
| 批发、零售、住宿、餐饮 | G-H | 11.3 | 5.5 | 12.7 | 13.6 | 14.6 | 15.9 | 16.7 | 17.0 | 16.6 | 16.5 | 13.8 | |
| 交通、仓储、通信 | I | 4.5 | 3.5 | 7.4 | 7.9 | 3.0 | 7.4 | 10.5 | 5.1 | 9.6 | 5.9 | 3.2 | |
| 其他 | J-P | 34.5 | 26.8 | 16.0 | 16.0 | 25.5 | 19.0 | 5.3 | 28.0 | 37.0 | 21.9 | 22.2 | |
| 对外 贸易 商品 结构 | 化学工业 | 28~38 | 1.5 | 0.3 | 0.0 | 3.2 | 40.6 | 1.8 | 1.5 | 1.6 | 0.4 | 0.7 | 3.5 |
| 塑料橡胶 | 39~40 | 6.9 | 0.6 | 27.6 | 9.4 | 0.6 | 15.1 | 3.9 | 4.8 | 14.0 | 15.4 | 10.7 | |
| 皮革肠线 | 41~43 | 0.1 | 0.1 | 0.6 | 0.3 | 0.0 | 0.1 | 0.6 | 0.0 | 0.1 | 0.8 | 1.5 | |
| 木制品 | 44~46 | 1.3 | 0.6 | 9.5 | 15.8 | 7.5 | 7.1 | 17.8 | 9.0 | 0.1 | 3.3 | 8.0 | |
| 纤维素浆 | 47~49 | 0 | 0.5 | 0.0 | 9.6 | 0.2 | 0.0 | 0.2 | 0.7 | 0.4 | 0.2 | 0.0 | |
| 纺织原料 | 50~63 | 0.1 | 0.0 | 0.0 | 0.0 | 0.0 | 0.0 | 0.0 | 0.0 | 0.0 | 0.0 | 0.3 | |
| 鞋帽羽毛 | 64~67 | 0.4 | 0.0 | 3.5 | 0.2 | 0.0 | 0.1 | 0.4 | 0.1 | 0.0 | 0.1 | 1.1 | |
| 石料陶瓷 | 68~70 | 1.1 | 0.2 | 0.0 | 0.6 | 0.0 | 0.9 | 0.2 | 0.4 | 0.1 | 0.7 | 1.3 | |
| 天然金属 | 71 | 1.8 | 4.9 | 47.5 | 22.1 | 42.7 | 6.1 | 30.6 | 8.7 | 16.3 | 19.3 | 2.2 | |
| 贱金属 | 72~83 | 4.2 | 4.5 | 0.0 | 13.2 | 1.0 | 4.7 | 27.6 | 0.7 | 1.5 | 1.3 | 10.8 | |
| 机械制品 | 84~85 | 37.8 | 27.2 | 10.5 | 23.1 | 4.1 | 48.2 | 12.0 | 58.1 | 50.1 | 50.4 | 36.4 | |
| 交通设备 | 86~89 | 37.8 | 0.9 | 0.0 | 0.1 | 0.0 | 0.1 | 0.0 | 0.0 | 0.1 | 0.6 | 0.0 | |
| 精密仪器 | 90~92 | 7.0 | 60.3 | 0.8 | 2.3 | 3.3 | 15.9 | 5.2 | 15.6 | 16.8 | 7.2 | 24.2 | |
| 武器弹药 | 93 | 0.0 | 0.0 | 0.0 | 0.0 | 0.0 | 0.0 | 0.0 | 0.3 | 0.0 | 0.0 | 0.0 | |
注:联合国经济数据库中,中国制造业(ISIC—D类)数据纳入采矿、制造与公共事业(ISIC—C-E类)统计,故中国制造业占比数值为空。中国数据不包括香港特别行政区、澳门特别行政区和中国台湾省的数据。 |
图5 2017年环南海区域多元一体化经济区空间结构注:基于自然资源部标准地图服务网站审图号为GS(2016)2938号的标准地图制作,底图无修改。 Fig. 5 Spatial structure of multiple integrated economic zone of SCSR in 2017 |
表3 2017年环南海区域九大核心增长区域重点指标Tab. 3 Key indicators of nine core growth regions of SCSR in 2017 |
| 编号 | 区域 | 面积 (km2) | 人口 (万人) | GDP (亿美元) | 人口密度 (人/km2) | GDP密度 (万美元/km2) | 人均GDP (美元) |
|---|---|---|---|---|---|---|---|
| 1 | 粤港澳大湾区 | 56508.2 | 6951.5 | 15155.3 | 1230.2 | 2682.0 | 21801.3 |
| 2 | 新加坡—吉隆坡经济走廊 | 36333.9 | 2773.7 | 5943.9 | 763.4 | 1635.9 | 21429.9 |
| 3 | 泰国湾经济带 | 22962.0 | 1334.6 | 2549.0 | 581.2 | 1110.1 | 19099.0 |
| 4 | 台湾海峡经济圈 | 282185.6 | 10434.0 | 11217.2 | 369.8 | 397.5 | 10750.6 |
| 5 | 滇中经济区 | 114600.0 | 2110.2 | 1505.6 | 184.1 | 131.4 | 7135.1 |
| 6 | 菲律宾首都经济区 | 22181.6 | 2409.5 | 1469.4 | 1086.3 | 662.5 | 6098.5 |
| 7 | 环北部湾经济圈 | 140764.0 | 6651.1 | 3869.3 | 472.5 | 274.9 | 5817.5 |
| 8 | 雅加达—万隆经济带 | 35261.0 | 4781.7 | 2717.5 | 1356.1 | 770.7 | 5683.1 |
| 9 | 越南南部经济区 | 47100.0 | 2695.3 | 1050.0 | 572.3 | 222.9 | 3895.7 |
| 环南海区域(合计) | 757896.3 | 40141.6 | 45477.2 | 529.6 | 600.0 | 11329.2 | |
| [1] |
[ 利普斯基. 后金融危机十年的持续挑战与应对. 探索与争鸣, 2019(4):33-37, 157.]
|
| [2] |
|
| [3] |
[ 曹云华. 中国—东盟合作与亚太区域秩序的构建. 当代世界, 2018(12):13-17.]
|
| [4] |
[ 陈明宝. 要素流动、资源融合与开放合作: 海洋经济在粤港澳大湾区建设中的作用. 华南师范大学学报(社会科学版), 2018(2):21-26, 191.]
|
| [5] |
[ 郝大江, 张荣. 要素禀赋、集聚效应与经济增长动力转换. 经济学家, 2018(1):41-49.]
|
| [6] |
[ 梁芷铭. 区域一体化视域下社会组织的发展与创新: 基于广西北部湾经济区及其发展规划的理性思考. 开发研究, 2011(5):38-41.]
|
| [7] |
[ 刘书明. 区域经济一体化中地方政府合作问题与对策: 以关中—天水经济区为例. 西北农林科技大学学报(社会科学版), 2013,13(1):74-79.]
|
| [8] |
[ 王海飞. 粤桂经济区联动发展研究: 基于“1+9”空间格局. 改革与战略, 2016,32(10):102-109.]
|
| [9] |
[ 王勤. 亚太区域经济一体化与海峡西岸经济区. 东南学术, 2004(S1):250-252.]
|
| [10] |
[ 张晓钦, 韩传峰. 中国区域一体化的整体性治理模式研究: 以广西北部湾经济区为例. 同济大学学报(社会科学版), 2015,26(5):116-124.]
|
| [11] |
[ 石士钧, 吴继兵. 中国—东盟经济一体化初探. 亚太经济, 2002(4):8-12.]
|
| [12] |
[ 孙久文, 夏添, 胡安俊. 粤港澳大湾区产业集聚的空间尺度研究. 中山大学学报(社会科学版), 2019,59(2):178-186.]
|
| [13] |
[ 万哨凯, 夏斌. 珠三角经济区的形成因素及一体化发展方向研究. 改革与战略, 2007,23(12):103-104, 112.]
|
| [14] |
|
| [15] |
[ 李瑞林, 骆华松. 区域经济一体化: 内涵、效应与实现途径. 经济问题探索, 2007(1):52-57.]
|
| [16] |
[ 梁双陆, 程小军. 国际区域经济一体化理论综述. 经济问题探索, 2007(1):40-46.]
|
| [17] |
[ 全毅. 全球区域经济一体化发展趋势及中国的对策. 经济学家, 2015(1):94-104.]
|
| [18] |
[ 李红, 聂艳明. 区域一体化进程中地缘经济区贸易网络的演进: 以广西与澳门为例. 亚太经济, 2015(2):116-120.]
|
| [19] |
[ 廖少廉. 中国与东盟国家的经济关系: 回顾与展望. 世界经济文汇, 1987(6):34-36.]
|
| [20] |
[ 张守谦. 中国与东盟国家经济关系的现状及发展前景. 世界经济研究, 1988(1):41-44.]
|
| [21] |
[ 孙国远. 东盟同中国经济关系的发展. 现代国际关系, 1989(2): 15-19, 10, 63-64.]
|
| [22] |
[ 金丹. 中国—东盟自由贸易区经济一体化研究[D]. 海口: 海南大学, 2010.]
|
| [23] |
[ 陈秀莲. 中国—东盟服务贸易一体化与服务贸易壁垒的研究[D]. 成都: 西南财经大学, 2011.]
|
| [24] |
[ 范祚军, 侯晓. 中国—东盟区域经济一体化趋势下的税收竞争与中国的政策选择. 东南亚纵横, 2011(11):80-85.]
|
| [25] |
[ 陈秀莲. 中国—东盟运输服务贸易一体化的现状、水平与发展前景. 国际贸易问题, 2012(8):66-79.]
|
| [26] |
[ 刘展. 中国—东盟经济一体化中的税收协调研究[D]. 南宁: 广西大学, 2013.]
|
| [27] |
[ 周方冶. “一带一路”视野下中国—东盟合作的机遇、瓶颈与路径: 兼论中泰战略合作探路者作用. 南洋问题研究, 2015(3):39-47.]
|
| [28] |
[ 赵洪. “一带一路”与东盟经济共同体. 南洋问题研究, 2016(4):11-19.]
|
| [29] |
[ 谷合强. “一带一路”与中国—东盟经贸关系的发展. 东南亚研究, 2018(1):115-133, 154.]
|
| [30] |
[ 欧阳博强, 孙学涛, 王振华. 城市化和产业结构对劳动生产率的影响: 基于中国285个城市面板数据的分析. 城市问题, 2018(12):28-36.]
|
| [31] |
[ 薛继亮. 产业升级、贸易结构和就业市场配置研究. 中国人口科学, 2018(2):50-63, 127.]
|
| [32] |
[ 陈彦光. 城市和区域产业发展分析的增长商测度. 人文地理, 2017,32(4):86-94.]
|
| [33] |
[ 王颖洁. 21世纪双边自由贸易对新加坡经济的推动力影响[D]. 上海: 华东师范大学, 2017.]
|
| [34] |
|
| [35] |
[ 王菲菲. “一带一路”背景下中国高铁外交研究[D]. 长春: 吉林大学, 2018.]
|
| [36] |
[ 林宏宇, 张帅. 泰国地区间的产业分工体系研究: 现状与展望. 亚太经济, 2018(4): 66-73, 150-151.]
|
| [37] |
[ 刘喆. “百年大变局”下的中国与东盟关系. 南京大学学报(哲学·人文科学·社会科学), 2019,56(5):99-103.]
|
/
| 〈 |
|
〉 |
