
中国粮食生产空间关联网络的结构特征及其形成机制
|
冯颖(1984-), 女, 博士, 副教授, 硕导, 研究方向为资源经济与环境管理。E-mail: yingfeng8410@126.com |
收稿日期: 2019-11-27
要求修回日期: 2020-05-21
网络出版日期: 2021-01-25
基金资助
陕西省社会科学基金项目(2019S029)
教育部人文社会科学重点基金项目(14JJD790031)
国家自然科学基金项目(71473195)
陕西省教育厅专项科研项目(016166523)
西北政法大学青年学术创新团队计划资助项目
版权
Structural characteristics and formation mechanism of spatial correlation network of grain production in China
Received date: 2019-11-27
Request revised date: 2020-05-21
Online published: 2021-01-25
Supported by
Social Science Fund of Shaanxi Province(2019S029)
Key Fund for Humanities and Social Sciences of the Ministry of Education(14JJD790031)
National Natural Science Foundation of China(71473195)
Special Scientific Research Project of Shaanxi Provincial Education Department(016166523)
Young Academic Innovation Team of Northwest University of Political Science and Law
Copyright
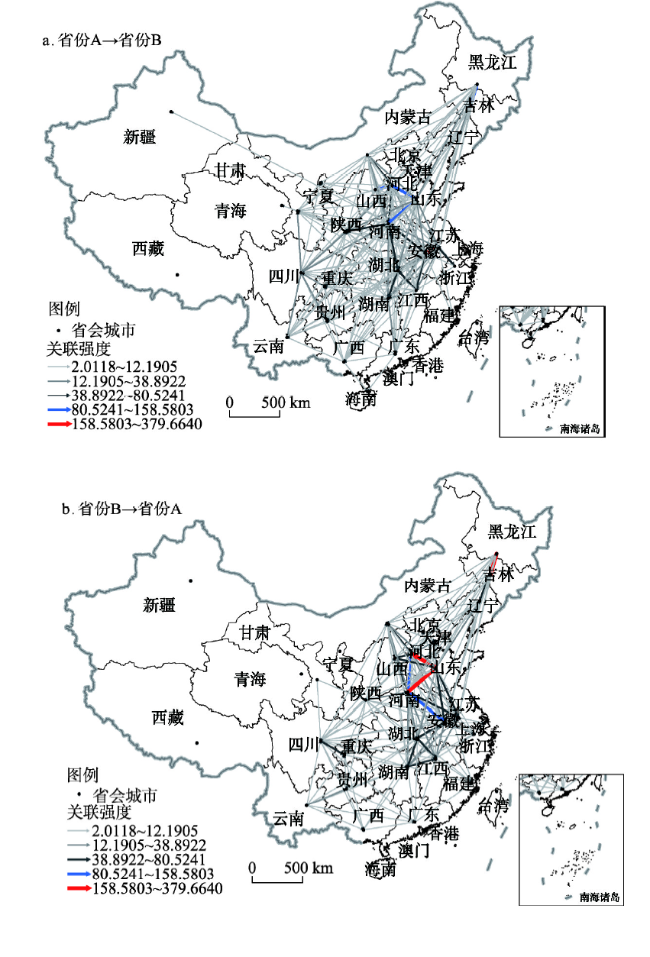
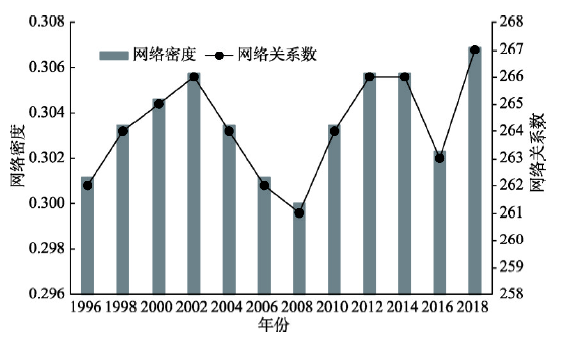
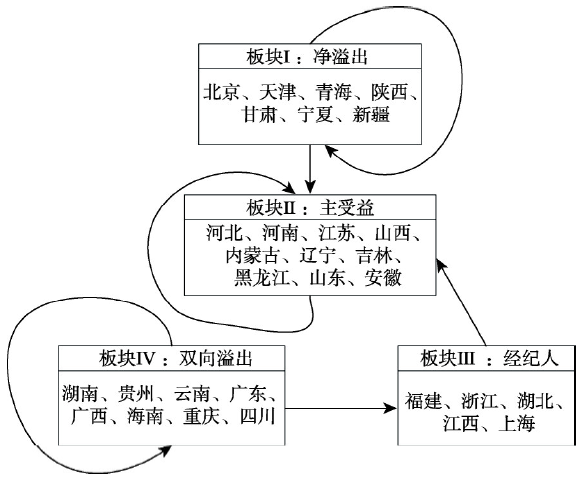
基于1996—2018年中国省际粮食生产面板数据,在修正的引力模型准确测算粮食生产空间关联关系及构建空间关联矩阵的基础上,首先运用社会网络分析方法从整体特征、个体特征及块模型3个方面具体考察了粮食生产空间关联网络的结构特征,进一步采用二次指派程序方法探讨其形成机制。研究发现:① 省际粮食生产空间关联的密切程度在波动中提高,但仍有提升空间,网络结构呈现较好的稳定性和可达性,溢出效应具有多重叠加特性;② 省际粮食生产空间关联网络呈现主产区、主销区、平衡区“核心—边缘”分布格局,粮食主产区在网络中处于核心地位,粮食主销区和平衡区则处于边缘地位;③ 粮食生产空间关联网络可划分为净溢出、主受益、经纪人和双向溢出4个板块,板块间的溢出效应具有明显的梯度传递特征;④ 自然禀赋条件与社会经济因素的共同作用推动了粮食生产空间关联网络的形成,地理空间邻近性、经济发展水平与农村劳动力规模、机械服务规模、耕地资源的差异、降水量和日照时数的相近性对粮食生产空间关联网络的形成具有显著影响。

冯颖 , 侯孟阳 , 姚顺波 . 中国粮食生产空间关联网络的结构特征及其形成机制[J]. 地理学报, 2020 , 75(11) : 2380 -2395 . DOI: 10.11821/dlxb202011008
Based on the panel data of China's inter-provincial grain production from 1996 to 2018, the modified gravity model was used to accurately calculate the spatial correlation of grain production and build a spatial correlation matrix. Firstly, the structural characteristics of grain production spatial correlation network were investigated from three aspects: overall characteristics, individual characteristics and block model through the social network analysis method (SNA) and then, the quadratic assignment procedure (QAP) method was used to explore its formation mechanism. The study found that: (1) The level of inter-provincial spatial correlation of grain production increases in fluctuation, but there is still room for improvement. The network structure shows better stability and accessibility, and the spillover effect has multiple superposition. (2) The inter-provincial spatial correlation network of grain production presents a significant core-edge distribution pattern of major grain-producing areas, main-sales areas and grain balance areas, and the major grain-producing areas are at the core position in the network, and the grain main-sales areas and the balance areas are at the edge. (3) The spatial correlation network of grain production can be divided into four functional blocks, namely, net spillover block, main beneficial block, broker block and bidirectional spillover block, and the spillover effect between blocks are featured by obvious gradient transmission. (4) The combined effect of natural endowment conditions and socio-economic factors promote the formation of spatial correlation network of grain production. The geographical proximity, differences in economic development, rural labor scale, mechanical service scale and cultivated land resources, and the similarity of precipitation and sunshine hours have significant impacts on the formation of spatial correlation network of grain production. The conclusions are of great significance for us to grasp the spatial transmission mechanism, realize the cross-regional coordination and formulate differentiated grain policies in China.
表1 粮食生产空间关联网络特征分析的主要指标测算与说明Tab. 1 Explanation of main indicators for characteristics of spatial correlation network of grain production |
| 指标 | 计算公式 | 公式说明 | 指标含义 | |
|---|---|---|---|---|
| 整体网络 | 网络密度 | (4) | 实际关系数与理论最大关系总数之比 | 密度越大,成员之间关联关系越紧密 |
| 网络关联度 | (5) | 网络中任两个成员之间直接或间接可达的程度 | 关联度越大,网络结构的稳健性越强 | |
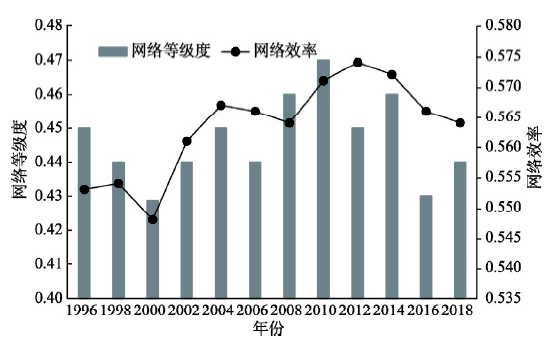
| 网络等级度 | (6) | 网络中成员之间非对称地可达的程度 | 等级度越大,网络等级越森严,成员的支配地位越强 | |
| 网络效率 | (7) | 网络中存在多余连线的程度 | 效率越低,网络中溢出路径越多,网络结构越稳定 | |
| 个体网络 | 度数中心度 | (8) | 与某成员直接关联的成员数量与最大可能直接关联的成员总数之比 | 度数中心度越高,某成员对其他成员的控制能力越强 |
| 接近中心度 | (9) | 网络中某成员与其他成员的捷径距离之和 | 接近中心度越高,成员之间的距离越短,关联与协同越密切 | |
| 中介中心度 | (10) | 网络中成员为其他成员发挥中介作用的程度 | 中介中心度越高,成员在网络中的中介地位越明显 | |
注:N为网络中成员总数量;L为实际拥有关联关系数;V为网络中不可达的成员对的数量;K为网络中对称可达的成员对的数量;M为网络中多余线的条数;n为网络中与某成员直接关联的其他成员数量;dij为两成员间的捷径距离,即捷径中包含的关系数;gjk为成员j、k之间捷径数量,gjk(i)为成员j、k间捷径经过成员i的数量,则bjk(i)为成员i处于j、k之间捷径上的概率,j ≠ k ≠ i,且j < k。 |
表2 2018年省际粮食生产空间关联的网络中心性分析Tab. 2 Network centrality analysis of inter-provincial spatial correlation of grain production in China in 2018 |
| 省份 | 度数中心度 | 接近中心度 | 中介中心度 | ||||||
|---|---|---|---|---|---|---|---|---|---|
| 点出度 | 点入度 | 总度数 | 中心度 | 排名 | 中心度 | 排名 | 中心度 | 排名 | |
| 北京 | 7 | 3 | 10 | 24.169 | 27 | 50.666 | 27 | 0 | 28 |
| 天津 | 7 | 2 | 9 | 24.155 | 28 | 54.711 | 23 | 0.148 | 26 |
| 河北 | 9 | 14 | 23 | 58.629 | 4 | 70.647 | 4 | 3.869 | 6 |
| 山西 | 9 | 11 | 20 | 45.826 | 13 | 64.344 | 13 | 2.392 | 12 |
| 内蒙古 | 8 | 16 | 24 | 56.176 | 5 | 66.354 | 10 | 3.251 | 10 |
| 辽宁 | 8 | 10 | 18 | 38.741 | 15 | 55.766 | 21 | 0.994 | 16 |
| 吉林 | 8 | 12 | 20 | 49.682 | 11 | 65.911 | 11 | 2.238 | 13 |
| 黑龙江 | 15 | 1 | 16 | 49.672 | 12 | 64.912 | 12 | 3.339 | 9 |
| 上海 | 6 | 2 | 8 | 22.667 | 30 | 49.961 | 30 | 0 | 30 |
| 江苏 | 8 | 16 | 24 | 56.175 | 7 | 68.159 | 6 | 4.755 | 5 |
| 浙江 | 9 | 3 | 12 | 32.062 | 23 | 56.852 | 20 | 0.763 | 19 |
| 安徽 | 11 | 16 | 27 | 56.175 | 6 | 68.159 | 5 | 5.904 | 4 |
| 福建 | 8 | 7 | 15 | 34.582 | 19 | 54.711 | 22 | 0.362 | 22 |
| 江西 | 8 | 5 | 13 | 34.583 | 18 | 53.805 | 25 | 0.847 | 17 |
| 山东 | 8 | 17 | 25 | 59.633 | 3 | 71.649 | 3 | 6.606 | 3 |
| 河南 | 10 | 22 | 32 | 74.683 | 1 | 81.455 | 1 | 13.562 | 1 |
| 湖北 | 7 | 19 | 26 | 66.625 | 2 | 76.369 | 2 | 9.126 | 2 |
| 湖南 | 8 | 16 | 24 | 56.175 | 9 | 67.351 | 8 | 3.495 | 7 |
| 广东 | 8 | 10 | 18 | 37.693 | 16 | 61.702 | 14 | 1.364 | 14 |
| 广西 | 9 | 6 | 15 | 34.581 | 20 | 58.022 | 17 | 0.342 | 23 |
| 海南 | 8 | 2 | 10 | 28.344 | 26 | 53.805 | 26 | 0 | 27 |
| 重庆 | 9 | 5 | 14 | 37.619 | 17 | 56.861 | 19 | 0.837 | 18 |
| 四川 | 12 | 7 | 19 | 42.387 | 14 | 59.188 | 15 | 1.333 | 15 |
| 贵州 | 9 | 8 | 17 | 34.492 | 21 | 53.805 | 24 | 0.651 | 20 |
| 云南 | 9 | 4 | 13 | 34.476 | 22 | 58.022 | 18 | 0.271 | 25 |
| 陕西 | 14 | 14 | 28 | 56.175 | 8 | 68.156 | 7 | 3.452 | 8 |
| 甘肃 | 9 | 5 | 14 | 31.133 | 24 | 59.188 | 16 | 0.469 | 21 |
| 青海 | 7 | 1 | 8 | 24.128 | 29 | 50.666 | 29 | 0 | 29 |
| 宁夏 | 9 | 2 | 11 | 31.002 | 25 | 50.666 | 28 | 0.311 | 24 |
| 新疆 | 10 | 11 | 21 | 53.621 | 10 | 67.255 | 9 | 2.934 | 11 |
| 均值 | 8.9 | 8.9 | 17.8 | 42.869 | - | 61.304 | - | 2.454 | - |
表3 粮食生产空间关联网络各板块的溢出效应分析Tab. 3 Spillover effects between the blocks in spatial correlation network of grain production |
| 板块 | 接收关系数 | 成员 数目 | 接收板块外 关系数 | 溢出板块外 关系数 | 期望内部关系 比例(%) | 实际内部关系 比例(%) | 板块 特征 | |||
|---|---|---|---|---|---|---|---|---|---|---|
| Ⅰ | Ⅱ | Ⅲ | Ⅳ | |||||||
| Ⅰ | 14 | 36 | 3 | 15 | 6 | 17 | 54 | 17.241 | 22.857 | 净溢出 |
| Ⅱ | 5 | 57 | 9 | 5 | 7 | 62 | 19 | 20.690 | 77.027 | 主受益 |
| Ⅲ | 4 | 16 | 15 | 11 | 9 | 26 | 31 | 27.586 | 32.609 | 经纪人 |
| Ⅳ | 8 | 10 | 14 | 45 | 8 | 31 | 32 | 24.138 | 59.211 | 双向溢出 |
表4 粮食生产空间关联网络各板块密度矩阵与像矩阵Tab. 4 Density matrix and image matrix of all blocks in spatial correlation network of grain production |
| 板块 | 密度矩阵 | 像矩阵 | ||||||
|---|---|---|---|---|---|---|---|---|
| Ⅰ | Ⅱ | Ⅲ | Ⅳ | Ⅰ | Ⅱ | Ⅲ | Ⅳ | |
| Ⅰ | 0.354 | 0.452 | 0.075 | 0.281 | 1 | 1 | 0 | 0 |
| Ⅱ | 0.063 | 0.578 | 0.128 | 0.038 | 0 | 1 | 0 | 0 |
| Ⅲ | 0.319 | 0.323 | 0.750 | 0.175 | 1 | 1 | 1 | 0 |
| Ⅳ | 0.120 | 0.112 | 0.350 | 0.739 | 0 | 0 | 1 | 1 |
表5 中国粮食生产空间关联关系的驱动因素回归结果Tab.5 Regression results of the factors driving the spatial correlation network of China's grain production |
| 变量 | 1996 | 2000 | 2004 | 2008 | 2012 | 2015 | 2018 | 均值 |
|---|---|---|---|---|---|---|---|---|
| Distance | 0.2894** (0.977) | 0.1839** (0.945) | 0.2071** (0.906) | 0.2268** (0.927) | 0.2086** (0.893) | 0.1891** (0.886) | 0.2824** (0.901) | 0.5662*** (0.956) |
| Pgdp | 0.0476*** (1.000) | 0.0701*** (1.000) | 0.1086*** (1.000) | 0.0488*** (1.000) | 0.0584*** (1.000) | 0.0532*** (1.000) | 0.1337** (1.000) | 0.1134** (1.000) |
| Indus | -0.0074 (1.000) | -0.0209 (0.138) | -0.1106 (1.000) | -0.0289 (0.037) | -0.0232 (1.000) | 0.0072 (0.970) | 0.0117 (1.000) | 0.4111 (0.167) |
| Labor | 0.0267*** (0.416) | 0.0473*** (0.638) | 0.0348*** (0.661) | 0.0326*** (0.839) | 0.0373*** (0.928) | 0.0301*** (0.996) | 0.0353*** (0.827) | 0.0631*** (0.697) |
| Mech | 0.0468*** (1.000) | 0.0167*** (1.000) | 0.0489*** (1.000) | 0.0017*** (1.000) | 0.0049*** (1.000) | 0.0083*** (1.000) | 0.0748*** (0.283) | 0.1869*** (1.000) |
| Land | 0.0529*** (1.000) | 0.0403*** (1.000) | 0.0381*** (1.000) | 0.0474** (1.000) | 0.0274** (0.388) | 0.0266** (1.000) | 0.0141*** (0.493) | 0.1148*** (1.000) |
| Temp | -0.0659 (0.000) | -0.1109 (0.000) | -0.1505 (0.057) | -0.0659 (0.283) | -0.1001 (0.188) | -0.0966 (0.195) | 0.0632 (0.193) | -0.2154 (0.205) |
| Prec | -0.0241*** (0.132) | -0.0273*** (0.422) | 0.0063*** (0.493) | -0.0603*** (0.321) | -0.0369*** (0.328) | -0.0387*** (0.541) | 0.0746*** (0.434) | -0.2922*** (0.609) |
| Sun | -0.0541*** (0.243) | -0.0487*** (0.231) | -0.0968*** (0.146) | -0.0452*** (0.295) | -0.0508*** (0.265) | -0.0584*** (0.287) | 0.0479*** (0.338) | -0.1373*** (0.325) |
| R2 | 0.325 | 0.304 | 0.383 | 0.418 | 0.419 | 0.421 | 0.411 | 0.515 |
| Adj-R2 | 0.316 | 0.295 | 0.374 | 0.409 | 0.413 | 0.416 | 0.404 | 0.510 |
| P值 | 0.000 | 0.000 | 0.000 | 0.000 | 0.000 | 0.000 | 0.000 | 0.000 |
| 观察值 | 870 | 870 | 870 | 870 | 870 | 870 | 870 | 870 |
| 随机置换次数 | 5000 | 5000 | 5000 | 5000 | 5000 | 5000 | 5000 | 5000 |
注:变量的系数为标准化回归系数;*、**、***分别表示在10%、5%、1%水平上显著;括号内数值表示随机置换产生的回归系数不小于实际观察到的回归系数的概率。 |
| [1] |
[ 陆文聪, 梅燕. 中国粮食生产区域格局变化及其成因实证分析: 基于空间计量经济学模型. 中国农业大学学报(社会科学版), 2007,24(3):140-152.]
|
| [2] |
[ 郑有贵, 邝婵娟, 焦红坡. 南粮北调向北粮南运演变成因的探讨: 兼南北方两个区域粮食生产发展优势和消费比较. 中国经济史研究, 1999(1):99-106, 162.]
|
| [3] |
|
| [4] |
[ 徐志宇, 宋振伟, 邓艾兴, 等. 近30年我国主要粮食作物生产的驱动因素及空间格局变化研究. 南京农业大学学报, 2013,36(1):79-86.]
|
| [5] |
[ 伍骏骞, 方师乐, 李谷成, 等. 中国农业机械化发展水平对粮食产量的空间溢出效应分析: 基于跨区作业的视角. 中国农村经济, 2017(6):44-57.]
|
| [6] |
[ 李亚婷, 潘少奇, 苗长虹. 中国县域人均粮食占有量的时空格局: 基于户籍人口和常住人口的对比分析. 地理学报, 2014,69(12):1753-1766.]
|
| [7] |
[ 杨丽霞, 杨桂山, 姚士谋, 等. 基于ESDA-GWR的粮食单产及其驱动因子的空间异质性研究. 经济地理, 2012,32(6):120-126.]
|
| [8] |
[ 胡甜, 鞠正山, 周伟. 中国粮食供需的区域格局研究. 地理学报, 2016,71(8):1372-1383.]
|
| [9] |
[ 鲁奇, 吕鸣伦. 五十年代以来我国粮食生产地域格局变化趋势及原因初探. 地理科学进展, 1997,16(1):31-36.]
|
| [10] |
[ 徐海亚, 朱会义. 基于自然地理分区的1990—2010年中国粮食生产格局变化. 地理学报, 2015,70(4):582-590.]
|
| [11] |
[ 黄爱军. 我国粮食生产区域格局的变化规律. 中国农村经济, 1995(2):31-33.]
|
| [12] |
[ 高帆. 我国粮食生产的地区变化: 1978—2003年. 管理世界, 2005(9):70-78, 87.]
|
| [13] |
[ 邓宗兵, 封永刚, 张俊亮, 等. 中国粮食生产区域格局演变研究. 农业技术经济, 2013(9):108-114.]
|
| [14] |
[ 夏四友, 赵媛, 许昕, 等. 江苏省粮食生产时空格局及其驱动因素. 经济地理, 2018,38(12):166-175.]
|
| [15] |
[ 吴玉鸣. 中国区域农业生产要素的投入产出弹性测算: 基于空间计量经济模型的实证. 中国农村经济, 2010(6):25-37, 48.]
|
| [16] |
|
| [17] |
|
| [18] |
[ 沈丽, 刘媛, 李文君. 中国地方金融风险空间关联网络及区域传染效应: 2009-2016. 管理评论, 2019,31(8):35-48.]
|
| [19] |
[ 汤放华, 汤慧, 孙倩, 等. 长江中游城市集群经济网络结构分析. 地理学报, 2013,68(10):1357-1366.]
|
| [20] |
[ 李敬, 陈澍, 万广华, 等. 中国区域经济增长的空间关联及其解释: 基于网络分析方法. 经济研究, 2014,49(11):4-16.]
|
| [21] |
[ 刘华军, 刘传明, 孙亚男. 中国能源消费的空间关联网络结构特征及其效应研究. 中国工业经济, 2015(5):83-95.]
|
| [22] |
[ 刘红梅, 李国军, 王克强. 基于引力模型的中国农业虚拟水国内贸易影响因素分析. 中国农村经济, 2011(5):21-32.]
|
| [23] |
[ 孙林, 蓝旻, 钟钰. 贸易便利化对中国与东盟区域谷物可获得性的影响: 进口贸易流量视角的考察. 农业技术经济, 2015(1):111-119.]
|
| [24] |
[ 李琳, 牛婷玉. 基于SNA的区域创新产出空间关联网络结构演变. 经济地理, 2017,37(9):19-25, 61.]
|
| [25] |
|
| [26] |
|
| [27] |
|
| [28] |
[ 林春艳, 孔凡超. 中国产业结构高度化的空间关联效应分析: 基于社会网络分析方法. 经济学家, 2016(11):45-53.]
|
| [29] |
[ 方师乐, 卫龙宝, 伍骏骞. 农业机械化的空间溢出效应及其分布规律: 农机跨区服务的视角. 管理世界, 2017(11): 65-78, 187-188.]
|
| [30] |
|
| [31] |
|
| [32] |
[ 刘军. QAP: 测量“关系”之间关系的一种方法. 社会, 2007(4):164-174, 209.]
|
| [33] |
[ 邵汉华, 周磊, 刘耀彬. 中国创新发展的空间关联网络结构及驱动因素. 科学学研究, 2018,36(11):2055-2069.]
|
/
| 〈 |
|
〉 |