
满洲里口岸—城市关系演变的多尺度因素影响分析
|
杨青山(1963-), 男, 辽宁葫芦岛人, 博士, 教授, 博士生导师, 中国地理学会会员(S110011315M), 主要从事经济地理、城市与区域规划等研究。E-mail: yangqs027@nenu.edu.cn |
收稿日期: 2019-10-23
要求修回日期: 2020-06-01
网络出版日期: 2020-12-25
版权
Multi-scale factors influencing the evolution of Manzhouli port-city relationship
Received date: 2019-10-23
Request revised date: 2020-06-01
Online published: 2020-12-25
Copyright
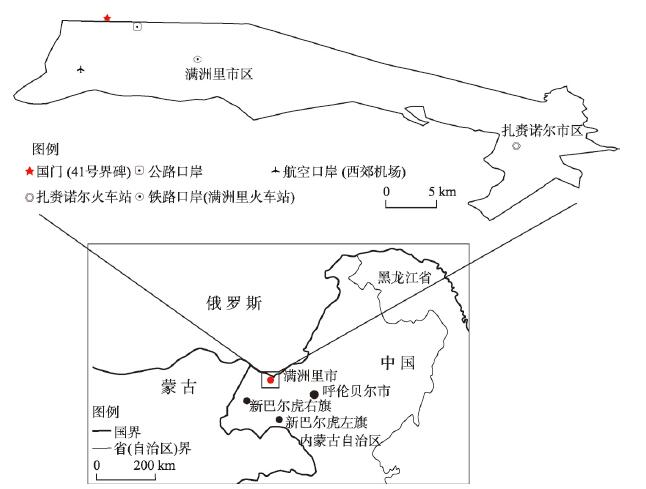
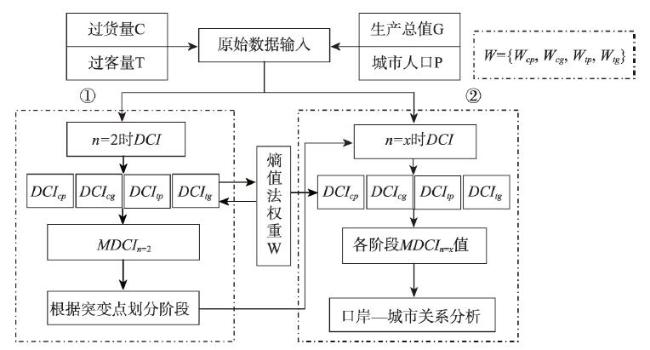
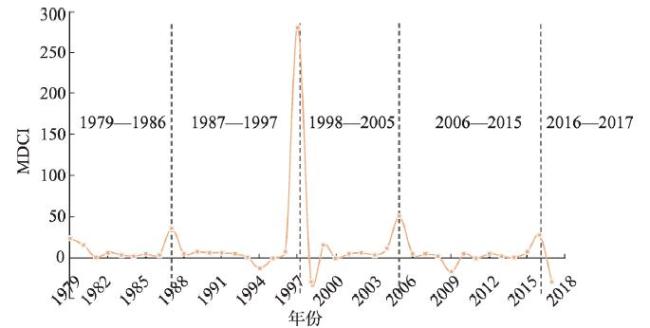
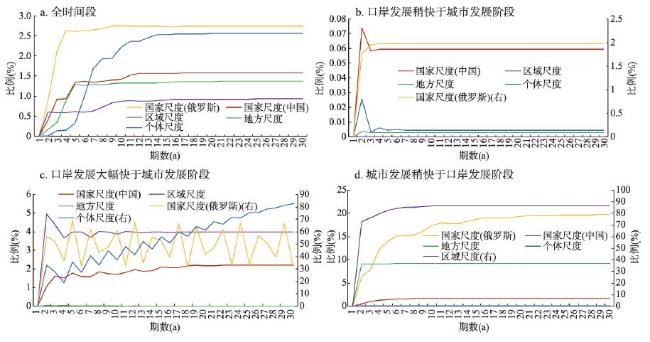
沿边口岸是“一带一路”倡议中各主权国家之间经济合作的关键节点。本文以中俄边界往来最密切的口岸城市满洲里为例,首先,通过构建改进动态集中指数(MDCI),将满洲里口岸—城市关系划分为低水平平衡发展阶段(1979—1987年)、口岸发展稍快于城市发展阶段(1988—1997年)、口岸发展大幅快于城市发展阶段(1998—2005年)、城市发展稍快于口岸发展阶段(2006—2015年)和口岸与城市关系新突变点(2016—2017年)。其次,应用向量自回归模型(VAR),分析了国家、区域、地方和个体4个尺度对满洲里口岸—城市关系影响的程度,研究表明:在全时段上,表现为国家尺度>个体尺度>地方尺度>区域尺度的关系;低水平平衡发展阶段,表现为国家尺度影响较大,区域尺度、地方尺度和个体尺度影响较小;口岸发展稍快于城市发展阶段,以国家尺度影响为主,其中,俄罗斯影响稍大于中国,其他尺度影响均较小;口岸发展大幅快于城市发展阶段,国家、区域及个体尺度均起到了重要作用,且作用大小相对均衡;城市发展稍快于口岸发展阶段,国家尺度、区域尺度、地方尺度作用较明显,个体尺度影响弱化,其中,区域尺度影响最大,之后表现为国家尺度(俄罗斯)>地方尺度>国家尺度(中国)>个体尺度的关系。口岸与城市关系新突变点,个体尺度与国家尺度影响较大,区域尺度与地方尺度影响较小。最后,综合运用VAR模型、深度访谈等定量和定性分析方法,从国家、区域、地方及个体尺度因素对口岸—城市关系演变的影响机理进行了全时段和分阶段的分析。本研究可为满洲里促进口岸—城市关系的良性发展提供多尺度视角的新思路,也可为中国广大边境地区探讨口岸—城市关系的发展提供借鉴。
杨青山 , 刘鉴 , 张郁 , 杨维旭 . 满洲里口岸—城市关系演变的多尺度因素影响分析[J]. 地理学报, 2020 , 75(10) : 2146 -2163 . DOI: 10.11821/dlxb202010008
Border ports are the key nodes for economic cooperation among the sovereign countries at the Belt and Road Initiative. This study takes Manzhouli, the most closely connected port city on the Sino-Russian border, as an example. Firstly, by constructing the Modified Dynamic Concentration Index (MDCI), this study divided the process of the port-city relationship in Manzhouli into five stages: low level balanced development stage (1979-1987), port development slightly faster than the urban development stage (1988-1997), port development significantly faster than the city development stage (1998-2005), city development slightly faster than the port development stage (2006-2015), and new abrupt change point of port-city relationship (2016-2017). Secondly, the vector autoregressive model (VAR) is used to analyze the degree of influence at national, regional, local and individual scales on the Manzhouli port-city relationship. The research shows that in the whole period, the influence of different scales is manifested as national scale > individual scale > local scale > regional scale; at low level balanced development stage, the influence of national scale is larger, while that of regional, local and individual scales has less impact; at port development slightly faster than the urban development stage, with national scale as the main factor, the influence of Russia is slightly greater than that of China, and that of other scales is small; at port development significantly faster than the city development stage, all the national, regional and individual scales play an important role, and the role is relatively balanced; at city development slightly faster than the port development stage, the role of national, regional and local scales is more obvious, and the impact of individual scale is weakened. Among them, the regional scale has the largest impact, and the national scale (Russia) > local scale > national scale (China) > individual scale; at the new abrupt change point of port-city relationship, the influence of individual and national scales is larger, while that of regional and local scales is smaller. Finally, this study makes full use of both quantitative and qualitative analysis methods, such as VAR model and in-depth interview, to examine the influence mechanism of national, regional, local and individual scales on the evolution of port-city relationship in a full period and in stages. This study can provide a multi-scale perspective for Manzhouli to promote its benign development of port-city relationship, and also provide a reference for the development of port-city interaction in the vast border areas of China.
Key words: border ports; port-city relationship; multi-scale; influencing factor; MDCI; Manzhouli
表1 多尺度因素测度指标及含义Tab. 1 Multi-scale factor measurement indicators and meaning |
| 尺度分类 | 测度指标 | 符号 | 单位 | 指标含义 | |
|---|---|---|---|---|---|
| 国家尺度 | 中国/俄罗斯 | 人口 | people | 万人 | 国家人口规模 |
| 国内生产总值 | gdp | 亿元 | 国内经济发展情况 | ||
| 工业增加值 | industry | 亿元 | 国内工农业生产活力 | ||
| 农业增加值 | agriculture | 亿元 | |||
| 货物进(出)口 | import (export) | 美元 | 外贸活跃程度 | ||
| 居民最终消费支出 | consumption | 元 | 国内居民消费活力 | ||
| 区域尺度 | 内蒙古自治区① | 人口 | people | 万人 | 区域人口规模 |
| 国内生产总值 | gdp | 亿元 | 区域经济发展情况 | ||
| 货运量 | freight | 万t | 区域交通运输能力 | ||
| 入境旅游人数 | tourist | 万人 | 区域旅游活力 | ||
| 地方尺度 | 满洲里市 | 人口 | people | 万人 | 城市人口规模 |
| 国内生产总值 | gdp | 亿元 | 城市经济发展情况 | ||
| 社会商品零售总额 | retail | 万元 | 城市商品消费能力 | ||
| 固定资产投资 | investment | 万元 | 城市基础设施投入情况 | ||
| 第三产业从业人数 | employee | 万人 | 城市就业人员结构变化 | ||
| 边境旅游人数 | border | 万人 | 地方旅游活力 | ||
| 个体尺度 | 当地居民 | 年均工资 | salary | 元 | 当地居民的经济收入情况 |
| 人均可支配收入 | income | 元 | |||
| 人均储蓄存款 | deposit | 元 | 当地居民的消费潜力 | ||
| 人均消费支出 | expenditure | 元 | 当地居民的消费活力 | ||
① 满洲里口岸行政归属虽几经变迁,但究其发展历程与地缘文化联系,与内蒙古自治区最为接近且具有一定的代表性,故选择内蒙古自治区作为区域尺度的表征主体。 |
表2 受访者属性Tab. 2 Respondent attributes |
| 受访者编号 | 性别 | 年龄 | 职业 | 属性 | 备注 |
|---|---|---|---|---|---|
| 1 | 男 | 40岁左右 | 出租车司机 | 本地人 | |
| 2 | 男 | 60岁左右 | 退休外贸从业者 | 外来定居 | 湖边钓鱼 |
| 3 | 男 | 40岁左右 | 公交车司机 | 本地人 | |
| 4 | 男 | 45岁左右 | 特产店经营者 | 外来定居 | |
| 5 | 男 | 30岁左右 | 超市经营者 | 本地人 | |
| 6 | 女 | 32岁左右 | 面包店老板 | 外来定居 | |
| 7 | 女 | 35岁左右 | 图书馆管理员 | 外来定居 | |
| 8 | 女 | 65岁左右 | 家庭主妇 | 本地人 | 前往免税区领面粉 |
| 9 | 女 | 65岁左右 | 免税店经营者 | 外来定居 | |
| 10 | 女 | 30岁左右 | 超市经营者 | 外来定居 | |
| 11 | 男 | 50岁左右 | 羊肉汤店经营者 | 本地人 | 扎赉诺尔区 |
| 12 | 男 | 30岁左右 | 街边小贩 | 本地人 | 扎赉诺尔区 |
注:无特殊备注,访谈地点均为满洲里市区。 |
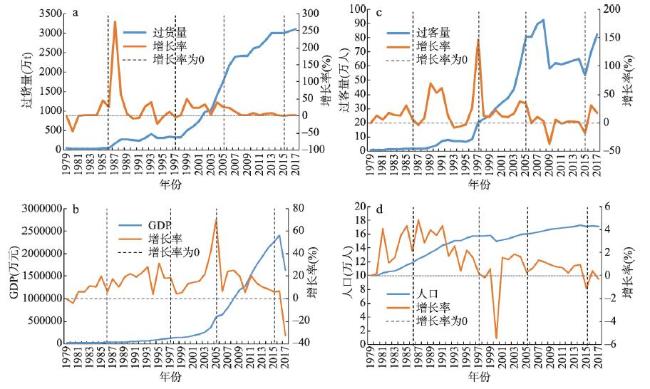
表4 不同发展阶段口岸—城市规模交叉计算DCI值Tab. 4 Cross-calculation of DCI values of port-city scales at different development stages |
| 人口 | GDP | |||||||
|---|---|---|---|---|---|---|---|---|
| 时段 | De | Di | DCIcp | 时段 | De | Di | DCIcg | |
| 过货 | 1979—1986 | -0.06 | –0.09 | -0.07 | 1979—1986年 | -0.02 | -0.03 | -0.02 |
| 1987—1997 | 3.09 | 2.52 | 2.86 | 1987—1997年 | 0.37 | 0.33 | 0.35 | |
| 1998—2005 | 104.27 | 84.62 | 96.41 | 1998—2005年 | 1.09 | 0.82 | 0.98 | |
| 2006—2015 | 5.48 | 5.29 | 5.40 | 2006—2015年 | 0.25 | 0.29 | 0.26 | |
| 2016—2017 | -7.77 | –7.69 | -7.74 | 2016—2017年 | -0.06 | -0.05 | -0.05 | |
| 时段 | De | Di | DCItp | 时段 | De | Di | DCItg | |
| 过客 | 1979—1986 | 5.86 | 5.53 | 5.73 | 1979—1986年 | 1.49 | 1.34 | 1.43 |
| 1987—1997 | 12.65 | 12.40 | 12.55 | 1987—1997年 | 1.54 | 1.60 | 1.56 | |
| 1998—2005 | 76.36 | 74.94 | 75.79 | 1998—2005年 | 0.80 | 0.73 | 0.77 | |
| 2006—2015 | -6.61 | -6.58 | -6.60 | 2006—2015年 | -0.30 | -0.36 | -0.32 | |
| 2016—2017 | -72.70 | -66.68 | -70.30 | 2016—2017年 | -0.55 | -0.42 | -0.50 | |
表5 改进动态集中指数(MDCI)计算结果Tab. 5 The calculation results of MDCI |
| 时段 | MDe | MDi | MDCI |
|---|---|---|---|
| 1979—1986 | 2.53 | 2.38 | 2.47 |
| 1987—1997 | 5.77 | 5.61 | 5.70 |
| 1998—2005 | 39.52 | 37.49 | 38.71 |
| 2006—2015 | -2.31 | -2.30 | -2.30 |
| 2016—2017 | -31.06 | -28.52 | -30.04 |
表6 不同尺度主体主成分分析结果Tab. 6 Principal component analysis results of different scale subjects |
| 主体 | 简称 | KMO检验 | Bartlett球形检验 | 总方差解释(%) | |
|---|---|---|---|---|---|
| 国家尺度 | 中国 | NSCHN | 0.77 | 1171.93** | 96.30 |
| 俄罗斯 | NSRUS | 0.73 | 556.42** | 85.94 | |
| 区域尺度 | 内蒙古 | RS | 0.80 | 189.07** | 92.99 |
| 地方尺度 | 满洲里 | LS | 0.84 | 199.30** | 85.85 |
| 个体尺度 | 居民 | IS | 0.84 | 341.25** | 99.13 |
注:**表示在0.000水平显著。 |
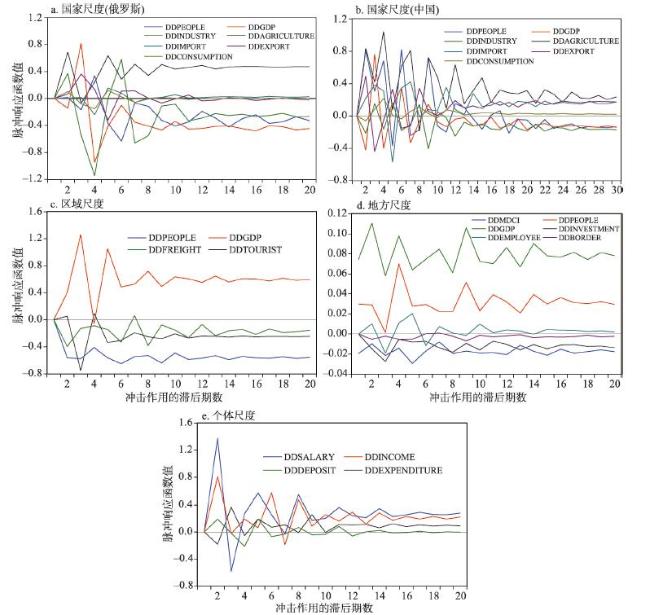
图6 不同尺度各变量与MDCI之间的脉冲响应分析注:脉冲响应函数值代表口岸与城市之间冲击引起的响应程度;DD表示进行了二次差分,具体符号含义见表1。 Fig. 6 Pulse response analysis diagram between variables of different scales and MDCI |
表7 不同尺度因素对口岸—城市关系演变的影响Tab. 7 Influence of different scale factors on the evolution of port-city relationship |
| 尺度类别 | 脉冲响应变化特征 | 驱动因素 | |
|---|---|---|---|
| 国家尺度 | 俄罗斯 | 农业增加值表现出明显的正向作用,GDP、人口、工业增加值表现出明显的负向作用 | 农业增加值、工业增加值、GDP和人口具有明显的驱动作用,其他因素作用不明显 |
| 中国 | 农业增加值、货物进(出)口、居民最终消费支出为正向作用,工业增加值、GDP、人口为负向作用 | 农业增加值、货物进(出)口、工业增加值、GDP、人口并行,居民最终消费支出影响较弱 | |
| 区域尺度 | 内蒙古 自治区 | GDP表现出正向作用,其他要素均表现为负向作用 | GDP和人口为主要驱动因素,货运量和入境旅游人数为相对次要因素 |
| 地方尺度 | 满洲里市 | GDP、人口表现出正向作用,其他均为负向作用 | GDP、人口和社会零售品消费总额为主要驱动因素,其他因素作用不明显 |
| 个体尺度 | 当地居民 | 各因素均为正向作用 | 职工年均工资、人均可支配收入、人均消费支出具有明显驱动作用,人均储蓄存款作用不明显 |
| [1] |
[ 黄宇, 葛岳静, 马腾 , 等. 中国高铁外交的地缘空间格局. 地理科学进展, 2017,36(12):1489-1499.]
|
| [2] |
[ 刘卫东, 宋周莺, 刘志高 , 等. “一带一路”建设研究进展. 地理学报, 2018,73(4):620-636.]
|
| [3] |
[ 宋周莺, 车姝韵, 王姣娥 , 等. 中国沿边口岸的时空格局及功能模式. 地理科学进展, 2015,34(5):589-597.]
|
| [4] |
[ 梁振民, 陈才 . 中俄边境城市满洲里口岸经济发展战略研究. 世界地理研究, 2012,21(2):97-104.]
|
| [5] |
[ 曾颉, 梁天戈, 李震岳 . 满洲里构建中蒙俄经济走廊重要节点城市空间发展战略探讨. 现代城市研究, 2017(5):90-99, 125.]
|
| [6] |
[ 王亚丰, 李富祥, 谷义 , 等. 基于RCI的中国东北沿边口岸与口岸城市关系研究. 现代城市研究, 2014(7):55-60.]
|
| [7] |
[ 宋涛, 陆大道, 梁宜 , 等. 近20年国际地缘政治学的研究进展. 地理学报, 2016,71(4):551-563.]
|
| [8] |
[ 周雯婷, 刘云刚, 吴寅姗 . 一国两制下的深港跨境生活空间形成: 以中英街地区为例. 地理研究, 2018,37(11):2288-2304.]
|
| [9] |
|
| [10] |
|
| [11] |
|
| [12] |
|
| [13] |
|
| [14] |
|
| [15] |
[ 吴传钧, 高小真 . 海港城市的成长模式. 地理研究, 1989,8(4):9-15.]
|
| [16] |
[ 郭建科, 韩增林 . 中国海港城市“港—城空间系统”演化理论与实证. 地理科学, 2013,33(11):1285-1292.]
|
| [17] |
[ 郭建科, 杜小飞, 孙才志 , 等. 环渤海地区港口与城市关系的动态测度及驱动模式研究. 地理研究, 2015,34(4):740-750.]
|
| [18] |
|
| [19] |
[ 陈航, 栾维新, 王跃伟 . 我国港口功能与城市功能关系的定量分析. 地理研究, 2009,28(2):475-483.]
|
| [20] |
[ 姜丽丽, 王士君, 刘志虹 . 港口与城市规模关系的评价与比较: 以辽宁省港口城市为例. 地理科学, 2011,31(12):1468-1473.]
|
| [21] |
[ 武强 . 近代中国港城关系变迁简析(1916-1936): 以相对集中系数为例的分析. 中国历史地理论丛, 2012,27(2):70-81.]
|
| [22] |
[ 郇恒飞, 焦华富, 韩会然 , 等. 连云港市的港—城协调发展模式演化及影响要素. 人文地理, 2012,27(1):77-81.]
|
| [23] |
[ 梁双波, 曹有挥, 曹卫东 , 等. 港城关联发展的生命周期模式研究: 以南京港城关联发展为例. 人文地理, 2009,24(5):66-70.]
|
| [24] |
[ 王靖, 张金锁 . 综合评价中确定权重向量的几种方法比较. 河北工业大学学报, 2001,30(2):52-57.]
|
| [25] |
|
| [26] |
[ 彭水军, 包群 . 中国经济增长与环境污染: 基于广义脉冲响应函数法的实证研究. 中国工业经济, 2006(5):15-23.]
|
| [27] |
[ 吴振信, 薛冰, 王书平 . 基于VAR模型的油价波动对我国经济影响分析. 中国管理科学, 2011,19(1):21-28.]
|
/
| 〈 |
|
〉 |