
中国城市土地财政扩张及对经济效率影响路径
|
李汝资(1988-), 男, 山东临沂人, 博士, 副教授, 硕士生导师, 中国地理学会会员(S110010742M), 主要从事区域经济与生态经济研究。E-mail: lirz390@163.com |
收稿日期: 2019-05-17
要求修回日期: 2020-04-03
网络出版日期: 2020-12-25
基金资助
国家社会科学基金项目(16CJL053)
版权
China's urban land finance expansion and the transmission routes to economic efficiency
Received date: 2019-05-17
Request revised date: 2020-04-03
Online published: 2020-12-25
Supported by
National Social Science Foundation of China(16CJL053)
Copyright
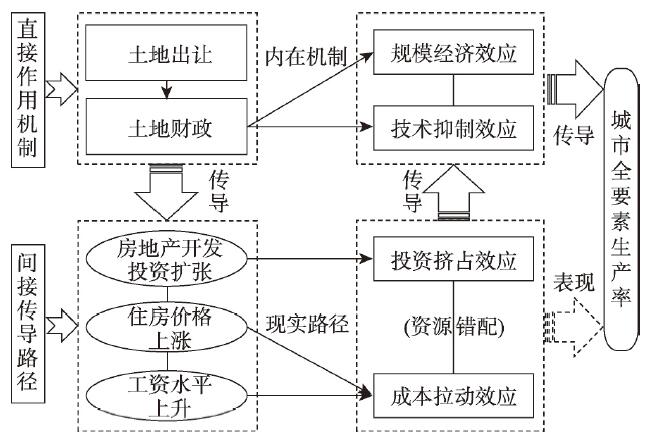
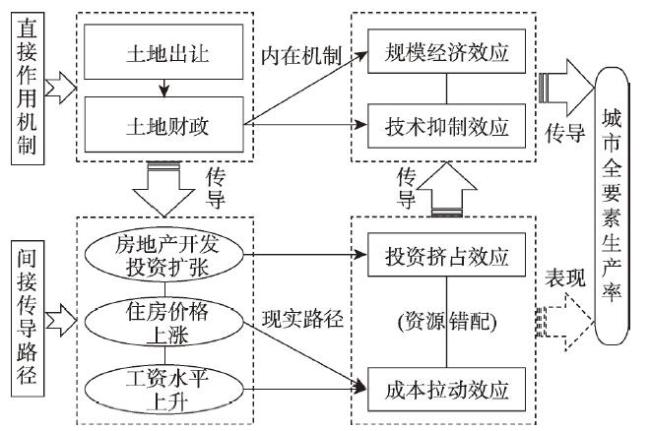
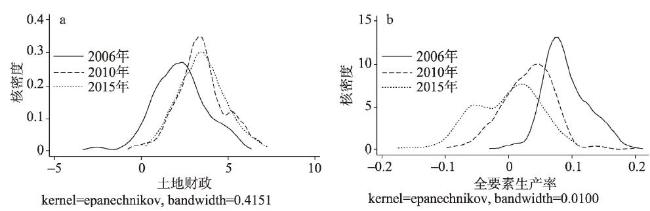
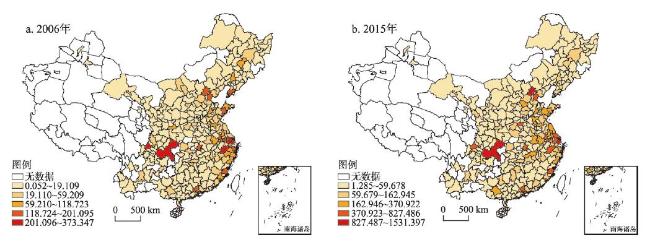
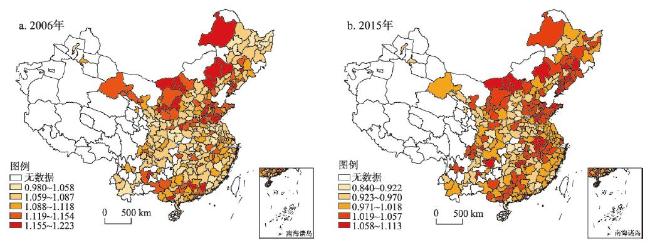
土地财政对经济效率的影响过程具有系统性、复杂性特征。本文考虑效率提升的结构性特征,从规模经济效应、技术抑制效应等方面构建土地财政对全要素生产率影响机制,进而从投资挤占效应、成本拉动效应探索其传导路径,并基于2005—2015年中国285座地级以上城市面板数据集,运用固定效应模型对其影响过程机理与区域分异特征进行实证检验。结果表明:① 2005—2015年间,中国城市土地财政规模持续扩张,并由沿海城市向内陆城市扩散,但城市全要素生产率增长率却出现波动下降趋势。② 整体上,土地财政对城市全要素生产率产生显著的负向影响,且对西部、中部、东北等地区以及中小城市、Ⅰ型大城市、Ⅱ型大城市的影响依次增强,而东部地区与超特大城市并不显著。③ 土地财政对经济效率影响的技术抑制效应显著大于规模经济效应,中部地区、Ⅰ型、Ⅱ型及超特大城市尤其严重。④ 具体传导路径为,土地财政扩张主要通过房地产开发带来的投资挤占效应影响城市全要素生产率,其次是房价上涨的成本拉动效应,而工资水平上升主要在东部地区、Ⅰ型及以下规模城市发挥作用。以上结论在一系列稳健性检验后依然成立。最后提出明确土地出让收支范围、产业梯度转移与升级、宏观调控与因城施策并行等政策建议。
李汝资 , 刘耀彬 , 王文刚 , 谢德金 . 中国城市土地财政扩张及对经济效率影响路径[J]. 地理学报, 2020 , 75(10) : 2126 -2145 . DOI: 10.11821/dlxb202010007
Land finance has been favored by local governments along with the rapid expansion of urbanization and industrialization, but it draws the attention of the central government recently and then tends to be alleviated. The influencing process of land finance on economic efficiency is systematic and complex. Considering the structural characteristics of economic efficiency growth, this paper constructs the multi-level mechanism and path of land finance's influence on economic efficiency, from the aspects of scaling effect, technical-inhibition effect, investment crowding-out effect and cost-pulling effect. Then this paper employs the fixed effect model to empirically test the impact and regional differences of land finance on total factor productivity (TFP) of 285 Chinese cities from 2005 to 2015. The results show that: Firstly, China's urban land financial scale continued to expand, and spread from the coastal cities to the inland cities in the study period. At the same time, the urban TFP growth rate presents a fluctuation downward tendency. Secondly, the baseline regression shows that the land finance expansion has a significant negative impact on the growth of urban TFP. And the impact on western, central, northeastern China and small and medium-sized cities, I type and II type cities gradually increase in order, while the impact is not significant in eastern China and large cities with a population of three million or more. Thirdly, although the land finance has a certain scale economic effect on regional development, it mainly inhibits technological progress to directly hinder the TFP growth. And it is more serious in central and western China and cities with a population more than one million. Further, it is mainly through investment crowding-out effect brought by the real estate development that the land finance affects urban TFP, followed by the cost-pulling effect by house prices rising, while wages rising mainly affects urban TFP in eastern China and cities with a population less than three million. The above conclusions are still valid after a series of robustness tests. Finally, this paper puts forward some policy suggestions, such as defining the scope of revenue and expenditure of land finance, gradient transfer and upgrading of industries and macro-control and implementing targeted policies to each city.
表1 2005—2015年中国城市TFP的时间演化与区域差异Tab. 1 Temporal evolution and regional differences of TFP in Chinese cities in 2005-2015 |
| 变量 | 地区 | 2005—2006年 | 2007—2008年 | 2009—2010年 | 2011—2012年 | 2013—2014年 | 2014—2015年 |
|---|---|---|---|---|---|---|---|
| 全国 | 1.095 | 1.070 | 1.032 | 1.006 | 0.992 | 0.998 | |
| 东部地区 | 1.103 | 1.064 | 1.040 | 1.012 | 1.010 | 1.006 | |
| TFP | 中部地区 | 1.085 | 1.063 | 1.021 | 0.992 | 0.973 | 0.977 |
| 西部地区 | 1.102 | 1.077 | 1.034 | 1.009 | 0.987 | 1.001 | |
| 东北地区 | 1.081 | 1.085 | 1.031 | 1.015 | 1.000 | 1.020 | |
| 全国 | 1.045 | 1.102 | 1.024 | 1.027 | 1.030 | 1.007 | |
| 东部地区 | 1.053 | 1.104 | 1.027 | 1.036 | 1.035 | 1.015 | |
| TECH | 中部地区 | 1.040 | 1.097 | 1.019 | 1.018 | 1.023 | 0.998 |
| 西部地区 | 1.042 | 1.105 | 1.029 | 1.027 | 1.031 | 1.006 | |
| 东北地区 | 1.047 | 1.098 | 1.019 | 1.025 | 1.030 | 1.006 | |
| 全国 | 1.024 | 0.985 | 1.015 | 1.008 | 1.000 | 1.006 | |
| 东部地区 | 1.027 | 0.985 | 1.021 | 0.998 | 0.987 | 1.000 | |
| SECH | 中部地区 | 1.016 | 0.989 | 1.010 | 1.007 | 0.994 | 1.003 |
| 西部地区 | 1.032 | 0.985 | 1.014 | 1.017 | 1.020 | 1.014 | |
| 东北地区 | 1.017 | 0.977 | 1.011 | 1.014 | 0.995 | 1.009 |
注:限于篇幅,仅列出部分年份结果。 |
表2 中国城市土地财政扩张对经济效率影响的基准回归结果①Tab. 2 Regression results of the impact of land finance on economic efficiency in Chinese cities |
| 解释 变量 | 全国 | 东部 地区 | 中部 地区 | 西部 地区 | 东北 地区 | 超特 大城市 | Ⅰ型 大城市 | Ⅱ型 大城市 | 中小 城市 |
|---|---|---|---|---|---|---|---|---|---|
| lnlandfinance | -0.00674*** | -0.00386 | -0.0107*** | -0.00510** | -0.0146*** | -0.000545 | -0.00909* | -0.00921*** | -0.00659*** |
| (-4.57) | (-1.62) | (-3.28) | (-2.03) | (-2.97) | (-0.09) | (-1.70) | (-3.25) | (-3.55) | |
| lnownership | 0.0122*** | 0.0264*** | 0.00731* | 0.00629 | 0.00962 | 0.0351** | 0.00753 | 0.0141*** | 0.0118*** |
| (4.62) | (5.39) | (1.74) | (1.13) | (1.16) | (1.99) | (0.67) | (2.66) | (3.64) | |
| lnstructure | 0.00981* | -0.000307 | 0.00705 | -0.0172 | 0.0147 | 0.166*** | 0.0308 | 0.0630*** | -0.00605 |
| (1.91) | (-0.03) | (0.66) | (-1.64) | (0.92) | (5.11) | (1.14) | (5.51) | (-0.97) | |
| lnscifiscal | 0.00912*** | 0.00293 | 0.00589* | 0.0128*** | 0.0149*** | 0.00737 | -0.00122 | 0.0134*** | 0.00780*** |
| (5.85) | (1.31) | (1.94) | (3.65) | (2.64) | (1.48) | (-0.25) | (5.06) | (3.63) | |
| lnfiscal | -0.0381*** | -0.0428*** | -0.00714 | -0.0406*** | -0.0154 | -0.0258 | -0.0447 | -0.0213 | -0.0364*** |
| (-5.17) | (-2.89) | (-0.44) | (-3.54) | (-0.63) | (-0.81) | (-1.26) | (-1.44) | (-4.00) | |
| lntrade | 0.00543** | 0.0139*** | 0.00517 | 0.00508 | 0.00428 | 0.0117 | 0.0368* | 0.00469 | 0.00478* |
| (2.58) | (2.87) | (1.27) | (1.48) | (0.64) | (1.25) | (1.82) | (0.88) | (1.95) | |
| lnroaddensity | 0.0837*** | 0.114*** | 0.105*** | 0.0692*** | 0.0338*** | 0.169*** | 0.161*** | 0.0683*** | 0.0876*** |
| (18.93) | (15.24) | (13.20) | (7.27) | (2.72) | (7.29) | (7.26) | (9.15) | (15.43) | |
| lnpubt | 0.00555* | 0.0108** | 0.00557 | -0.00800 | -0.000244 | 0.0153 | 0.0179 | 0.00625 | 0.00415 |
| (1.74) | (2.31) | (1.04) | (-1.11) | (-0.02) | (0.66) | (1.11) | (0.88) | (1.10) | |
| lngreen | 0.000969 | -0.00783 | 0.00487 | 0.00116 | 0.000556 | -0.00615 | 0.0113 | -0.00834 | 0.000761 |
| (0.31) | (-1.63) | (0.74) | (0.21) | (0.04) | (-0.47) | (0.84) | (-1.05) | (0.20) | |
| lninternet | -0.0151*** | -0.0150*** | -0.00907 | -0.0142** | -0.0158 | 0.0119 | -0.0139 | -0.00100 | -0.0235*** |
| (-5.36) | (-4.32) | (-1.37) | (-2.32) | (-1.40) | (1.10) | (-1.61) | (-0.24) | (-5.55) | |
| 个体效应 | 是 | 是 | 是 | 是 | 是 | 是 | 是 | 是 | 是 |
| 时间趋势 | 是 | 是 | 是 | 是 | 是 | 是 | 是 | 是 | 是 |
| 常数项 | 17.54*** | 14.38*** | 27.52*** | 16.25*** | 10.58** | 35.97*** | 14.46* | 22.98*** | 15.20*** |
| (10.83) | (5.15) | (7.88) | (4.93) | (2.00) | (6.25) | (1.92) | (7.54) | (6.71) | |
| N | 3058 | 952 | 876 | 856 | 374 | 132 | 163 | 666 | 2097 |
| R2 | 0.364 | 0.426 | 0.490 | 0.328 | 0.237 | 0.563 | 0.455 | 0.447 | 0.357 |
注:括号中为t统计量;*、**、***分别表示在10%、5%、1%水平上显著,后文同。 |
表3 中国城市土地财政扩张对经济效率影响的规模经济效应Tab. 3 Scale effect of land finance on economic efficiency in Chinese cities |
| 解释 变量 | 被解释变量:lnSECH | ||||||||
|---|---|---|---|---|---|---|---|---|---|
| 全国 | 东部 地区 | 中部 地区 | 西部 地区 | 东北 地区 | 超特 大城市 | Ⅰ型 大城市 | Ⅱ型 大城市 | 中小 城市 | |
| lnlandfinance | 0.00325*** | 0.00364** | 0.00407*** | 0.00188 | 0.00383 | 0.0154** | 0.00443 | 0.00702*** | 0.00150 |
| (3.54) | (2.11) | (2.71) | (1.03) | (1.53) | (2.06) | (0.91) | (3.78) | (1.39) | |
| 控制变量 | 是 | 是 | 是 | 是 | 是 | 是 | 是 | 是 | 是 |
| 特征变量 | 是 | 是 | 是 | 是 | 是 | 是 | 是 | 是 | 是 |
| 个体效应 | 是 | 是 | 是 | 是 | 是 | 是 | 是 | 是 | 是 |
| 时间趋势 | 是 | 是 | 是 | 是 | 是 | 是 | 是 | 是 | 是 |
| 常数项 | 5.292*** | 11.65*** | 6.199*** | 1.821 | 0.923 | 16.42** | 4.372 | 5.269*** | 4.023*** |
| (5.24) | (5.77) | (3.87) | (0.76) | (0.34) | (2.25) | (0.64) | (2.64) | (3.05) | |
| N | 3058 | 952 | 876 | 856 | 374 | 132 | 163 | 666 | 2097 |
| R2 | 0.042 | 0.113 | 0.063 | 0.058 | 0.065 | 0.161 | 0.150 | 0.117 | 0.029 |
注:限于篇幅,仅报告了核心解释变量与中介变量结果,后文同。 |
表4 中国城市土地财政扩张对经济效率影响的技术抑制效应Tab. 4 Technical inhibition effect of land finance on economic efficiency in Chinese cities |
| 解释 变量 | 被解释变量:lnTECH | ||||||||
|---|---|---|---|---|---|---|---|---|---|
| 全国 | 东部 地区 | 中部 地区 | 西部 地区 | 东北 地区 | 超特 大城市 | Ⅰ型 大城市 | Ⅱ型 大城市 | 中小 城市 | |
| lnlandfinance | -0.0122*** | -0.0138*** | -0.0149*** | -0.0111*** | -0.00833*** | -0.0182** | -0.0169*** | -0.0147*** | -0.0117*** |
| (-11.67) | (-6.70) | (-7.16) | (-6.39) | (-2.79) | (-2.29) | (-3.88) | (-6.12) | (-9.59) | |
| 控制变量 | 是 | 是 | 是 | 是 | 是 | 是 | 是 | 是 | 是 |
| 特征变量 | 是 | 是 | 是 | 是 | 是 | 是 | 是 | 是 | 是 |
| 个体效应 | 是 | 是 | 是 | 是 | 是 | 是 | 是 | 是 | 是 |
| 时间趋势 | 是 | 是 | 是 | 是 | 是 | 是 | 是 | 是 | 是 |
| 常数项 | -0.00544*** | -0.00145 | -0.00702*** | -0.00651*** | -0.00450*** | -0.00565 | -0.00812*** | -0.00530*** | -0.00482*** |
| (9.65) | (1.23) | (6.40) | (5.79) | (2.86) | (1.47) | (2.69) | (4.15) | (6.62) | |
| N | 3058 | 952 | 876 | 856 | 374 | 132 | 163 | 666 | 2097 |
| R2 | 0.309 | 0.316 | 0.434 | 0.322 | 0.250 | 0.263 | 0.440 | 0.300 | 0.322 |
表5 中国城市土地财政扩张对经济效率影响的间接传导路径Tab. 5 The indirect routes of land finance to economic efficiency in Chinese cities |
| lnhouseinvest | lnTFP | lnsalary | lnTFP | lnhouseprice | lnTFP | |
|---|---|---|---|---|---|---|
| lnlandfinance | 0.152*** | 0.0173*** | 0.0432*** | |||
| (15.37) | (7.16) | (10.85) | ||||
| lnhouseinvest | -0.0159*** | |||||
| (-5.86) | ||||||
| lnsalary | -0.0454*** | |||||
| (-3.94) | ||||||
| lnhouseprice | -0.0346*** | |||||
| (-5.01) | ||||||
| 控制变量 | 是 | 是 | 是 | 是 | 是 | 是 |
| 特征变量 | 是 | 是 | 是 | 是 | 是 | 是 |
| 个体效应 | 是 | 是 | 是 | 是 | 是 | 是 |
| 时间趋势 | 是 | 是 | 是 | 是 | 是 | 是 |
| 常数项 | -279.0*** | 14.03*** | -211.7*** | 9.217*** | -174.7*** | 12.62*** |
| (-25.67) | (7.80) | (-79.71) | (3.13) | (-39.96) | (6.21) | |
| N | 3058 | 3058 | 3058 | 3058 | 3058 | 3058 |
| R2 | 0.862 | 0.367 | 0.970 | 0.363 | 0.904 | 0.365 |
表6 中国东部地区城市土地财政扩张对经济效率影响的间接传导路径Tab. 6 The indirect routes of urban land finance expansion to economic efficiency in Eastern China |
| lnhouseinvest | lnTFP | lnsalary | lnTFP | lnhouseprice | lnTFP | |
|---|---|---|---|---|---|---|
| lnlandfinance | 0.125*** | 0.0190*** | 0.0869*** | |||
| (8.55) | (4.39) | (12.58) | ||||
| lnhouseinvest | -0.0279*** | |||||
| (-5.28) | ||||||
| lnsalary | -0.0972*** | |||||
| (-5.31) | ||||||
| lnhouseprice | -0.0196* | |||||
| (-1.80) | ||||||
| 控制变量 | 是 | 是 | 是 | 是 | 是 | 是 |
| 特征变量 | 是 | 是 | 是 | 是 | 是 | 是 |
| 个体效应 | 是 | 是 | 是 | 是 | 是 | 是 |
| 时间趋势 | 是 | 是 | 是 | 是 | 是 | 是 |
| 常数项 | -294.5*** | 6.226* | -195.4*** | -4.279 | -169.3*** | 11.42*** |
| (-17.22) | (1.95) | (-38.43) | (-0.94) | (-20.92) | (3.35) | |
| N | 952 | 952 | 952 | 952 | 952 | 952 |
| R2 | 0.907 | 0.442 | 0.973 | 0.443 | 0.921 | 0.426 |
表7 中国中部地区城市土地财政扩张对经济效率影响的间接传导路径Tab. 7 The indirect routes of urban land finance expansion to economic efficiency in Central China |
| lnhouseinvest | lnTFP | lnsalary | lnTFP | lnhouseprice | lnTFP | |
|---|---|---|---|---|---|---|
| lnlandfinance | 0.135*** | 0.0219*** | 0.0211*** | |||
| (6.50) | (4.08) | (2.62) | ||||
| lnhouseinvest | -0.0195*** | |||||
| (-3.57) | ||||||
| lnsalary | -0.00788 | |||||
| (-0.36) | ||||||
| lnhouseprice | -0.0466*** | |||||
| (-3.22) | ||||||
| 控制变量 | 是 | 是 | 是 | 是 | 是 | 是 |
| 特征变量 | 是 | 是 | 是 | 是 | 是 | 是 |
| 个体效应 | 是 | 是 | 是 | 是 | 是 | 是 |
| 时间趋势 | 是 | 是 | 是 | 是 | 是 | 是 |
| 常数项 | -269.7*** | 24.02*** | -212.8*** | 28.13*** | -185.0*** | 21.01*** |
| (-12.13) | (6.34) | (-37.22) | (4.81) | (-21.53) | (4.79) | |
| N | 876 | 876 | 876 | 876 | 876 | 876 |
| R2 | 0.893 | 0.491 | 0.974 | 0.483 | 0.928 | 0.490 |
表8 中国西部地区城市土地财政扩张对经济效率影响的间接传导路径Tab. 8 The indirect routes of urban land finance expansion to economic efficiency in Western China |
| lnhouseinvest | lnTFP | lnsalary | lnTFP | lnhouseprice | lnTFP | |
|---|---|---|---|---|---|---|
| lnlandfinance | 0.130*** | 0.0158*** | 0.0283*** | |||
| (7.80) | (4.09) | (3.75) | ||||
| lnhouseinvest | -0.00885* | |||||
| (-1.68) | ||||||
| lnsalary | -0.0176 | |||||
| (-0.75) | ||||||
| lnhouseprice | -0.0393*** | |||||
| (-3.30) | ||||||
| 控制变量 | 是 | 是 | 是 | 是 | 是 | 是 |
| 特征变量 | 是 | 是 | 是 | 是 | 是 | 是 |
| 个体效应 | 是 | 是 | 是 | 是 | 是 | 是 |
| 时间趋势 | 是 | 是 | 是 | 是 | 是 | 是 |
| 常数项 | -319.2*** | 14.32*** | -223.2*** | 13.42** | -185.3*** | 9.867** |
| (-14.62) | (3.84) | (-44.07) | (2.16) | (-18.74) | (2.49) | |
| N | 856 | 856 | 856 | 856 | 856 | 856 |
| R2 | 0.858 | 0.327 | 0.972 | 0.325 | 0.883 | 0.334 |
表9 东北地区城市土地财政扩张对经济效率影响的间接传导路径Tab. 9 The indirect routes of urban land finance expansion to economic efficiency in Northeastern China |
| lnhouseinvest | lnTFP | lnsalary | lnTFP | lnhouseprice | lnTFP | |
|---|---|---|---|---|---|---|
| lnlandfinance | 0.263*** | 0.00543 | 0.0308*** | |||
| (6.78) | (0.78) | (3.11) | ||||
| lnhouseinvest | -0.0164** | |||||
| (-2.49) | ||||||
| lnsalary | -0.0299 | |||||
| (-0.75) | ||||||
| lnhouseprice | -0.0531* | |||||
| (-1.95) | ||||||
| 控制变量 | 是 | 是 | 是 | 是 | 是 | 是 |
| 特征变量 | 是 | 是 | 是 | 是 | 是 | 是 |
| 个体效应 | 是 | 是 | 是 | 是 | 是 | 是 |
| 时间趋势 | 是 | 是 | 是 | 是 | 是 | 是 |
| 常数项 | -192.8*** | 8.967 | -205.1*** | 6.629 | -159.4*** | 4.063 |
| (-4.63) | (1.64) | (-27.59) | (0.68) | (-15.00) | (0.59) | |
| N | 374 | 374 | 374 | 374 | 374 | 374 |
| R2 | 0.756 | 0.231 | 0.967 | 0.218 | 0.905 | 0.225 |
表10 超特大城市土地财政扩张对经济效率影响的间接传导路径Tab. 10 The indirect routes of urban land finance expansion to economic efficiency in cities with a population more than 5 million |
| lnhouseinvest | lnTFP | lnsalary | lnTFP | lnhouseprice | lnTFP | |
|---|---|---|---|---|---|---|
| lnlandfinance | 0.101*** | 0.00815 | 0.0849*** | |||
| (3.25) | (0.79) | (4.49) | ||||
| lnhouseinvest | -0.0491*** | |||||
| (-2.95) | ||||||
| lnsalary | -0.0929* | |||||
| (-1.74) | ||||||
| lnhouseprice | -0.00704 | |||||
| (-0.26) | ||||||
| 控制变量 | 是 | 是 | 是 | 是 | 是 | 是 |
| 特征变量 | 是 | 是 | 是 | 是 | 是 | 是 |
| 个体效应 | 是 | 是 | 是 | 是 | 是 | 是 |
| 时间趋势 | 是 | 是 | 是 | 是 | 是 | 是 |
| 常数项 | -241.3*** | 23.00*** | -194.0*** | 17.89 | -106.3*** | 35.21*** |
| (-7.94) | (3.31) | (-19.15) | (1.51) | (-5.75) | (5.37) | |
| N | 132 | 132 | 132 | 132 | 132 | 132 |
| R2 | 0.944 | 0.595 | 0.984 | 0.575 | 0.944 | 0.563 |
表11 Ⅰ型大城市土地财政扩张对经济效率影响的间接传导路径Tab. 11 The indirect routes of urban land finance expansion to economic efficiency incities with a population between 3 million and 5 million |
| lnhouseinvest | lnTFP | lnsalary | lnTFP | lnhouseprice | lnTFP | |
|---|---|---|---|---|---|---|
| lnlandfinance | 0.118*** | 0.0184** | 0.0408*** | |||
| (4.82) | (2.13) | (3.15) | ||||
| lnhouseinvest | -0.0235 | |||||
| (-1.35) | ||||||
| lnsalary | -0.0940* | |||||
| (-1.81) | ||||||
| lnhouseprice | -0.0772** | |||||
| (-2.29) | ||||||
| 控制变量 | 是 | 是 | 是 | 是 | 是 | 是 |
| 特征变量 | 是 | 是 | 是 | 是 | 是 | 是 |
| 个体效应 | 是 | 是 | 是 | 是 | 是 | 是 |
| 时间趋势 | 是 | 是 | 是 | 是 | 是 | 是 |
| 常数项 | -279.4*** | 8.834 | -249.8*** | -7.945 | -154.7*** | 3.392 |
| (-8.13) | (0.97) | (-20.56) | (-0.53) | (-8.49) | (0.37) | |
| N | 163 | 163 | 163 | 163 | 163 | 163 |
| R2 | 0.937 | 0.451 | 0.979 | 0.457 | 0.938 | 0.464 |
表12 Ⅱ型大城市土地财政扩张对经济效率影响的间接传导路径Tab. 12 The indirect routes of urban land finance expansion to economic efficiency incitieswith population between1 million and3million |
| lnhouseinvest | lnTFP | lnsalary | lnTFP | lnhouseprice | lnTFP | |
|---|---|---|---|---|---|---|
| lnlandfinance | 0.166*** | 0.0228*** | 0.0577*** | |||
| (10.18) | (4.28) | (6.83) | ||||
| lnhouseinvest | -0.0275*** | |||||
| (-4.19) | ||||||
| lnsalary | -0.0380* | |||||
| (-1.75) | ||||||
| lnhouseprice | -0.0452*** | |||||
| (-3.41) | ||||||
| 控制变量 | 是 | 是 | 是 | 是 | 是 | 是 |
| 特征变量 | 是 | 是 | 是 | 是 | 是 | 是 |
| 个体效应 | 是 | 是 | 是 | 是 | 是 | 是 |
| 时间趋势 | 是 | 是 | 是 | 是 | 是 | 是 |
| 常数项 | -365.9*** | 14.17*** | -212.0*** | 17.19*** | -180.6*** | 16.61*** |
| (-20.94) | (3.56) | (-37.09) | (3.08) | (-19.90) | (4.23) | |
| N | 666 | 666 | 666 | 666 | 666 | 666 |
| R2 | 0.923 | 0.453 | 0.971 | 0.440 | 0.910 | 0.448 |
表13 中小城市土地财政扩张对经济效率影响的间接传导路径Tab. 13 The indirect routes of urban land finance expansion to economic efficiency incities with a population less than 1 million |
| lnhouseinvest | lnTFP | lnsalary | lnTFP | lnhouseprice | lnTFP | |
|---|---|---|---|---|---|---|
| lnlandfinance | 0.151*** | 0.0158*** | 0.0377*** | |||
| (11.69) | (5.47) | (7.67) | ||||
| lnhouseinvest | -0.0118*** | |||||
| (-3.71) | ||||||
| lnsalary | -0.0354** | |||||
| (-2.41) | ||||||
| lnhouseprice | -0.0279*** | |||||
| (-3.26) | ||||||
| 控制变量 | 是 | 是 | 是 | 是 | 是 | 是 |
| 特征变量 | 是 | 是 | 是 | 是 | 是 | 是 |
| 个体效应 | 是 | 是 | 是 | 是 | 是 | 是 |
| 时间趋势 | 是 | 是 | 是 | 是 | 是 | 是 |
| 常数项 | -266.3*** | 12.96*** | -212.1*** | 8.832** | -172.5*** | 11.44*** |
| (-16.89) | (5.34) | (-60.12) | (2.28) | (-28.76) | (4.21) | |
| N | 2097 | 2097 | 2097 | 2097 | 2097 | 2097 |
| R2 | 0.845 | 0.358 | 0.971 | 0.355 | 0.901 | 0.357 |
| [1] |
[ 刘世锦, 刘培林, 何建武 . 我国未来生产率提升潜力与经济增长前景. 管理世界, 2015(3):1-5.]
|
| [2] |
[ 李郇, 洪国志, 黄亮雄 . 中国土地财政增长之谜: 分税制改革、土地财政增长的策略性. 经济学(季刊), 2013,12(4):1141-1160.]
|
| [3] |
[ 王丰龙, 刘云刚 . 中国城市建设用地扩张与财政收入增长的面板格兰杰因果检验. 地理学报, 2013,68(12):1595-1606.]
|
| [4] |
China Economic Growth Frontier Research Group. Urbanization, fiscal expansion and economic growth. Economic Research Journal, 2011,46(11):4-20.
[ 中国经济增长前沿课题组. 城市化、财政扩张与经济增长. 经济研究, 2011,46(11):4-20.]
|
| [5] |
[ 徐升艳, 陈杰, 赵刚 . 土地出让市场化如何促进经济增长. 中国工业经济, 2018(3):44-61.]
|
| [6] |
[ 邹秀清 . 中国土地财政与经济增长的关系研究: 土地财政库兹涅兹曲线假说的提出与面板数据检验. 中国土地科学, 2013,27(5):14-19.]
|
| [7] |
[ 赵燕菁 . 土地财政:历史、逻辑与抉择. 城市发展研究, 2014,21(1):1-13.]
|
| [8] |
[ 夏方舟, 李洋宇, 严金明 . 产业结构视角下土地财政对经济增长的作用机制: 基于城市动态面板数据的系统GMM分析. 经济地理, 2014,34(12):85-92.]
|
| [9] |
[ 王先柱, 吴蕾 . 土地财政、房价上涨与产业结构升级: 基于面板数据联立方程模型的分析. 经济问题探索, 2019(3):32-39.]
|
| [10] |
[ 岳树民, 卢艺 . 土地财政影响中国经济增长的传导机制: 数理模型推导及基于省际面板数据的分析. 财贸经济, 2016(5):37-47, 105.]
|
| [11] |
[ 高波, 陈健, 邹琳华 . 区域房价差异、劳动力流动与产业升级. 经济研究, 2012,47(1):66-79.]
|
| [12] |
[ 蒋震 . 工业化水平、地方政府努力与土地财政: 对中国土地财政的一个分析视角. 中国工业经济, 2014(10):33-45.]
|
| [13] |
|
| [14] |
[ 李力行, 黄佩媛, 马光荣 . 土地资源错配与中国工业企业生产率差异. 管理世界, 2016(8):86-96.]
|
| [15] |
[ 刘凯 . 中国特色的土地制度如何影响中国经济增长: 基于多部门动态一般均衡框架的分析. 中国工业经济, 2018(10):80-98.]
|
| [16] |
[ 周彬, 周彩 . 土地财政、产业结构与经济增长: 基于基于284个地级以上城市数据的研究. 经济学家, 2018(5):39-49.]
|
| [17] |
[ 陈淑云, 曾龙, 李伟华 . 地方政府竞争、土地出让与城市生产率: 来自中国281个地级市的经验证据. 财经科学, 2017(7):102-115.]
|
| [18] |
[ 张少辉, 余泳泽 . 土地出让、资源错配与全要素生产率. 财经研究, 2019,45(2):73-85.]
|
| [19] |
|
| [20] |
|
| [21] |
[ 梁强 . 土地财政、金融发展与全要素生产率. 经济经纬, 2017,34(4):147-152.]
|
| [22] |
[ 陶然, 袁飞, 曹广忠 . 区域竞争、土地出让与地方财政效应: 基于1999—2003年中国地级城市面板数据的分析. 世界经济, 2007(10):15-27.]
|
| [23] |
[ 李郇, 洪国志 . 土地财政与城市经济发展问题. 中国土地科学, 2013,27(7):41-47.]
|
| [24] |
[ 陈彦斌, 刘哲希 . 推动资产价格上涨能够“稳增长”吗? 基于含有市场预期内生变化的DSGE模型. 经济研究, 2017,52(7):49-64.]
|
| [25] |
[ 余泳泽, 张少辉 . 城市房价、限购政策与技术创新. 中国工业经济, 2017(6):98-116.]
|
| [26] |
[ 吕炜, 高帅雄 . 房价波动、土地财政与我国宏观经济. 经济社会体制比较, 2016(4):54-67.]
|
| [27] |
[ 梅冬州, 崔小勇, 吴娱 . 房价变动、土地财政与中国经济波动. 经济研究, 2018,53(1):35-49.]
|
| [28] |
[ 蔡昉 . 人口转变、人口红利与刘易斯转折点. 经济研究, 2010,45(4):4-13.]
|
| [29] |
[ 陈斌开, 黄少安, 欧阳涤非 . 房地产价格上涨能推动经济增长吗? 经济学(季刊), 2018,17(3):1079-1102.]
|
| [30] |
[ 陆铭, 张航, 梁文泉 . 偏向中西部的土地供应如何推升了东部的工资. 中国社会科学, 2015(5): 59-83, 204-205..]
|
| [31] |
|
| [32] |
[ 余靖雯, 肖洁, 龚六堂 . 政治周期与地方政府土地出让行为. 经济研究, 2015,50(2):88-102, 144.]
|
| [33] |
[ 李江龙, 徐斌 . “诅咒”还是“福音”: 资源丰裕程度如何影响中国绿色经济增长? 经济研究, 2018,53(9):151-167.]
|
| [34] |
[ 陈诗一, 陈登科 . 雾霾污染、政府治理与经济高质量发展. 经济研究, 2018,53(2):20-34.]
|
| [35] |
[ 余泳泽, 刘大勇, 龚宇 . 过犹不及事缓则圆: 地方经济增长目标约束与全要素生产率. 管理世界, 2019,35(7):26-42, 202.]
|
| [36] |
[ 张莉, 何晶, 马润泓 . 房价如何影响劳动力流动? 经济研究, 2017,52(8):155-170.]
|
| [37] |
[ 刘修岩, 李松林, 秦蒙 . 城市空间结构与地区经济效率: 兼论中国城镇化发展道路的模式选择. 管理世界, 2017(1):51-64.]
|
| [38] |
[ 李汝资, 刘耀彬, 谢德金 . 中国产业结构变迁中的经济效率演进及影响因素. 地理学报, 2017,72(12):2179-2198.]
|
| [39] |
[ 徐淑丹 . 中国城市的资本存量估算和技术进步率: 1992—2014年. 管理世界, 2017(1):17-29, 187.]
|
| [40] |
|
| [41] |
[ 张军, 施少华 . 中国经济全要素生产率变动: 1952—1998. 世界经济文汇, 2003(2):17-24.]
|
| [42] |
[ 孙秀林, 周飞舟 . 土地财政与分税制: 一个实证解释. 中国社会科学, 2013(4):40-59, 205.]
|
| [43] |
[ 邹薇, 刘红艺 . 土地财政“饮鸩止渴”了吗: 基于中国地级市的时空动态空间面板分析. 经济学家, 2015(9):21-32.]
|
| [44] |
[ 邵朝对, 苏丹妮, 邓宏图 . 房价、土地财政与城市集聚特征: 中国式城市发展之路. 管理世界, 2016(2):19-31, 187.]
|
| [45] |
[ 邵帅, 范美婷, 杨莉莉 . 资源产业依赖如何影响经济发展效率? 有条件资源诅咒假说的检验及解释. 管理世界, 2013(2):32-63.]
|
| [46] |
[ 干春晖, 郑若谷, 余典范 . 中国产业结构变迁对经济增长和波动的影响. 经济研究, 2011(5):4-16.]
|
| [47] |
[ 陈斌开, 金箫, 欧阳涤非 . 住房价格、资源错配与中国工业企业生产率. 世界经济, 2015,38(4):77-98.]
|
| [48] |
[ 王文春, 荣昭 . 房价上涨对工业企业创新的抑制影响研究. 经济学(季刊), 2014,13(2):465-490.]
|
| [49] |
[ 崔莹莹, 陈可石, 高庆浩 . 房价上涨的创新抑制效应及其传导机制. 城市问题, 2018(10):4-11.]
|
| [50] |
|
/
| 〈 |
|
〉 |