
基于Google Earth Engine和作物模型快速评估低温冷害对大豆生产的影响
|
曹娟(1994-), 女, 博士生, 主要从事农业系统对全球变化的响应研究。E-mail: caojuan@mail.bnu.edu.cn |
收稿日期: 2019-06-15
要求修回日期: 2020-04-08
网络出版日期: 2020-11-25
基金资助
国家自然科学基金项目(41977405)
国家自然科学基金项目(31561143003)
国家自然科学基金项目(41571493)
国家自然科学基金项目(41621061)
版权
Damage evaluation on soybean chilling injury based on Google Earth Engine (GEE) and crop growth model
Received date: 2019-06-15
Request revised date: 2020-04-08
Online published: 2020-11-25
Supported by
National Natural Science Foundation of China(41977405)
National Natural Science Foundation of China(31561143003)
National Natural Science Foundation of China(41571493)
National Natural Science Foundation of China(41621061)
Copyright
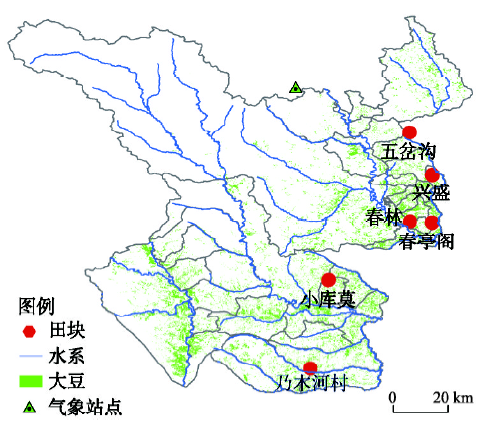
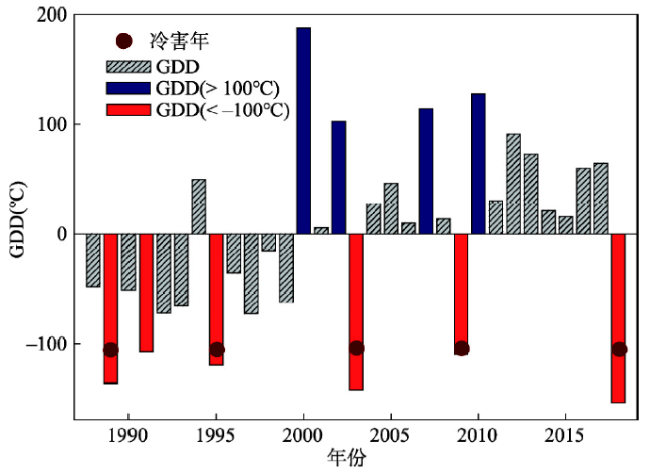
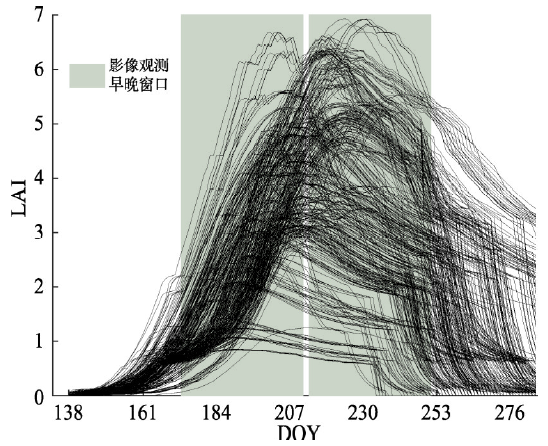
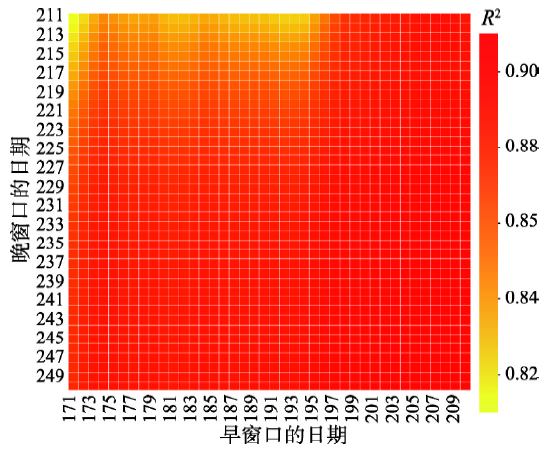
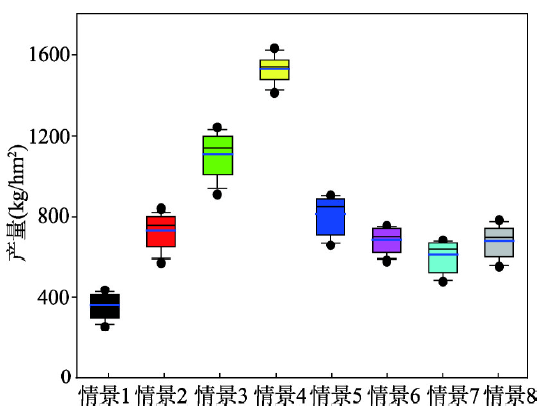
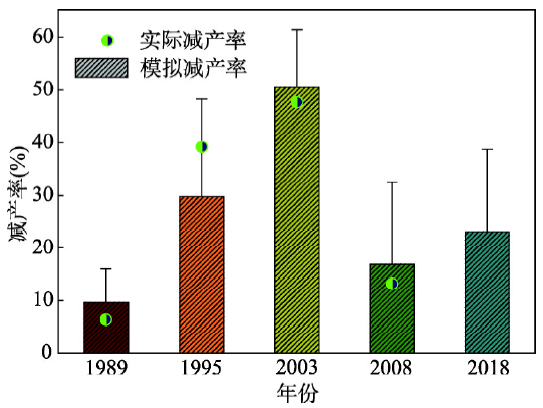
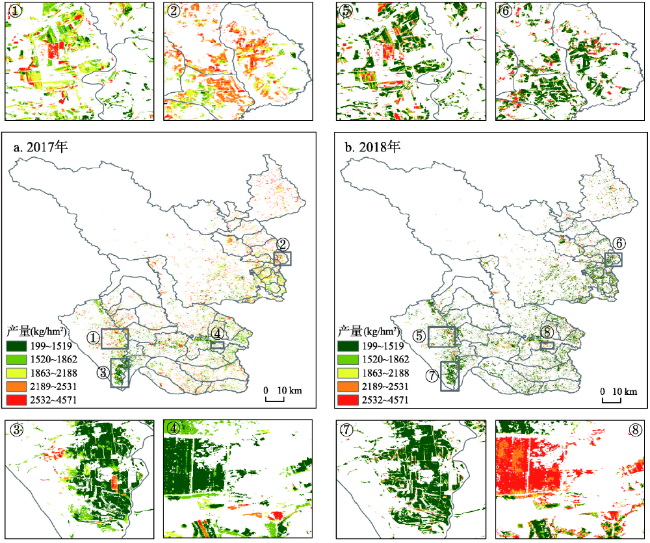
作为中国商品粮的主要生产基地,东北地区频发的低温冷害给中国粮食安全带来了严重的影响,及时、准确和大范围评估低温冷害灾损是降低损失、快速恢复生产的重要前提。本文以鄂伦春为例,提出了一种快速评估低温冷害对大豆生产影响的新方法。首先诊断出该地区典型冷害事件发生的年份为1989年、1995年、2003年、2009年和2018年;然后基于本地化后CROPGRO-Soybean模型设置512组低温冷害和田间管理组合模拟情景;其次构建了1600组包括3个变量(有效积温距平值(CDD)、模拟的叶面积植被指数(LAI)和产量)的冷害脆弱性模型;最后依托Google Earth Engine(GEE)平台逐像元提取大豆关键生育期早晚窗口内最大的宽动态植被指数(WDRVI)及对应的日期(DOY),将WDRVI转化为大豆种植格点的实际LAI,结合构建的冷害脆弱性模型逐像元计算出产量和减产率。主要发现如下:① 校准后的CROPGRO-Soybean模型能较为准确地模拟不同冷害情景下的大豆生长发育过程;② 大豆遭受全生育期的降温情景(1~3 ℃)的减产幅度比局部降温情景(4个生育期随机生成连续5日温度为0 ℃)的减产幅度大;③ 历史冷害年1989年、1995年、2003年、2009年平均减产率约为9.6%、29.8%、50.5%和15.7%,与实际6.4%、39.2%、47.7%和13.2%的减产率相比,冷害灾损评估结果具有较好的精度且误差均在一倍方差以内;④ 运用该方法评估2018年冷害田间尺度的产量损失,并利用Sentinel-2A影像进行10 m高精度制图。结果显示,该方法能够快速、准确地评估不同尺度的低温冷害灾损情况,为作物估产以及农作物灾害损失评估的业务化运行提供了新的思路。
关键词: 低温冷害; Google Earth Engine(GEE); CROPGRO-Soybean; 大豆; 减产率; 有效积温距平值(CDD)
曹娟 , 张朝 , 张亮亮 , 骆玉川 , 李子悦 , 陶福禄 . 基于Google Earth Engine和作物模型快速评估低温冷害对大豆生产的影响[J]. 地理学报, 2020 , 75(9) : 1879 -1892 . DOI: 10.11821/dlxb202009005
The frequent occurrence of chilling injury has serious impacts on national-level food security, and it mainly affects the grain yield in Northeast China. Timely and accurate measures are desirable to assess the large-scale impacts, which are the prerequisites for disaster reduction and production recovery. Therefore, we propose a novel method to efficiently assess the impact of chilling injury on soybean. Inner Mongolia is taken as a case study. The specific chilling injury events was diagnosed to occur in 1989, 1995, 2003, 2009, and 2018. The 512 combinations of cold and field management simulation scenarios were established based on the localized CROPGRO-Soybean model. Furthermore, we constructed 1600 cold vulnerability models including CDD (Cold Growth Days), simulated LAI (Leaf Area Index) and yields from the CROPGRO-Soybean model. Finally, we extracted the maximum wide dynamic vegetation index (WDRVI) and corresponding date of the critical windows of early and late growing seasons in the GEE (Google Earth Engine) platform, converted the WDRVI into actual LAI of soybean pixel, and calculated the pixel yield and losses according to the corresponding vulnerability models. The findings show that the localized CROPGRO-Soybean model can accurately simulate the growth and development processes of soybean under different cold scenarios. The soybean yields were reduced due to changes in cold stress during the whole growth period (a decrease of 1-3 ℃), which were greater than those from the local cooling treatments (the temperature of 0 ℃ for 5 consecutive days which are randomly generated during four growth periods). Moreover, simulated historical yield losses in 1989, 1995, 2003, and 2009 were 9.6%, 29.8%, 50.5%, and 15.7%, respectively, which were very close (all errors were within one standard deviation) to the actual losses (6.4%, 39.2%, 47.7%, and 13.2%, respectively). The above proposed method was applied to evaluate the yield loss of 2018 at a pixel scale. Specifically, sentinel-2A image was used for 10 m high-precision yield mapping, and the estimated losses well characterized the actual yield losses from 2018 cold event. The results highlighted that our proposed method can efficiently and accurately assess the chilling injury impact on soybean at different spatial scales. The novel method is also effective for efficient assessment of the impacts of different disasters on other crops.
表1 鄂伦春6个田块的基本信息Tab. 1 The basic information of six crop fields |
| 基本信息 | 五岔沟 | 兴盛 | 春亭阁 | 春林 | 乃木河 | 小库莫 |
|---|---|---|---|---|---|---|
| 经度(°) | 124.42 | 124.49 | 124.49 | 124.42 | 124.11 | 124.17 |
| 纬度(°) | 50.10 | 49.97 | 49.83 | 49.83 | 49.4 | 49.7 |
| 高程(m) | 486 | 393 | 380 | 365 | 381 | 447 |
| 品种 | 黑河38 | 黑农35 | 合丰50 | 合丰25 | 合丰39 | 黑河18 |
| 熟性 | 中熟 | 中熟 | 中熟 | 中晚熟 | 中熟 | 中熟 |
| 栽培方式 | 平作条播 | 条播 | 条播 | 垄作 | 条播 | 平作条播 |
表2 6个田块的关键生育期、种植密度和产量观测数据Tab. 2 The observation information of key growth period, planting density and yield of crop fields |
| 年份 | 观测数据 | 五岔沟 | 兴盛 | 春亭阁 | 春林 | 乃木河 | 小库莫 |
|---|---|---|---|---|---|---|---|
| 2014 | 播种日期 | 5月16日 | 5月18日 | 5月1日 | 5月18日 | 5月28日 | 5月11日 |
| 开花普遍期 | 7月14日 | 7月12日 | 6月30日 | 7月6日 | 7月18日 | 6月30日 | |
| 开花成熟期 | 9月26日 | 9月28日 | 9月18日 | 9月28日 | 9月28日 | 9月24日 | |
| 种植密度(株/m2) | 39.69 | 30.42 | 47.73 | 36.75 | 37.98 | 38.47 | |
| 产量(kg/hm2) | 1160 | 1350 | 1650 | 1150 | 610 | 1050 | |
| 2015 | 播种日期 | 5月16日 | 5月16日 | 5月28日 | 5月8日 | 5月17日 | 5月18日 |
| 开花普遍期 | 7月16日 | 7月10日 | 7月2日 | 7月12日 | 7月16日 | 7月8日 | |
| 开花成熟期 | 9月16日 | 9月14日 | 9月28日 | 9月28日 | 9月28日 | 9月8日 | |
| 种植密度(株/m2) | 47.94 | 35.6 | 38.18 | 26.24 | 25.84 | 28.58 | |
| 产量(kg/hm2) | 980 | 1100 | 1410 | 1030 | 510 | 860 | |
| 2016 | 播种日期 | 6月6日 | 5月16日 | 5月6日 | 5月22日 | 5月18日 | 5月18日 |
| 开花普遍期 | 7月20日 | 7月14日 | 6月28日 | 7月28日 | 7月2日 | 7月2日 | |
| 开花成熟期 | 9月30日 | 9月26日 | 9月18日 | 9月30日 | 9月18日 | 9月14日 | |
| 种植密度(株/m2) | 32.97 | 30.55 | 40.04 | 42.9 | 40.8 | 35.82 | |
| 产量(kg/hm2) | 1280 | 1450 | 1850 | 1370 | 670 | 1110 | |
| 2017 | 播种日期 | 5月24日 | 5月23日 | 5月21日 | 5月18日 | 5月24日 | 6月2日 |
| 开花普遍期 | 7月8日 | 7月12日 | 7月22日 | 7月8日 | 7月1日 | 7月14日 | |
| 开花成熟期 | 9月28日 | 9月24日 | 9月22日 | 9月18日 | 9月18日 | 9月24日 | |
| 种植密度(株/m2) | 43.5 | 35.76 | 27.56 | 36.9 | 40.6 | 52.36 | |
| 产量(kg/hm2) | 1350 | 1500 | 1240 | 1500 | 750 | 1200 |
表3 CROPGRO-Soybean 模型参数和田块矫正前后的遗传参数Tab. 3 CROPGRO-Soybean model parameters and the genetic coefficients of crop fields |
| 参数 | 定义 | 默认值 | 五岔沟 | 兴盛 | 春亭阁 | 春林 | 乃木河 | 小库莫 |
|---|---|---|---|---|---|---|---|---|
| CSDL | 临界短日长(h) | 12.15 | 14.03 | 12.23 | 13.06 | 14.58 | 11.9 | 14.03 |
| PPSEN | 生长发育光周期响应斜率(/h) | 0.2 | 0.235 | 0.294 | 0.287 | 0.229 | 0.146 | 0.304 |
| EM-FL | 出苗到开花期的时间间隔(d) | 21 | 13.09 | 18.33 | 15.46 | 16.53 | 26.14 | 22.74 |
| FL-SH | 第一次开花到第一次结荚时间间隔(d) | 6 | 6 | 6 | 6 | 6 | 6 | 6 |
| FL-SD | 第一次开花到第一次结实时间间隔(d) | 12 | 19.82 | 21.06 | 18.42 | 18.39 | 11.26 | 12.06 |
| SD-PM | 第一次播种到成熟的时间间隔(d) | 26 | 37.56 | 24.5 | 36.63 | 31.27 | 22.25 | 34.33 |
| FL-LF | 第一次开花到叶片停止生长时间间隔(d) | 20 | 20 | 20 | 20 | 20 | 20 | 20 |
| LFMAX | 最大叶片光合速率(mg CO2/(m2 s)) | 1.03 | 1.023 | 1.052 | 1.034 | 1.011 | 1.196 | 1.257 |
| SLAVR | 在标准生长条件下, 品种比叶面积(cm2/g) | 385 | 311.2 | 303.8 | 301 | 317.6 | 337.9 | 301.1 |
| SIZLF | 整个复叶的最大叶面积(cm2) | 137 | 138.1 | 145.1 | 138 | 141.2 | 188.5 | 217.6 |
| XFRT | 每日生长中分配给种子和外壳最大比例 | 1 | 1 | 1 | 1 | 1 | 1 | 1 |
| WTPSD | 单粒种子的最大重量(g) | 0.155 | 0.162 | 0.157 | 0.161 | 0.181 | 0.195 | 0.186 |
| SFDUR | 所有荚内籽粒灌浆持续天数(d) | 22 | 25.42 | 24.88 | 24.22 | 25.36 | 21.62 | 21.94 |
| SDPDV | 标准生长条件下每荚平均粒数(荚数) | 2.2 | 2.415 | 2.276 | 2.09 | 2.24 | 2.397 | 1.794 |
| PODUR | 最佳生长条件下, 到结痂期持续天数(d) | 13 | 13 | 13 | 13 | 13 | 13 | 13 |
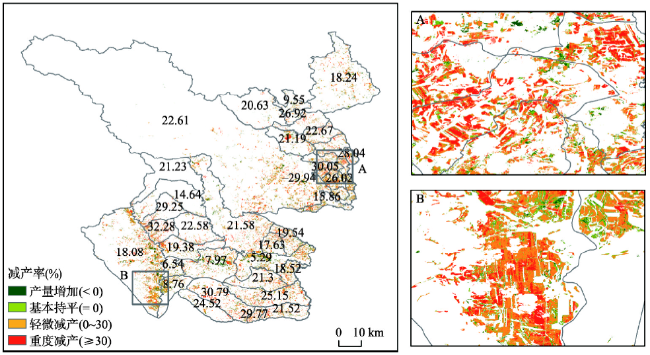
图10 2018年相对2017年的减产率的空间分布注:A和B分别表示2018年鄂伦春局部放大区域的田块减产率。 Fig. 10 The spatial distribution of yield losses in 2018 relative to 2017 |
表4 大豆乡镇减产情况统计Tab. 4 The estimated yield losses of soybean at village level |
| 乡镇名 | 减产率(%) | 乡镇名 | 减产率(%) | 乡镇名 | 减产率(%) |
|---|---|---|---|---|---|
| 卡日楚村 | 21.23 | 卧北村 | 29.77 | 向阳村 | 24.35 |
| 岭南村 | 14.64 | 扎西村 | 19.54 | 乌尔其村 | 31.14 |
| 讷尔克气村 | 22.61 | 五岔沟村 | 15.86 | 朝阳猎民村 | 21.19 |
| 青松沟村 | 24.52 | 乃木河村 | 25.15 | 十六栋房村 | 32.28 |
| 团结村 | 19.38 | 马尾山村 | 18.34 | 诺敏河村 | 6.54 |
| 渔场村 | 8.76 | 库维地村 | 22.58 | 小二红村 | 18.08 |
| 新兴村 | 9.55 | 跃进村 | 28.83 | 龙头村 | 29.25 |
| 欧肯河村 | 18.24 | 奎勒河村 | 5.29 | 新丰村 | 20.63 |
| 兴盛村 | 28.04 | 东升村 | 21.52 | 卧罗河村 | 30.79 |
| 二十里村 | -29.94 | 小库莫村 | 17.63 | 铁东村 | 30.05 |
| 乌鲁布铁猎民村 | 9.53 | 都柿沟村 | 21.30 | 大库莫村 | 21.58 |
| 红旗村 | 22.65 | 朝阳沟村 | 22.67 | 二根河村 | 7.97 |
| 马鞍山村 | 18.52 | 新发村 | 26.92 | 东升村 | 21.52 |
| 春林村 | 26.02 | 春亭阁村 | 16.09 | 毛家铺村 | 18.77 |
| [1] |
|
| [2] |
[ 李文滨, 宋春晓, 苌兴超, 等. 干旱胁迫下20个大豆品种抗旱性评价. 东北农业大学学报, 2019,50(4):1-10.]
|
| [3] |
|
| [4] |
[ 刘丹, 于成龙, 杜春英. 基于遥感的东北地区水稻延迟型冷害动态监测. 农业工程学报, 2016,32(15):157-164.]
|
| [5] |
|
| [6] |
[ 韩荣青, 李维京, 艾婉秀, 等. 中国北方初霜冻日期变化及其对农业的影响. 地理学报, 2010,65(5):525-532.]
|
| [7] |
[ 张建平, 王春乙, 赵艳霞, 等. 基于作物模型的低温冷害对中国东北三省玉米产量影响评估. 生态学报, 2012,32(13):4132-4138.]
|
| [8] |
[ 周立威. 黑龙江省玉米低温冷害时空特征及其对玉米产量的影响[D]. 哈尔滨: 东北农业大学, 2017.]
|
| [9] |
[ 刘晓菲, 张朝, 帅嘉冰, 等. 黑龙江省冷害对水稻产量的影响. 地理学报, 2012,67(9):1223-1232.]
|
| [10] |
|
| [11] |
[ 李秀芬, 马树庆, 赵慧颖, 等. 基于WOFOST模型的内蒙古河套灌区玉米低温冷害评价. 中国农业气象, 2016,37(3):352-360.]
|
| [12] |
[ 陈德. 基于遥感和作物模型的东北水稻低温冷害监测评估[D]. 南京: 南京信息工程学院, 2017.]
|
| [13] |
|
| [14] |
|
| [15] |
[ 陈仲新, 任建强, 唐华俊, 等. 农业遥感研究应用进展与展望. 遥感学报, 2016,20(5):748-767.]
|
| [16] |
|
| [17] |
|
| [18] |
[ 潘铁夫, 方展森, 赵洪凯, 等. 农作物低温冷害及其防御. 北京: 农业出版社, 1983: 20-25.]
|
| [19] |
[ 张胜利. 鄂伦春自治旗低温冷害特点分析. 南方农机, 2017,48(4):181-182.]
|
| [20] |
[ 王信理, 王馥棠, 裘国旺. 系统优化理论在CERES—大豆模式品种参数求解中的应用. 应用气象学报, 1995,6(a01):49-54.]
|
| [21] |
[ 朱大威, 金之庆. 气候及其变率变化对东北地区粮食生产的影响. 作物学报, 2008,34(9):1588-1597.]
|
| [22] |
[ 潘灼坤. 耦合遥感信息与作物生长模型的区域低温影响监测[D]. 杭州: 浙江大学, 2015.]
|
| [23] |
[ 马树庆, 袭祝香, 王琪. 中国东北地区玉米低温冷害风险评估研究. 自然灾害学报, 2003,12(3):137-141.]
|
| [24] |
|
| [25] |
|
| [26] |
[ 桑树鹏. 大豆不同生育期内应对低温冷害措施的研究. 大豆科技, 2013,5(1):53-54.]
|
/
| 〈 |
|
〉 |


