地理空间理论与应用

大数据时代的空间交互分析方法和应用再论

  • 刘瑜 , 1 ,
  • 姚欣 1 ,
  • 龚咏喜 2 ,
  • 康朝贵 3, 4 ,
  • 施迅 5 ,
  • 王法辉 6 ,
  • 王姣娥 7 ,
  • 张毅 1 ,
  • 赵鹏飞 1 ,
  • 朱递 1 ,
  • 朱欣焰 8
展开
  • 1. 北京大学地球与空间科学学院遥感与地理信息系统研究所,北京 100871
  • 2. 哈尔滨工业大学(深圳) 深圳市城市规划与决策仿真重点实验室,深圳 518055
  • 3. 武汉大学遥感信息工程学院,武汉 430079
  • 4. 纽约大学城市科学与进步中心,美国 布鲁克林 11201
  • 5. 达特茅斯学院地理系,美国 汉诺威 03755
  • 6. 路易斯安那州立大学地理与人类学系,美国 巴吞鲁日 70803
  • 7. 中国科学院地理科学与资源研究所,北京 100101
  • 8. 武汉大学测绘遥感信息工程国家重点实验室,武汉 430079

刘瑜(1971-), 男, 山东人, 教授, 中国地理学会会员(S110007302M), 主要研究方向为地理信息科学。E-mail:

收稿日期: 2019-07-23

  要求修回日期: 2020-04-14

  网络出版日期: 2020-09-25

基金资助

国家自然科学基金项目(41830645)

国家自然科学基金项目(41625003)

版权

版权所有,未经授权,不得转载、摘编本刊文章,不得使用本刊的版式设计。

Analytical methods and applications of spatial interactions in the era of big data

  • LIU Yu , 1 ,
  • YAO Xin 1 ,
  • GONG Yongxi 2 ,
  • KANG Chaogui 3, 4 ,
  • SHI Xun 5 ,
  • WANG Fahui 6 ,
  • WANG Jiao'e 7 ,
  • ZHANG Yi 1 ,
  • ZHAO Pengfei 1 ,
  • ZHU Di 1 ,
  • ZHU Xinyan 8
Expand
  • 1. Institute of Remote Sensing and Geographical Information Systems, School of Earth and Space Sciences, Peking University, Beijing 100871, China
  • 2. Shenzhen Key Laboratory of Urban Planning and Decision Making, Harbin Institute of Technology (Shenzhen), Shenzhen 518055, Guangdong, China
  • 3. School of Remote Sensing and Information Engineering, Wuhan University, Wuhan 430079, China
  • 4. Center for Urban Science and Progress, New York University, Brooklyn, NY 11201, USA
  • 5. Department of Geography, Dartmouth College, Hanover, NH 03755, USA
  • 6. Department of Geography and Anthropology, Louisiana State University, Baton Rouge, LA 70803, USA
  • 7. Institute of Geographic Sciences and Natural Resources Research, CAS, Beijing 100101, China
  • 8. State Key Laboratory of Information Engineering in Surveying, Mapping and Remote Sensing, Wuhan University, Wuhan 430079, China

Received date: 2019-07-23

  Request revised date: 2020-04-14

  Online published: 2020-09-25

Supported by

National Natural Science Foundation of China(41830645)

National Natural Science Foundation of China(41625003)

Copyright

Copyright reserved © 2020

摘要

空间交互是理解地表人文过程的重要基础,与空间依赖一起共同体现了地理空间的独特性、关联性以及对嵌入该空间的地理分布格局的影响,具有鲜明的时空属性,因此对于地理学研究具有重要意义。大数据为空间交互研究带来了新的机遇,能够使我们在不同时空尺度感知和观察空间交互模式并对其动态演化特征进行模拟和预测,从而为揭示人类活动规律及区域空间结构提供有力支持。本文在探讨空间交互与地理空间模式关系的基础上,描述了利用地理大数据感知空间交互的方式和定量模型,介绍了空间交互分析方法的研究进展及其在空间规划与交通、公共卫生、旅游等领域的应用情况,并就一些基本问题进行了讨论,以期为大数据支持下空间交互相关研究提供指导。
本文引用格式

刘瑜 , 姚欣 , 龚咏喜 , 康朝贵 , 施迅 , 王法辉 , 王姣娥 , 张毅 , 赵鹏飞 , 朱递 , 朱欣焰 . 大数据时代的空间交互分析方法和应用再论[J]. 地理学报, 2020 , 75(7) : 1523 -1538 . DOI: 10.11821/dlxb202007014

Abstract

Spatial interaction is a critical basis of understanding human processes on the land surface. Together with spatial dependence, it embodies the uniqueness and relatedness of geographical space, as well as the impact on the embedded geographical distribution patterns. Spatial interaction also has distinctive space-time attributes, and thus it is significant to geographical research. Big data bring new opportunities for the studies of spatial interaction, which enables us to sense and observe spatial interaction patterns at different spatial scales, and simulate and predict their dynamic evolution. This provides great support for the research of human activity regularities and regional spatial structures. In this article, we first demonstrated the relationship between spatial interaction and geospatial patterns, and introduced how to sense spatial interaction with big geodata. Then, we generalized the progress of relevant models and analytical methods, and introduced the corresponding applications in fields of spatial planning, urban transportation, public health and tourism. Some key issues were also discussed. We hope this review can provide guidance for the studies of spatial interaction supported by big data.

1 空间交互

地理空间中不同位置的事物间存在不同强度的联系,并以物质、能量、信息等不同的形式进行移动和交换,这个过程被称为空间交互(① 在人文地理学研究中,也被称为空间相互作用。)(Spatial Interaction)[1,2,3,4]。空间交互重点关注地理现象发生的起点(Origin)和终点(Destination)位置及其相互关系,因此在地理信息系统中通过OD数据或者流(Flow)数据表达。地理学有着悠久的空间交互研究传统,Ullman用“Geography as Spatial Interaction”的说法强调空间交互对于地理研究的重要意义,并归纳了影响空间交互产生的3个因素:互补性(Complementary)、介入机会(Intervening Opportunities)和可运输性(Transferability),作为构建模型所要考虑的基本要素[1]。Haggett借鉴物理学热传递的3种方式,把交互形式分为对流、传导和辐射3种类型[5];而对空间交互的定量研究[6,7,8],则更早于这些概念和理论的提出。考虑到大多数空间交互通过流的形式体现,因此本文行文中将“空间交互”和“流”交替使用。
就空间数据结构而言,大多数传统空间数据可看作为“一阶量”,即抽象为映射 f: PV,其中定义域P为地理单元集合,值域V为属性值(或向量)的集合,相应数据结构可组织为<x, s>,x表示地理单元的位置,s表示属性值。数据的空间复杂度是O(n),其中n为地理单元的数量,采用简单的关系数据表即可实现管理。然而空间交互数据是一类“二阶量”,可以抽象为映射f: P×PV,具有3种表达方式。最常用的一种形式为<x1, x2, s>,其中x1x2表示交互起点和终点位置,s表示交互强度,这种形式反映了空间交互作为OD数据的特点,能够最直接、精确地表达交互的空间分布[9,10]。第二种形式为<x, θ, d, s>,其中x为端点(起点或终点)的位置,θ表示交互的方向,d为交互的距离,s表示交互强度,反映了空间交互作为流数据的特点[11,12,13]。此外,Goodchild等提出的Geo-dipoles是对“二阶量”数据结构的泛化,其形式为<x1, x2, Z, z(x1, x2)>,其中Z可以是空间交互的属性如强度和时间间隔,z(x1, x2)表示对应的属性值[14]。显然,空间交互的空间复杂度为O(n2),即n个地理单元需要n×n的矩阵来存储交互数据,这一方面提升了数据管理的难度,另一方面也意味着较高空间分辨率的交互数据获取成本较高。因此,尽管地理学者早就认识到了空间交互的意义,然而在数据和方法上仍对其缺乏有效的支持,目前主流地理信息系统软件很少提供空间交互分析功能。
地理大数据为量化空间交互提供了全新的感知手段[15],由于其独特的个体粒度、高时空分辨率等优势,能更好支持不同空间尺度的交互模式发现及其动态演化特征模拟和预测,服务于交通、公共卫生、旅游等领域,为空间交互研究带来了新机遇。本文试图梳理空间交互理论方法和应用研究,以期为大数据支持下的相关工作提供指导。

2 空间交互与地理空间格局

Hettner[16]认为地理学的主题是认识地理区域之间的相互差异及其空间上的关联[16],这其中暗含了空间交互与地理空间格局的耦合关系。与空间交互这种客观存在的“观测二阶量(Observed 2nd-order measures)”相比,距离、相似度等度量可以看作是不同类型的“可导出二阶量(Derivable 2nd-order measures)”,例如,空间自相关系数、地统计半变异函数等均是对一阶属性之间的依赖关系的一种二阶表达[17,18]。二阶效应是地理空间格局研究的关键,对应于地理现象的复杂内在特性,包括与位置相关的属性依赖、位置的局部结构化作用和空间异质性等空间作用[19],而不同类型的空间二阶量相互作用有助于理解地理空间。具体而言,以下4种空间效应与空间交互模式密切相关。
(1)距离衰减(Distance Decay)。一般而言,两个区域空间距离越近,依赖关系越强,发生交互的可能性越高[20]。这种效应的出现有两个原因:一是交互成本与距离呈正相关,由于成本约束,长距离交互强度被削弱;另一个是介入机会,即对于长距离交互目的地,存在较多的潜在目的地可作为替代,降低其被选择的可能性。
(2)空间依赖(Spatial Dependence)和社区结构(Community Structure)。从空间一阶量的角度,地理格局表现为不同属性的空间分异,这正是空间交互形成的根本原因,地理单元间的位置关系及其属性的空间依赖共同决定了可观察到的空间交互模式[21,22]。由于空间交互刻画了地理单元之间的联系程度,联系相对紧密的单元形成社区,社区之间的联系则相对稀疏,从而形成具有特定结构和功能的组团格局[23,24]
(3)尺度效应(Scale Effect)。在地理分析中,尺度是一个重要的影响因素。空间交互强度的度量需要基于面状单元进行聚合,其中的尺度问题尤其需要关注。一般来说,基本空间单元越大,聚合程度越高,反映的信息量越少;而若空间单元过小,则会遇到数据稀疏问题,难以发现有意义的模式[25]
(4)地理空间复杂性(Geospatial Complexity)。一方面,空间交互是造成标度律(Scaling Law)的重要原因,Bettencourt指出城市内基础设施网络的发展使得人群之间更容易产生交互机会,而城市社会经济规模与这种交互机会数量是成比例的,这使得城市效益和人口规模之间存在着超线性关系[26]。另一方面,将地理单元和空间交互分别表达为节点和边,可形成具有复杂性(如无尺度和小世界特征)的网络,因此可以通过网络分析方法发现不同尺度的空间模式,进而揭示其背后的地理格局。

3 基于地理大数据感知空间交互

随着ICT技术的快速发展,个体在任意时间和地点的活动信息都能被记录并通过移动设备进行上传,从而产生大量具有时空标记的地理大数据。这为量化不同尺度的空间交互提供了可能,一方面解决了传统空间交互研究中数据不足的问题,为从宏观到微观、从群体到个体研究空间交互开创了新途径;另一方面使得基于大数据构建的空间交互网络具有动态性、多语义、细粒度等优势,可以帮助理解空间交互模式提取中的尺度影响。依据获取方式的差异,下面主要介绍4类可用于感知空间交互的地理大数据。
(1)交通出行数据,主要包括出租车、网约车、公交、地铁、共享单车等[27,28,29,30,31,32,33]。得益于智能交通以及物联网的快速建设,各种车载定位设备、手机导航应用以及公交刷卡系统积累了海量的个体出行数据,如导航数据、打车订单数据和进出站/上下车刷卡数据,通常记录了上下车的位置或站点,可以建立其对应的出发地和目的地间的交互。这类数据通常是基于街道单元的,因此具有一定局限性。同时由于没有一种交通出行方式占绝对主导地位,单一类型的出行很难反映全局的空间交互模式。在城际尺度,航班、列车时刻表、货车轨迹等数据也为度量空间交互强度提供了支持手段。
(2)手机数据,包括被动式的信令数据和主动式的通信数据[34,35,36,37]。这两种数据均基于手机与基站的信号联系确定用户位置,前者根据用户在不同区域提供服务的基站不同,按一定时间间隔采样获取活动轨迹点,然后从轨迹中提取出停留点并匹配空间单元,两个连续停留点可作为交互的起止区域,体现了用户在区域间的流动;后者通常是基于通话发起者和接收者所处位置确定空间交互的起止区域,反映区域间的信息流动。由于手机普及率高,因此数据覆盖范围广,而且对于信令数据来说基站每时每刻都可以收集数据,时效性强;不足之处在于基站定位不够精确,如何有效地识别停留点也是一个问题。
(3)社交媒体数据[24, 38-40],人们利用社交媒体软件在不同位置上传具有时空标记的照片或文本进行签到的数据,为重现空间移动路径提供了可能。基于社交媒体数据,有以下4种方式度量空间交互强度:① 根据签到位置序列点,任意两个连续签到点反映了用户在区域间的移动,从而构建区域交互;② 用户在注册社交媒体软件时需要填入所在地,当其在不同地区进行签到时,便产生了从注册地到签到地的交互;③ 通过手机App请求定位权限获取用户的移动轨迹,进而提取用户位置变化数据,这种方式和手机信令数据类似,也是通过提取停留点实现的;④ 通过网络舆情在不同区域的传播构建信息流,即事件在某区域发生后,其他地区的网络用户评论、转发与该事件相关的信息,通过信息在不同区域的传播构建空间交互。社交媒体数据优势在于数据公开,容易获取,并且文本和图片丰富了语义信息,但显然其用户覆盖是有限的,并且用户对签到地的选择是有偏的,无法全面反映空间交互模式[41]
(4)地名共现也可用于度量空间交互强度[42,43,44,45,46],即两个地名在网页(如新闻文章)中同时出现体现了它们之间的联系。例如“北京选派优秀教师赴内蒙古支教”反映了北京到内蒙古的人口流动,可以通过地理信息检索和文本处理技术获取不同地名的频数来表征地理单元交互联系的强度。

4 空间交互模型研究

空间交互模型试图为预测地理单元间交互强度构建数学表达,其中地理单元的属性以及地理单元间的距离是揭示空间交互强度的重要变量。

4.1 基础空间交互模型

空间交互建模主要研究给定两个空间分析单元之间产生某种联系的形式化表达,建立交互强度Tij与起点Oi、终点Dj、交互成本cij三个基本要素之间的函数关系:
T ij = f ( O i , D j , c ij )
常用的空间交互模型包括:重力模型(Gravity Model)[6]、介入机会模型(Intervening Opportunities Model)[8]、最大熵模型(Maximum Entropy Model)[47]和辐射模型(Radiation Model)[48]。它们虽然函数形式各不同相同,但是都具有一定的理论基础,在研究和实践中被广泛应用。
重力模型的思想来源于牛顿力学,其基本假设是“交互强度与起始点的规模成正比,与距离成反比”。因此,其函数形式可表示为:
$T_{ij}=k\times P_{i}^{\gamma}\times P_{j}^{\delta}\times f(c_{ij})$
式中:PiPj为起点和终点的规模,通常可以用人口、经济规模表达;γδ为规模参数;cij表示在ij之间移动产生的成本,通常可以用距离代替;f (cij)为衰减函数。此外,不少学者将人工神经网络方法与重力模型结合对空间交互强度进行估计,取得了更好的估计效果[49,50,51]。Wilson采用熵最大化方法[47],得到空间交互模型的解析函数形式为:
T ij = A i × O i × B j × D j × exp ( - μ c ij )
式中:OiDjij的输出和输入量;AiBj为归一化因子;μ为衰减系数。介入机会模型不直接考虑起始点间的交互成本,而是假设“交互强度与目的地可提供的机会数成正比,与起始点之间的介入机会数成反比”。因此,其函数形式可表示为:
T ij = A i × O i × f ( D j , V ij )
式中:Vij为起始点(不包括OiDj)之间的介入机会数。辐射模型的思想来源于粒子的物理运动,其基本假设是“给定源点需求,交互将指向供给大于该需求的目的地,且源点与该目的地之间具有最小的交互成本”,本质上与介入机会机制一致。
在大数据支持下,研究者针对不同类型的空间交互检验了重力模型、介入机会模型和辐射模型及其变种的适用性。其中一个研究重点是通过选取合理的规模和成本因素,比较不同模型的准确度[52]。大量实证结果表明空间交互模型的效果显著依赖分析的空间尺度[53]。在较大空间尺度下,一般认为辐射模型表现最优;而在小空间尺度下,介入机会模型表现较好。此外,由于辐射模型具有无参数特性,其通用性低于重力模型和介入机会模型,通常无法在不同的空间交互系统中取得较好的建模效果。因此,借鉴重力模型和介入机会模型的思想,引入规模效应、起始点限制和“竞争—介入”等机制,产生了不同的参数化辐射模型[54]。在实证研究过程中,通常需要通过拟合和评估不同的模型参数来选取最合适的空间交互模型。

4.2 基于空间交互模型的个体移动性建模

当空间交互采用人在地理空间中的移动度量时,可以基于微观层面的个体移动模型解释宏观的空间交互模式,例如用起止点之间的出行概率刻画两个地理单元之间的联系,进而结合经典的个体移动性模型模拟个体在空间中的移动过程[55]。因此,可以认为空间交互模型和个体移动性模型是“一枚硬币的两个面”,它们分别在宏观和微观层面刻画地理单元的联系特征[24]
从大数据中提取的海量个体移动轨迹,为验证个体移动性模型提供了数据支持。主流个体移动性模型包括随机游走模型、列维飞行模型[56]、偏好返回模型[57,58]和近因模型[59]。这些模型一般都依赖于移动步长分布、新颖探索、偏好依附和记忆效应等条件[60,61],模拟个体在均质空间环境下的移动轨迹。因缺乏对地理环境因素的考量,这些基础模型对非均质空间的个体移动性建模效果不佳。通过加入出行目的地选取机制,可以将空间异质性引入个体移动性模型之中,结合空间交互机制设定不同的距离衰减函数,选取合适的出行概率进行地点探索和往返移动,在地理空间中获得更好的个体移动建模效果[11]

5 空间交互分析方法研究

5.1 空间交互聚类

空间交互本身数据结构的复杂性使得直接观察其分布特征较为困难,而聚类是对数据分布模式的一种概括,特别是对于空间交互大数据而言,有助于发现较强的区域联系和主要移动趋势。目前挖掘空间交互聚集模式主要有3类方法:① 通过定义统计指标判断空间交互分布是否呈现全局或者局部的聚集,属于空间统计方法,需要通过假设检验确定其统计显著性。例如,Berglund等将局部Getis-Ord Gi*统计量直接应用到流数据发现其聚集的热点区域[62];Lu等探讨了流数据OD点的聚类显著性水平和流聚集模式的关联性[63];Liu等扩展点的空间自相关指数到矢量数据,自相关指数高的地方,流数据更倾向于集聚[64];Tao等则是扩展局部K函数进行流聚集检测[65]。② 通过定义流的相似度(或相异度)并采用经典聚类框架发现流聚簇。通常OD点越接近的空间交互越相似,因此可利用OD点的欧氏距离[9, 65-66]或拓扑距离[10]来度量流的距离,此外也可根据流本身的空间关系进行定义[67]。③ 基于动态优化策略。Gao等将流作为四维空间中的点,利用空间扫描统计方法发现动态扫描窗口中的流数据是否存在显著聚集性,同样需要进行假设检验[68];Song等[69]以及Tao等[70]都基于区域相邻关系定义流的邻接性,并分别使用蚁群算法和扩展AMOEBA算法[71]识别OD均为不规则区域的流聚类。

5.2 空间交互可视化

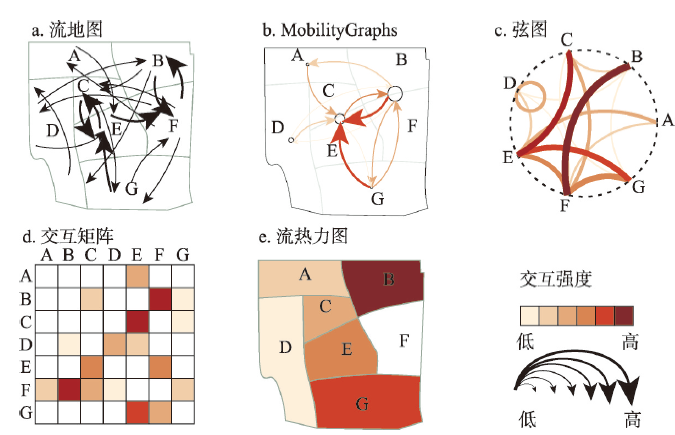
可视化以地图、图表等形式呈现空间交互数据,提供了重要的分析视角。对于具有高时空连续性的空间交互大数据而言,传统的可视化方法难以直接应用,因此相关优化方法和一些新的方法相继被提出。这些方法能够提取和表达空间交互数据的时空分布特征,同时空间交互大数据也能够支持在不同尺度和粒度下进行可视化以观察对应的分布模式。目前可视化方法主要有:① 基于流的方法。流地图[72]用一条有向线段表示空间交互,线段的属性如颜色、粗细表示交互强度[72]图1a)。这种方法能够直观的显示空间交互的分布,然而当数据量较大时,线段的交叉重叠使模式发现较为困难,而一些优化方法可以缓解这一问题,包括流抽样[10]、流分解[72,73]、地理单元合并[74,75]、空间布局优化[76,77,78,79]、符号设计优化[80,81]等。② 基于图的方法。MobilityGraphs[82]图1b)和弦图[83]图1c)分别为空间化和非空间化的方法,能够表现空间交互的网络结构特征,但也存在边交叉问题。③ 基于矩阵的方法。交互矩阵[84,85]将空间单元进行编码,用矩阵的第i行第j列的元素表示从区域i到区域j的交互强度,并可借助矩阵重排等技术突出交互模式(图1d)。Maptrix[86]则是将地图与交互矩阵结合,以解决交互矩阵无法反映空间位置的问题。基于矩阵的方法不会出现因边交叉产生的杂乱问题,然而当空间单元增多时,矩阵会变得庞大稀疏。④ 基于热力图的方法。流热力图[87]根据选定区域与其他区域的交互量对面状区域单元着色,如图1e所示。这种方法十分直观,然而一张图只能反映一个单元的交互分布。OD Map[88]可以认为是所有区域流热力图的组合,但是全局模式难以识别。⑤ 基于分区统计图的方法。Andrienko等[13]和Yao等[89]使用不同的数据聚合方式,设计了不同形式的统计图以展现区域在不同方向上的空间交互分布特征,能够发现区域空间交互模式差异。
图1 5种空间交互可视化方法

注:b图中C和E、B和F间具有强交互关系而进行了合并;e图表示F与其他区域的交互。

Fig. 1 Five visualization methods for spatial interactions

5.3 空间交互距离衰减效应量化

距离衰减是指空间交互的强度通常随着距离的递增而减弱[20, 90],该效应能够揭示空间交互作用机制。大数据样本量大的优势,有助于量化距离对不同尺度下、不同类型的空间交互强度的影响。已有研究表明,距离对城市间空间交互的影响比城市内的略小[11, 24, 35, 55, 91-92],对信息流等非空间移动形式表现的空间交互影响更不明显[42, 93]。在实际应用中,常通过模型拟合计算距离衰减系数来量化这种效应,主要包括以下两类方法。
第一类是解析法。如果已知空间单元的吸引力,一种直接的方法是将重力模型等式进行对数变换后,将不同区域间的空间交互强度和距离代入得到散点图,通过线性拟合计算斜率作为距离衰减系数。线性法基于对数变换后的重力模型等式构建线性方程组,从而将问题转化为线性系统求解问题。在此基础上,线性规划[94]和线性回归[95]分别引入误差项和虚变量来进行优化求解;代数法则推导空间单元吸引力的解析解,通过与真实值进行比较确定最优距离衰减系数[91]
第二类是模拟法。基于粒子群优化的逆重力模型拟合将空间单元的吸引力作为粒子,通过迭代优化,估计每个单元的吸引力以及最佳的距离衰减系数[92]。蒙特卡罗方法通过设置不同的距离衰减系数,基于重力模型计算区域间发生一次交互的概率,然后随机模拟生成大量交互,与真实交互模式进行对比,如果匹配程度高,说明该衰减系数设置较为合理,可以通过模拟个体行为来发现群体空间交互模式[11]

5.4 基于空间交互的空间划分

空间划分是指将地理单元划分成特定的互不重叠的组团区域,同一区域内的地理单元具有位置和功能上的相似性或者互补性。Noronha等指出空间交互与功能区划分具有密切联系[96]。地理大数据的出现弥补了空间交互数据不足的问题,可以构建不同尺度下不同空间单元间的交互联系,从而提取不同层次下的空间划分结果,为全面研究区域空间结构提供了有力支撑。目前基于空间交互的空间划分研究主要聚焦于两个视角。
一是聚合视角。首先确定基本空间单元,然后将这些单元不断合并,直到获得满足某种规则的分区。聚合规则的选取决定了空间划分的结果,主要包括:① 基于交互矩阵度量区域联系程度的聚类[97,98],这类方法或强调区域间交互的重要性,或侧重区域连通性和可达性;② 优化方法,例如,基于信息熵的方法认为一个理想的分区系统应当最大化区域间的熵,也即区域内的熵最小[99]。基于空间交互模型的方法则是以最小化分区后区域间交互量的模型估计值与真实值的偏差为目标[100]。此外,Kim等将空间分区转化成p功能区空间优化模型,使得每个功能区内空间单元到中心单元的交互量最大[101]
二是空间交互网络视角。地理单元间的交互构成了嵌入空间的网络,可用社区发现算法[102]进行空间划分,揭示联系相对紧密的区域。在应用层面,很多研究基于不同类型地理大数据,揭示区域空间结构与层次关系,观察不同社区的空间交互特征,探究社区边界与区域边界的关系[23-24, 34, 103-104]。随着模块度方法的广泛使用,有不少学者引入空间约束进行计算,以更好地发现空间组团结构[105,106]。此外,近年来利用矩阵分解技术进行地理社区发现也逐渐得到重视[32]

5.5 其他分析方法

除了上述较为成体系的4类空间交互分析方法,还存在一些其他相关重要研究。在数据特征刻画方面,相关研究包括空间交互统计特征分析,如方向、距离、强度分布[12],以及网络特征分析,如度分布、集聚系数、中心性[107,108];在区域空间交互估计方面,Jang等根据面积比例关系、用地功能/土地覆盖类型、重力模型等对不同分区方式下的区域间流数据进行推算[109];Zhu等提出在一定约束条件下从连续空间分布快照推算区域间净流量的线性规划方法,探究了空间交互与空间分布的关系[110];在用地功能分类方面,考虑到空间单元属性与其空间交互模式紧密相关,Liu等在定义交互特征向量的基础上,使用期望最大化算法对城市用地类型进行推断,并在上海市出租车数据的应用中取得了较好的结果[31]

6 空间交互应用研究

6.1 空间规划与交通领域

各个尺度的空间规划和交通是空间交互的重要应用领域。海量人流、车流、物流、信息流等动态空间信息构建了地理空间单元之间的联系,使得城市、区域以及国家尺度的空间结构探知成为可能。在城市尺度,居民在城市中的时空行为体现了城市内部空间单元之间的交互,从而从动态角度弥补了传统城市空间结构研究中无法体现空间联系的不足。利用智能刷卡、出租车GPS轨迹等数据能够识别城市多中心结构,有效揭示城市整体与局部的空间结构演变规律[27, 111-113],分析城市职住空间分布格局[33, 114-115]。而在区域及更大尺度上,非交通数据如手机信令数据、社交媒体数据、互联网数据等应用较为广泛,如利用手机信令、豆瓣数据构建空间交互网络,剖析京津冀地区、长三角、珠三角等城市群组成结构及其形成机制[116]。在国家乃至全球尺度上,使用微博、微信、百度人口迁徙、Twitter等社交媒体数据构建复杂网络,进行区域划分,探究不同城市间的联系强度的差异[23-24, 117-119]。空间交互网络分析也成为识别和评价城市用地的新方法,如使用公交刷卡数据构建城市内部交互网络,区分城市用地类型和城市功能的动态使用情况[120],借助手机信令数据实现基于居民活动的城市各功能的空间划分[121,122]
基于地理大数据构建的空间交互网络,为交通研究提供了动态的、精细的空间组织依据,使得更深层次研究交通问题成为可能。在交通网络方面,运用大尺度的交通流数据,如航班时刻、铁路运营时刻表、航运物流等,重点分析全球或区域交互网络的复杂性、层级结构及组织模式[123,124,125,126]。在交通管理方面,可以集成多源大数据用于城市交通系统监测。基于车辆轨迹、地磁传感器数据、导航数据等,分析实时交通路况特征,预测其演化模式,进而诱导交通流量分流,缓解交通拥堵[127];另一方面,通过挖掘交通事故与交通流、环境因素的时空关联,实现对异常事件的感知、预测和处置,为交通事故的防控、应急和交通基础设施的优化提供方法与指导[128,129]

6.2 公共卫生领域

6.2.1 空间交互与疾病传播 在各种疾病中,传染病与空间交互的关系最为明显。传染病的疫情过程表现为时空上的移动与扩散,而整个疫情的时空特点和个体之间传播的风险,均在很大程度上决定于病原体、宿主、被感染者的流动。传染病具有速度快、范围大、渠道多、突发性强、空间跳跃性强和随机性强等特点[130],从空间交互的角度对传染病的时空研究聚焦于其在不同地区(人群)之间或者不同地点(个体)之间的传播。为了有效控制疫情,模拟疫情在区域之间的传播尤为关键。例如,Wallace等提出了Patch-SIR模型将单个区域内部的传染过程推广到多区域尺度以揭示疫情传播与人口流动模式之间的关系,他们使用航班信息来估计区域间的人口迁移率,将模型应用于2009年春美国6个区域的甲型H1N1流感的爆发,并分析了模型参数的敏感性,对疫情预测具有重要参考价值[131]。在个体水平上,基于已有研究[132,133],Li等提出了疫情树林的概念框架模型,用来整合不同尺度不同来源的数据,对传染病疫情的时空动态进行刻画和分析,其关键在于对个体水平的传染关系进行准确判断,即判断究竟是哪个病例传染给了哪个病例[134]。针对2019年底在中国爆发的新型冠状病毒肺炎疫情,一些研究基于航空客流、百度和腾讯迁徙等数据估计了疾病传播的高风险区域[135],模拟了主要城市的传染病流行情况[136]。基于空间交互对传染病进行时空建模,掌握其时空传播规律,有助于进行疫情预测和制定相关防控政策。
6.2.2 医疗设施布局分析 医疗资源空间布局的差异性是造成不同地区人们健康水平有别的重要原因之一。基于就医可达性评估,可以研究可达性的好坏是否会影响患者的健康水平,如晚期癌症的风险[137]或近期新型冠状病毒肺炎诊治的效果。另外对就医可达性科学精确地度量,还可以帮助缺医区的划分,对指导政府制定相关的补救措施、合理调配医疗资源具有重要的现实意义。如果评估发现了医疗资源配置的不合理、不均衡,则可以进一步研究如何采用各种优化手段,科学地调整和规划医疗设施的布局,提高医疗资源的使用效率,提倡医疗资源最大程度的均等共享[138]
常见的空间交互在公共卫生资源管理中应用,还有医院服务区的界定。医院服务区是功能区的概念,比常用的行政单元更科学地刻画了医疗市场的有机联系。Jia等[139,140]以美国佛罗里达州2011年每个医院到每个邮码区的出院记录数量,测试并选取了拟合程度最高的距离衰减函数来取代传统Huff模型[141]中的幂函数,用改进的Huff模型来划分医院服务区。还有研究采用了社区发现算法划分医院服务区[142],划分的结果一方面可以用来作为评估医院服务质量及效率的研究单元,另一方面还可以为政府相关的医疗政策提供管理区参考。

6.3 旅游领域

大数据时代的到来使得获取海量精细尺度的、长时间跨度的游客行为数据成为可能,手机定位数据、旅行商数据、旅游网站评论数据、社交媒体、旅行博客数据丰富了研究的数据源[141]。目前,基于大数据的旅游流研究重点可概括为以下3点:① 通过不同类型地理大数据等提取旅游流,对其空间网络结构、分布模式、时空演化等特征进行分析。例如,Shao等利用从微博数据中提取的黄山市游客时空活动数据构建空间交互网络,进而通过社区发现算法对城市旅游区进行划分[144]。② 对旅游流进行估计和预测,包括空间交互模型[145]、统计回归[146]、深度学习[147]等方法。③ 研究旅游流与社会经济发展的相互影响。例如,Marrocu等分析了欧洲多个地区的旅游流对区域企业生产效率的影响,目的地企业可以利用作为外部消费者的游客偏好信息来提高经济效率[148];Yang等根据微博提取的中国343个城市间旅游流数据,建立重力模型分析航空和铁路交通对旅游流的影响[149]

7 讨论

大数据为空间交互研究带来了全新的机遇,相较于传统数据主要有以下3个方面的优势:① 数据量大,每条记录粒度小,可以提取不同空间尺度聚合所体现的空间模式,研究所提取模式和尺度之间的关系,有助于处理可变面积单元问题,也有助于选择合适的聚合尺度[150];② 多样化,人类活动目的的差异性是产生不同类型交互的直接原因,而空间单元作为人类活动的载体,其功能分异是形成不同类型交互的根本原因,类型丰富的空间交互大数据有助于构建多重交互网络,研究不同类型交互之间的相互影响[151]。③ 在时间上具有连续性,有助于研究空间交互网络的演化规律,并在此基础上进行交互动态乃至区域结构演化的预测。
基于地理大数据开展空间交互研究时,也要注意其局限性:① 对数据进行时空切片后非常稀疏,这是其作为“二阶量”的特点导致的。例如,对于北京市五环内某一天的1亿条出行OD数据,将区域划分成30行×30列的网格,平均来说每一对网格单元间的有向交互量约为100000000/(900×899)≈123条。若进一步按小时划分,则每小时平均交互量仅为123/24≈5条。考虑到时空异质性导致数据分布不均匀,有相当多网格单元间的交互量很少甚至没有,为时空模式分析带来了困难。② 数据属性缺乏,除了起止坐标和时间属性,空间交互大数据其他属性信息的缺乏一定程度上限制了其在时空数据挖掘中的应用。③ 数据是有偏的。大数据并非“全数据”,只能片面地刻画空间交互特征。例如对于城市内出行,仅使用出租车、地铁等一种或两种数据就能“反映城市居民的空间移动模式”恐有以偏概全之嫌。有效解决以上问题的途径是集成多种空间交互网络展开研究,避免单一交互网络的代表性问题;或者将大数据进行分组(例如按照人群年龄、性别划分不同的出行数据),与普查、问卷访谈等小数据进行集成以丰富数据属性信息。
对于地理信息系统研究而言,目前相关软件针对一阶量的空间分析方法趋于完善,如聚类分析、插值分析、自相关分析、回归分析等,而对于空间交互这类二阶量的分析方法寥寥可数,这一方面在于二阶量数据结构的复杂性,导致分析建模较为困难;另一方面在于二阶量涉及两个空间对象,分布模式难以直接在地图上进行可视化和观察。在大数据时代,亟需实现分析方法“从一到二”的跨越,其中主要包含3个方向:① 将基于一阶量的分析方法拓展到二阶量,例如基于流数据的Geris-Ord Gi*统计量[62]、K函数[65]、自相关指数[64]等,这些方法的关键在于定义二阶量之间的空间关系。② 根据二阶量结构特点发展新的分析工具,揭示多重二阶量之间存在的相互影响关系及其时空效应。③ 引入其他领域的分析方法,如矩阵分析[32]、复杂网络方法[106]等,用于提取空间交互所反映的格局和过程。近年来,随着深度学习的发展,图卷积神经网络成为有效表征空间单元交互模式及其影响的工具[152],这有助于集成一阶量和二阶量,刻画地理空间分异格局。

8 总结

本文首先介绍了空间交互的内涵,从距离衰减、空间依赖和社区结构、尺度效应、地理空间复杂性4个方面揭示了空间交互与地理空间格局的关系,随后描述了利用多种地理大数据感知空间交互的方式,并且总结了常用的空间交互分析方法,介绍了其在不同领域的应用情况。总而言之,大数据支持下的空间交互研究具有以下几个特点:① 多尺度。由于数据在空间上具有连续性并且能够被聚合,可以在局部和宏观等不同空间尺度观察交互模式;② 动态性。空间交互的时态变化规律可被用来更准确的刻画人和地的特征,也为空间交互网络的演化和强度预测研究提供可能;③ 多领域应用。空间交互由于其类型多样,在多个领域中应用广泛,如空间规划、交通管理、疾病传播建模、旅游空间结构发现、基础设施评价等等。
空间交互长期以来就是地理分析的核心概念,传统的空间交互研究由于缺少数据的支持,对于空间交互数据分布特征、演化过程研究不足,相关应用受到一定局限。由于位置感知技术的发展,海量具有时空标记的地理大数据的涌现,为感知空间交互提供了全新的手段,这种数据独有的微观个体粒度行为模式的刻画能力,为量化空间交互分布模式及动态演化,并揭示其与地理环境之间的相互作用,深入理解复杂地理格局和过程提供了可能性。因此需要根植于地理学的空间交互研究传统,抓住大数据带来的新机遇,引入机器学习、复杂性科学等领域的方法,开展更加全面的多源地理大数据支持下的空间交互新理论、新方法和应用研究。

感谢东北大学修春亮教授在本文定稿过程中的讨论和有益的建议。

[1]
Ullman E L. Geography as spatial interaction. Annals of Association of the American Geographers, 1954,44:283-284.

[2]
Tobler W R. Spatial interaction patterns. Journal of Environmental Systems, 1976,6(4):271-301.

[3]
Fotheringham A S, O'Kelly M E. Spatial Interaction Models: Formulations and Applications. Boston, MA: Kluwer, 1989.

[4]
Roy J R, Thill J C. Spatial interaction modelling//Florax R J G M, Plane D A. Fifty Years of Regional Science. Heidelberg: Springer, 2004: 339-361.

[5]
Haggett P, Cliff A D, Frey A. Locational Analysis in Human Geography. London: Edward Arnold, 1977.

[6]
Ravenstein E G. The laws of migration. Journal of the Royal Statistical Society, 1885,48(2):167-227.

[7]
Reilly W J. The Law of Retail Gravitation. New York: Knickerbocker Press, 1931.

[8]
Stouffer S A. Intervening opportunities: A theory relating to mobility and distance. American Sociological Review, 1940,5(6):845-867.

[9]
Kordi M, Fotheringham A S. Spatially weighted interaction models (SWIM). Annals of the American Association of Geographers, 2016,106(5):990-1012.

[10]
Zhu X, Guo D. Mapping large spatial flow data with hierarchical clustering. Transactions in GIS, 2014,18(3):421-435.

[11]
Liu Y, Kang C, Gao S, et al. Understanding intra-urban trip patterns from taxi trajectory data. Journal of Geographical Systems, 2012,14(4):463-483.

[12]
Murray A T, Liu Y, Rey S J, et al. Exploring movement object patterns. The Annals of Regional Science, 2012,49(2):471-484.

[13]
Andrienko G, Andrienko N, Fuchs G, et al. Revealing patterns and trends of mass mobility through spatial and temporal abstraction of origin-destination movement data. IEEE Transactions on Visualization and Computer Graphics, 2017,23(9):2120-2136.

PMID

[14]
Goodchild M F, Yuan M, Cova T J. Towards a general theory of geographic representation in GIS. International Journal of Geographical Information Science, 2007,21(3):239-260.

[15]
Liu Y, Liu X, Gao S, et al. Social sensing: A new approach to understanding our socioeconomic environments. Annals of the Association of American Geographers, 2015,105(3):512-530.

[16]
Hettner A. Die Geographie: Ihre Geschichte, ihr Wesen und ihre Methoden. Breslau: Ferdinand Hirt, 1927.

[17]
Getis A. Spatial interaction and spatial autocorrelation: A cross-product approach. Environment and Planning A, 1991,23(9):1269-1277.

[18]
Matheron G. Principles of geostatistics. Economic Geology, 1963,58(8):1246-1266.

[19]
Haining R. Geography and spatial statistics: Current positions, future developments//Macmillan B. Remodelling Geography. Oxford: Basil Blackwell, 1989: 191-203.

[20]
Miller H J. Tobler's first law and spatial analysis. Annals of the Association of American Geographers, 2004,94(2):284-289.

[21]
Tobler W R. A computer movie simulating urban growth in the Detroit region. Economic Geography, 1970,46:234-240.

[22]
Rodrigue J P, Comtois C, Slack B. The Geography of Transport Systems. New York: Routledge, 2013.

[23]
Ratti C, Sobolevsky S, Calabrese F, et al. Redrawing the map of Great Britain from a network of human interactions. PLoS ONE, 2010,5(12):e14248. Doi: 10.1371/journal.pone.0014248.

[24]
Liu Y, Sui Z, Kang C, et al. Uncovering patterns of inter-urban trip and spatial interaction from social media check-in data. PLoS ONE, 2014,9(1):e86026. Doi: 10.1371/journal.pone.0086026.

PMID

[25]
Arbia G, Petrarca F. Effects of scale in spatial interaction models. Journal of Geographical Systems, 2013,15(3):249-264.

[26]
Bettencourt L M. The origins of scaling in cities. Science, 2013,340(6139):1438-1441.

[27]
Long Ying, Zhang Yu, Cui Chengyin. Identifying commuting pattern of Beijing using bus smart card data. Acta Geographica Sinica, 2012,67(10):1339-1352.

[ 龙瀛, 张宇, 崔承印. 利用公交刷卡数据分析北京职住关系和通勤出行. 地理学报, 2012,67(10):1339-1352.]

[28]
Yue Y, Wang H, Hu B, et al. Exploratory calibration of a spatial interaction model using taxi GPS trajectories. Computers, Environment and Urban Systems, 2012,36(2):140-153.

[29]
Goh S, Lee K, Park J S, et al. Modification of the gravity model and application to the metropolitan Seoul subway system. Physical Review E, 2012,86(2):026102. Doi: 10.1103/PhysRevE.86.026102.

[30]
Long Y, Thill J C. Combining smart card data and household travel survey to analyze jobs-housing relationships in Beijing. Computers, Environment and Urban Systems, 2015,53:19-35.

[31]
Liu X, Kang C, Gong L, et al. Incorporating spatial interaction patterns in classifying and understanding urban land use. International Journal of Geographical Information Science, 2016,30(2):334-350.

[32]
Kang C, Qin K. Understanding operation behaviors of taxicabs in cities by matrix factorization. Computers, Environment and Urban Systems, 2016,60:79-88.

[33]
Huang J, Levinson D, Wang J, et al. Tracking job and housing dynamics with smartcard data. Proceedings of the National Academy of Sciences of the United States of America, 2018,115(50):12710-12715.

[34]
Chi G, Thill J C, Tong D, et al. Uncovering regional characteristics from mobile phone data: A network science approach. Papers in Regional Science, 2016,95(3):613-631.

[35]
Xu Y, Shaw S L, Zhao Z, et al. Another tale of two cities: Understanding human activity space using actively tracked cellphone location data. Annals of the American Association of Geographers, 2016,106(2):489-502.

[36]
Gao S, Liu Y, Wang Y, et al. Discovering spatial interaction communities from mobile phone data. Transactions in GIS, 2013,17(3):463-481.

[37]
Wang De, Gu Jiahuan, Yan Longxu. Delimiting the Shanghai metropolitan area using mobile phone data. Acta Geographica Sinica, 2018,73(10):1896-1909.

[ 王德, 顾家焕, 晏龙旭. 上海都市区边界划分: 基于手机信令数据的探索. 地理学报, 2018,73(10):1896-1909.]

[38]
Noulas A, Scellato S, Lambiotte R, et al. A tale of many cities: Universal patterns in human urban mobility. PLoS ONE, 2012,7(5):e37027. Doi: 10.1371/journal.pone.0037027.

PMID

[39]
Zhen F, Cao Y, Qin X, et al. Delineation of an urban agglomeration boundary based on Sina Weibo microblog "check-in" data: A case study of the Yangtze River Delta. Cities, 2017,60:180-191.

[40]
Wu L, Zhi Y, Sui Z, et al. Intra-urban human mobility and activity transition: Evidence from social media check-in data. PLoS ONE, 2014,9(5):e97010. Doi: 10.1371/journal.pone.0097010.

[41]
Yuan Y, Lu Y, Chow T K, et al. The missing parts from social media enabled smart cities: Who, where, when, and what? Annals of the American Association of Geographers, 2020,110(2):462-475.

[42]
Liu Y, Wang F, Kang C, et al. Analyzing relatedness by toponym co-occurrences on web pages. Transactions in GIS, 2014,18(1):89-107.

[43]
Lin J, Li X. Simulating urban growth in a metropolitan area based on weighted urban flows by using web search engine. International Journal of Geographical Information Science, 2015,29(10):1721-1736.

DOI

[44]
Hu Y, Ye X, Shaw S L. Extracting and analyzing semantic relatedness between cities using news articles. International Journal of Geographical Information Science, 2017,31(12):2427-2451.

DOI

[45]
Zhong X, Liu J, Gao Y, et al. Analysis of co-occurrence toponyms in web pages based on complex networks. Physica A: Statistical Mechanics and Its Applications, 2017,466:462-475.

[46]
Zhang W, Thill J C. Mesoscale structures in world city networks. Annals of the American Association of Geographers, 2019,109(3):887-908.

[47]
Wilson A G. A statistical theory of spatial distribution models. Transportation Research, 1967,1(3):253-269.

[48]
Simini F, González M C, Maritan A, et al. A universal model for mobility and migration patterns. Nature, 2012,484(7392):96-100.

PMID

[49]
Openshaw S. Modelling spatial interaction using a neural net//Fischer M M, Nijkamp P. Geographic Information Systems, Spatial Modelling and Policy Evaluation. Heidelberg: Springer, 1993: 147-164.

[50]
Black W R. Spatial interaction modeling using artificial neural networks. Journal of Transport Geography, 1995,3(3):159-166.

[51]
Celik H M. Modeling freight distribution using artificial neural networks. Journal of Transport Geography, 2004,12(2):141-148.

[52]
Masucci A P, Serras J, Johansson A, et al. Gravity versus radiation models: On the importance of scale and heterogeneity in commuting flows. Physical Review E, 2013,88(2):022812. Doi: 10.1103/PhysRevE.88.022812.

[53]
Yan X Y, Zhao C, Fan Y, et al. Universal predictability of mobility patterns in cities. Journal of the Royal Society Interface, 2014,11(100):20140834. Doi: 10.1098/rsif.2014.0834.

[54]
Kang C, Liu Y, Guo D, et al. A generalized radiation model for human mobility: Spatial scale, searching direction and trip constraint. PLoS ONE, 2015,10(11):e0143500. Doi: 10.1371/journal.pone.0143500.

PMID

[55]
Kang C, Ma X, Tong D, et al. Intra-urban human mobility patterns: An urban morphology perspective. Physica A: Statistical Mechanics and Its Applications, 2012,391(4):1702-1717.

[56]
Rhee I, Shin M, Hong S, et al. On the levy-walk nature of human mobility. IEEE/ACM Transactions on Networking, 2011,19(3):630-643.

[57]
Pappalardo L, Simini F, Rinzivillo S, et al. Returners and explorers dichotomy in human mobility. Nature Communications, 2015,6:8166.

DOI PMID

[58]
Wang J, Dong L, Cheng X, et al. An extended exploration and preferential return model for human mobility simulation at individual and collective levels. Physica A: Statistical Mechanics and its Applications, 2019,534:121921. Doi: 10.1016/j.physa.2019.121921.

[59]
Barbosa H, de Lima-Neto F B, Evsukoff A, et al. The effect of recency to human mobility. EPJ Data Science, 2015,4:21.Doi: 10.1140/epjds/s13688-015-0059-8.

[60]
González M C, Hidalgo C A, Barabási A L. Understanding individual human mobility patterns. Nature, 2008,453(7196):779-782.

DOI PMID

[61]
Yan X Y, Wang W X, Gao Z Y, et al. Universal model of individual and population mobility on diverse spatial scales. Nature Communications, 2017,8:1639. Doi: 10.1038/s41467-017-01892-8.

DOI PMID

[62]
Berglund S, Karlström A. Identifying local spatial association in flow data. Journal of Geographical Systems, 1999,1(3):219-236.

[63]
Lu Y, Thill J C. Assessing the cluster correspondence between paired point locations. Geographical Analysis, 2003,35(4):290-309.

[64]
Liu Y, Tong D, Liu X. Measuring spatial autocorrelation of vectors. Geographical Analysis, 2015,47(3):300-319.

[65]
Tao R, Thill J C. Spatial cluster detection in spatial flow data. Geographical Analysis, 2016,48(4):355-372.

[66]
Xiang Q, Wu Q. Tree-based and optimum cut-based origin-destination flow clustering. ISPRS International Journal of Geo-Information, 2019,8(11):477.

[67]
Yao X, Zhu D, Gao Y, et al. A stepwise spatio-temporal flow clustering method for discovering mobility trends. IEEE Access, 2018,6:44666-44675.

[68]
Gao Y, Li T, Wang S, et al. A multidimensional spatial scan statistics approach to movement pattern comparison. International Journal of Geographical Information Science, 2018,32(7):1304-1325.

[69]
Song C, Pei T, Ma T, et al. Detecting arbitrarily shaped clusters in origin-destination flows using ant colony optimization. International Journal of Geographical Information Science, 2019,33(1):134-154.

[70]
Tao R, Thill J C. FlowAMOEBA: Identifying regions of anomalous spatial interactions. Geographical Analysis, 2019,51(1):111-130.

[71]
Getis A, Aldstadt J. Constructing the spatial weights matrix using a local statistic. Geographical Analysis, 2004,36(2):90-104.

[72]
Tobler W R. Experiments in migration mapping by computer. The American Cartographer, 1987,14(2):155-163.

[73]
Tobler W R. A model of geographical movement. Geographical Analysis, 1981,13(1):1-20.

[74]
Andrienko N, Andrienko G. Spatial generalization and aggregation of massive movement data. IEEE Transactions on Visualization and Computer Graphics, 2011,17(2):205-219.

PMID

[75]
Guo D. Flow mapping and multivariate visualization of large spatial interaction data. IEEE Transactions on Visualization and Computer Graphics, 2009,15(6):1041-1048.

DOI PMID

[76]
Cui W, Zhou H, Qu H, et al. Geometry-based edge clustering for graph visualization. IEEE Transactions on Visualization and Computer Graphics, 2008,14(6):1277-1284.

DOI PMID

[77]
Holten D, van Wijk J J. Force-directed edge bundling for graph visualization. Computer Graphics Forum, 2009,28(3):983-990.

DOI

[78]
Verbeek K, Buchin K, Speckmann B. Flow map layout via spiral trees. IEEE Transactions on Visualization and Computer Graphics, 2011,17(12):2536-2544.

[79]
Jenny B, Stephen D M, Muehlenhaus I, et al. Force-directed layout of origin-destination flow maps. International Journal of Geographical Information Science, 2017,31(8):1521-1540.

DOI

[80]
Koylu C, Guo D. Design and evaluation of line symbolizations for origin-destination flow maps. Information Visualization, 2017,16(4):309-331.

DOI

[81]
Jenny B, Stephen D M, Muehlenhaus I, et al. Design principles for origin-destination flow maps. Cartography and Geographic Information Science, 2018,45(1):62-75.

DOI

[82]
von Landesberger T, Brodkorb F, Roskosch P, et al. Mobilitygraphs: Visual analysis of mass mobility dynamics via spatio-temporal graphs and clustering. IEEE Transactions on Visualization and Computer Graphics, 2016,22(1):11-20.

DOI PMID

[83]
Abel G J, Sander N. Quantifying global international migration flows. Science, 2014,343(6178):1520-1522.

DOI PMID

[84]
Masser I, Brown P J. Spatial representation and spatial interaction. Papers of the Regional Science Association, 1977,38(1):71-92.

DOI

[85]
Guo D. Visual analytics of spatial interaction patterns for pandemic decision support. International Journal of Geographical Information Science, 2007,21(8):859-877.

DOI

[86]
Yang Y, Dwyer T, Goodwin S, et al. Many-to-many geographically-embedded flow visualisation: An evaluation. IEEE Transactions on Visualization and Computer Graphics, 2017,23(1):411-420.

DOI PMID

[87]
Kong X, Liu Y, Wang Y, et al. Investigating public facility characteristics from a spatial interaction perspective: A case study of Beijing hospitals using taxi data. ISPRS International Journal of Geo-Information, 2017,6(2):38. Doi: 10.3390/ijgi6020038.

DOI

[88]
Wood J, Dykes J, Slingsby A. Visualisation of origins, destinations and flows with OD maps. The Cartographic Journal, 2010,47(2):117-129.

DOI

[89]
Yao X, Wu L, Zhu D, et al. Visualizing spatial interaction characteristics with direction-based pattern maps. Journal of Visualization, 2019,22(3):555-569.

DOI

[90]
Fotheringham A S. Spatial structure and distance-decay parameters. Annals of the Association of American Geographers, 1981,71(3):425-436.

[91]
Shen G. Reverse-fitting the gravity model to inter-city airline passenger flows by an algebraic simplification. Journal of Transport Geography, 2004,12(3):219-234.

DOI

[92]
Xiao Y, Wang F, Liu Y, et al. Reconstructing gravitational attractions of major cities in China from air passenger flow data, 2001-2008: A particle swarm optimization approach. The Professional Geographer, 2013,65(2):265-282.

DOI

[93]
Kang C, Zhang Y, Ma X, et al. Inferring properties and revealing geographical impacts of intercity mobile communication network of China using a subnet data set. International Journal of Geographical Information Science, 2013,27(3):431-448.

DOI

[94]
O'Kelly M E, Song W, Shen G. New estimates of gravitational attraction by linear programming. Geographical Analysis, 1995,27(4):271-285.

DOI

[95]
Song W. Nodal attractions in China's intercity air passenger transportation. Papers of the Applied Geography Conferences, 2006,29:443-452.

[96]
Noronha V T, Goodchild M F. Modeling interregional interaction: Implications for defining functional regions. Annals of the Association of American Geographers, 1992,82(1):86-102.

DOI

[97]
Brown L A, Holmes J. The delimitation of functional regions, nodal regions, and hierarchies by functional distance approaches. Journal of Regional Science, 1971,11(1):57-72.

DOI

[98]
Masser I, Brown P J. Hierarchical aggregation procedures for interaction data. Environment and Planning A, 1975,7(5):509-523.

DOI

[99]
Batty M. Entropy and spatial geometry. Area, 1972,4:230-236.

[100]
Openshaw S. Optimal zoning systems for spatial interaction models. Environment and Planning A, 1977,9(2):169-184.

DOI

[101]
Kim K, Dean D J, Kim H, et al. Spatial optimization for regionalization problems with spatial interaction: A heuristic approach. International Journal of Geographical Information Science, 2016,30(3):451-473.

DOI

[102]
Fortunato S. Community detection in graphs. Physics Reports, 2010,486(3-5):75-174.

DOI

[103]
Thiemann C, Theis F, Grady D, et al. The structure of borders in a small world. PLoS ONE, 2010,5(11):e15422. Doi: 10.1371/journal.pone.0015422.

DOI PMID

[104]
Liu X, Gong L, Gong Y, et al. Revealing travel patterns and city structure with taxi trip data. Journal of Transport Geography, 2015,43:78-90.

DOI

[105]
Expert P, Evans T S, Blondel V D, et al. Uncovering space-independent communities in spatial networks. Proceedings of the National Academy of Sciences of the United States of America, 2011,108(19):7663-7668.

[106]
Chen Y, Xu J, Xu M. Finding community structure in spatially constrained complex networks. International Journal of Geographical Information Science, 2015,29(6):889-911.

DOI

[107]
Lin J. Network analysis of China's aviation system, statistical and spatial structure. Journal of Transport Geography, 2012,22:109-117.

DOI

[108]
Wang Jiao'e, Jiao Jingjuan, Jin Fengjun. Spatial effects of high-speed rails on interurban economic linkages in China. Acta Geographica Sinica, 2014,69(12):1833-1846.

DOI

[ 王姣娥, 焦敬娟, 金凤君. 高速铁路对中国城市空间相互作用强度的影响. 地理学报, 2014,69(12):1833-1846.]

[109]
Jang W, Yao X. Interpolating spatial interaction data. Transactions in GIS, 2011,15(4):541-555.

DOI

[110]
Zhu D, Huang Z, Shi L, et al. Inferring spatial interaction patterns from sequential snapshots of spatial distributions. International Journal of Geographical Information Science, 2018,32(4):783-805.

DOI

[111]
Roth C, Kang S M, Batty M, et al. Structure of urban movements: Polycentric activity and entangled hierarchical flows. PLoS ONE, 2011,6(1):e15923. Doi: 10.1371/journal.pone.0015923.

DOI PMID

[112]
Zhong C, Schläpfer M, Arisona S M, et al. Revealing centrality in the spatial structure of cities from human activity patterns. Urban Studies, 2016,54(2):437-455.

DOI

[113]
Zhong C, Arisona S, Huang X, et al. Detecting the dynamics of urban structure through spatial network analysis. International Journal of Geographical Information Science, 2014,28(11):2178-2199.

DOI

[114]
Huang J, Levinson D, Wang J, et al. Job-worker spatial dynamics in Beijing: Insights from smart card data. Cities, 2019,86:83-93.

DOI

[115]
Huang Jie, Wang Jiao'e, Jin Haitao, et al. Investigating spatiotemporal patterns of passenger flows in the Beijing metro system from smart card data. Progress in Geography, 2018,37(3):397-406.

DOI

[ 黄洁, 王姣娥, 靳海涛, 等. 北京市地铁客流的时空分布格局及特征: 基于智能交通卡数据. 地理科学进展, 2018,37(3):397-406.]

[116]
Li Zhifeng, Zhao Miaoxi. City networks in cyberspace: Using Douban-event to measure the cross-city activities in urban agglomeration of China. Human Geography, 2016,31(6):102-108.

[ 黎智枫, 赵渺希. 赛博空间视角下中国三大城市群网络特征: 基于豆瓣跨城活动数据. 人文地理, 2016,31(6):102-108.]

[117]
Zhen Feng, Wang Bo, Chen Yingxue. China's city network characteristics based on social network space: An empirical analysis of Sina micro-blog. Acta Geographica Sinica, 2012,67(8):1031-1043.

DOI

[ 甄峰, 王波, 陈映雪. 基于网络社会空间的中国城市网络特征: 以新浪微博为例. 地理学报, 2012,67(8):1031-1043.]

[118]
Hawelka B, Sitko I, Beinat E, et al. Geo-located Twitter as proxy for global mobility patterns. Cartography and Geographic Information Science, 2014,41(3):260-271.

DOI

[119]
Wei Ye, Xiu Chunliang, Liu Zhimin, et al. Spatial pattern of city network in transitional China based on the population flows in "Chunyun" period. Scientia Geographica Sinica, 2016,36(11):1654-1660.

DOI

[ 魏冶, 修春亮, 刘志敏, 等. 春运人口流动透视的转型期中国城市网络结构. 地理科学, 2016,36(11):1654-1660.]

[120]
Ren M, Lin Y, Jin M, et al. Examining the effect of land-use function complementarity on intra-urban spatial interactions using metro smart card records. Transportation, 2019. Doi: 10.1007/s11116-019-09977-7.

DOI PMID

[121]
Bauer D, Gonzalez M C, Toole J L, et al. Inferring land use from mobile phone activity. Beijing: Proceedings of the ACM SIGKDD International Workshop on Urban Computing, 2012.

[122]
Ding Liang, Niu Xinyi, Song Xiaodong, Measuring the employment center system in Shanghai central city: A study using mobile phone signaling data. Acta Geographica Sinica, 2016,71(3):484-499.

DOI

[ 丁亮, 钮心毅, 宋小冬, 上海中心城就业中心体系测度: 基于手机信令数据的研究. 地理学报, 2016,71(3):484-499.]

[123]
Wang J, Mo H, Wang F, et al. Exploring the network structure and nodal centrality of China's air transport network: A complex network approach. Journal of Transport Geography, 2011,19(4):712-721.

DOI

[124]
Wang J, Mo H, Wang F. Evolution of air transport network of China 1930-2012. Journal of Transport Geography, 2014,40:145-158.

DOI

[125]
Jiao Jingjuan, Wang Jiao'e, Jin Fengjun, et al. Impact of high-speed rail on inter-city network based on the passenger train network in China, 2003-2013. Acta Geographica Sinica, 2016,71(2):265-280.

DOI

[ 焦敬娟, 王姣娥, 金凤君, 等. 高速铁路对城市网络结构的影响研究: 基于铁路客运班列分析. 地理学报, 2016,71(2):265-280.]

[126]
Yan X Y, Wang W X, Gao Z Y, et al. Universal model of individual and population mobility on diverse spatial scales. Nature Communications, 2017,8:1639. Doi: 10.1038/s41467-017-01892-8.

DOI PMID

[127]
Zhang Y, Cheng T, Ren Y, et al. A novel residual graph convolution deep learning model for short-term network-based traffic forecasting. International Journal of Geographical Information Science, 2020,34(5):969-995.

DOI

[128]
Irfan A, Rasyid R A, Handayani S. Data mining applied for accident prediction model in Indonesia toll road. AIP Conference Proceedings, 2018,1977(1):060001. Doi: 10.1063/1.5043013.

[129]
Brum-Bastos W, Long J, Demšar U. Weather effects on human mobility: A study using multi-channel sequence analysis. Computers, Environment and Urban Systems, 2018,71:131-152.

DOI

[130]
Shi X, Wang F. Applications of Geospatial Information Technologies in Public Health. Beijing: Higher Education Press, 2016.

[131]
Wallace D, Chen M. A simulation of the US influenza outbreak in 2009-2010 using a patch sir model based on airport transportation data. Toronto: Proceedings of International Symposium on Mathematical and Computational Biology (BIOMAT 2013), 2013: 286-297.

[132]
Haydon D T, Chase-Topping M, Shaw D J, et al. The construction and analysis of epidemic trees with reference to the 2001 UK foot-and-mouth outbreak. Proceedings of the Royal Society of London. Series B: Biological Sciences, 2003,270(1511):121-127.

[133]
Lau M S, Dalziel B D, Funk S, et al. Spatial and temporal dynamics of superspreading events in the 2014-2015 West Africa Ebola epidemic. Proceedings of the National Academy of Sciences of USA, 2017,114(9):2337-2342.

[134]
Li M, Shi X, Li X, et al. Epidemic forest: A spatiotemporal model for communicable diseases. Annals of the American Association of Geographers, 2019,109(3):812-836.

DOI

[135]
Yuan H Y, Hossain M P, Tsegaye M M, et al. Estimating the risk on outbreak spreading of 2019-nCoV in China using transportation data. MedRxiv, 2020. Doi: 10.1101/2020.02.01.20019984.

DOI PMID

[136]
Wu J T, Leung K, Leung G M. Nowcasting and forecasting the potential domestic and international spread of the 2019-nCoV outbreak originating in Wuhan, China: A modelling study. The Lancet, 2020. Doi: 10.1016/S0140-6736(20)30260-9.

DOI PMID

[137]
Wang F, McLafferty S, Escamilla V, et al. Late-stage breast cancer diagnosis and health care access in Illinois. Professional Geographer, 2008,60:54-69.

DOI PMID

[138]
Wang F. Measurement, optimization, and impact of health care accessibility: A methodological review. Annals of the Association of American Geographers, 2012,102(5):1104-1112.

DOI PMID

[139]
Jia P, Wang F, Xierali I M. Delineating hierarchical hospital service areas in Florida. Geographical Review, 2017,107(4):608-623.

DOI

[140]
Jia P, Wang F, Xierali I M. Using a Huff-based model to delineate hospital service areas. Professional Geographer, 2017,69(4):522-530.

DOI

[141]
Huff D L. A probabilistic analysis of shopping center trade areas. Land Economics, 1963,39(1):81-90.

DOI

[142]
Hu Y, Wang F, Xierali I M. Automated delineation of hospital service areas and hospital referral regions by modularity optimization. Health Services Research, 2018,53(1):236-255.

DOI PMID

[143]
Li J, Xu L, Tang L, et al. Big data in tourism research: A literature review. Tourism Management, 2018,68:301-323.

DOI

[144]
Shao H, Zhang Y, Li W. Extraction and analysis of city's tourism districts based on social media data. Computers, Environment and Urban Systems, 2017,65:66-78.

DOI

[145]
Yang Y, Zhang H. Spatial-temporal forecasting of tourism demand. Annals of Tourism Research, 2019,75:106-119.

DOI

[146]
Raun J, Ahas R, Tiru M. Measuring tourism destinations using mobile tracking data. Tourism Management, 2016,57:202-212.

DOI

[147]
Lv S X, Peng L, Wang L. Stacked autoencoder with echo-state regression for tourism demand forecasting using search query data. Applied Soft Computing, 2018,73:119-133.

DOI

[148]
Marrocu E, Paci R. They arrive with new information. Tourism flows and production efficiency in the European regions. Tourism Management, 2011,32:750-758.

DOI

[149]
Yang Y, Li D, Li X. Public transport connectivity and intercity tourist flows. Journal of Travel Research, 2019,58:25-41.

DOI

[150]
Zhang S, Zhu D, Yao X, et al. The scale effect on spatial interaction patterns: An empirical study using taxi OD data of Beijing and Shanghai. IEEE Access, 2018,6:51994-52003.

DOI

[151]
Yue M, Kang C, Andris C, et al. Understanding the interplay between bus, metro, and cab ridership dynamics in Shenzhen, China. Transactions in GIS, 2018,22(3):855-871.

DOI

[152]
Zhu D, Zhang F, Wang S, et al. Understanding place characteristics in geographic contexts through graph convolutional neural networks. Annals of the American Association of Geographers, 2020,110(2):408-420.

DOI

文章导航

/