
过去千年中国不同区域干湿的多尺度变化特征评估
|
郑景云(1966-), 男, 研究员, 博士生导师, 主要从事气候变化研究。E-mail: zhengjy@igsnrr.ac.cn |
收稿日期: 2019-06-14
要求修回日期: 2020-06-03
网络出版日期: 2020-09-25
基金资助
国家重点研发计划(2017YFA0603300)
国家自然科学基金项目(41831174)
国家自然科学基金项目(41671036)
中国科学院战略性先导科技专项(XDA19040101)
中国科学院重点部署项目(ZDRW-ZS-2017-4)
版权
The assessment on hydroclimatic changes of different regions in China at multi-scale during the past millennium
Received date: 2019-06-14
Request revised date: 2020-06-03
Online published: 2020-09-25
Supported by
National Key R&D Program of China(2017YFA0603300)
National Natural Science Foundation of China(41831174)
National Natural Science Foundation of China(41671036)
Strategic Priority Research Program of the Chinese Academy of Sciences(XDA19040101)
Key Research Programs of the Chinese Academy of Sciences(ZDRW-ZS-2017-4)
Copyright
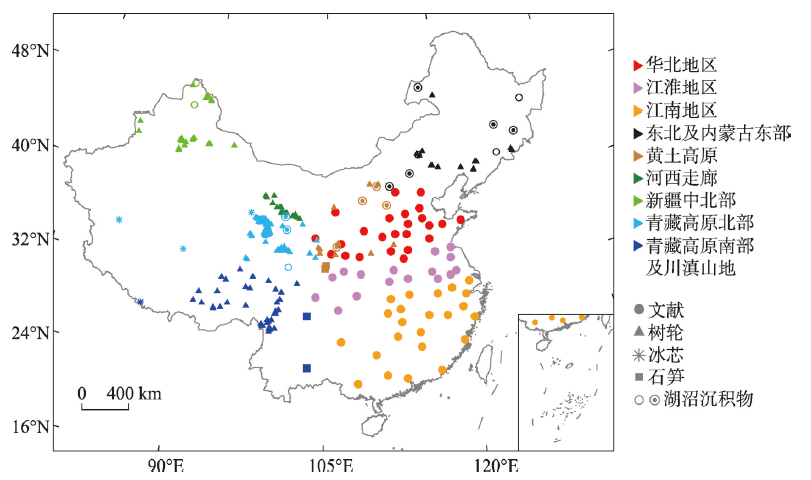
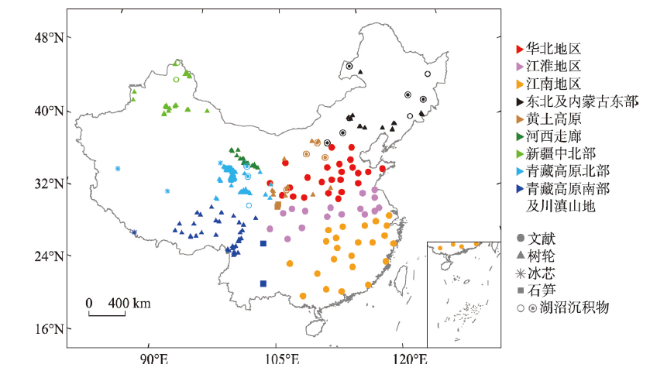
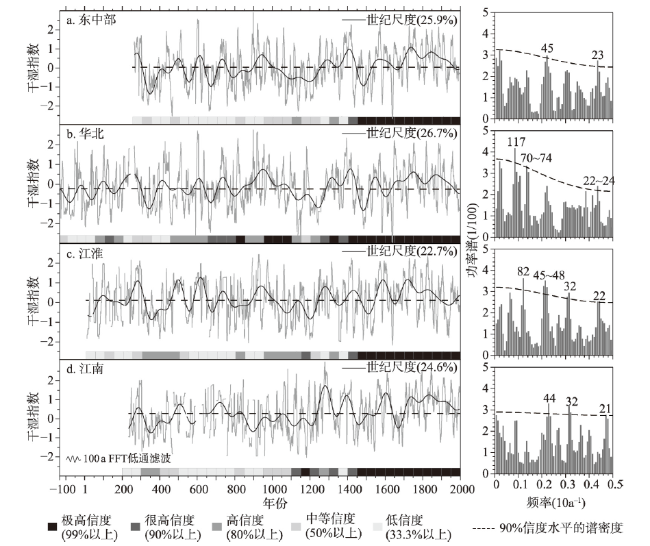
依据近年发表的新成果,对中国过去千年干湿的年至百年尺度变化特征进行了总结梳理与对比分析,综合评估了20世纪干湿变幅的历史地位。主要结论是:① 根据历史文献记载重建的东中部各区干湿序列在1400年以后均达高信度,但其前因存在记录缺失,仅有半数时段的重建结果达高信度。在东北及内蒙古东部,根据不同地点湖沼沉积物记录揭示的区域干湿百年尺度变化特征在多数时段不一致。在西部的黄土高原、河西走廊、新疆中北部、青藏高原东北部和东南部等地区,利用不同地点树轮资料重建的干湿序列显示的干湿变化特征在区内一致性高。② 过去千年中国各地干湿变化均存在显著的年际、年代际和百年尺度周期。其中准2.5 a、60~80 a和110~120 a等尺度的周期为所有地区共有;3.5~5.0 a、20~35 a等尺度周期则主要发生在东北、东中部地区、黄土高原和青藏高原;而准45 a周期则只发生在东北和东中部地区(均超过90%信度水平);各区域间的干湿变化位相并不同步。③ 尽管已发现青藏高原东北部20世纪很可能是过去3000 a最湿的世纪之一,但其他大多数区域的重建结果显示:20世纪的干湿变幅在年代际尺度上均未超出其前各个时段的变率范围。
关键词: 过去千年; 干湿变化; 多尺度特征; 20世纪干湿变幅的历史地位; 中国
郑景云 , 张学珍 , 刘洋 , 郝志新 . 过去千年中国不同区域干湿的多尺度变化特征评估[J]. 地理学报, 2020 , 75(7) : 1432 -1450 . DOI: 10.11821/dlxb202007008
Based on the latest hydroclimatic reconstructions in peer-reviewed scientific journals, we summarize the multi-scale pattern on hydroclimatic changes and assess whether or not the variability of the 20th century is unusual in the context of the past millennium for different regions of China. The main conclusions are as follows: (1) In the central-eastern China, the dry/wet series reconstructed from historical documents after 1400 have high confidence level, while before 1400, the reconstructions only in half of the period have high confidence due to the shortage of records. In northeastern China and eastern Inner Mongolia, centennial-scale reconstructions from lake sediments at multiple sites are in low agreement in most of periods. In Loess Plateau, Hexi Corridor, central to northern Xinjiang, northeastern and southeastern Tibetan Plateau, hydroclimatic reconstructions from tree rings have robust agreement within the same region. (2) All sub-regions of China show significant cycles with 90% confidence level at inter-annual, inter-decadal and centennial scales. The cycles of 2.5 a, 60-80 a and 110-120 a are detected over all the regions, while the cycles of 3.5-5.0 a and 20-35 a mainly occur in the Loess Plateau, Tibetan Plateau, northeastern and central-eastern China. The cycle of quasi-45 a only occurs in northeastern and central-eastern China. Moreover, the hydroclimatic changes are out of phase in different regions. (3) The 20th century is one of the wettest centuries in the past 3000 years in northeastern Tibetan Plateau. However, most series from other regions show that the inter-decadal hydroclimatic variability of the 20th century does not exceed the amplitude of natural variability, which had ever occurred during the past millennium.
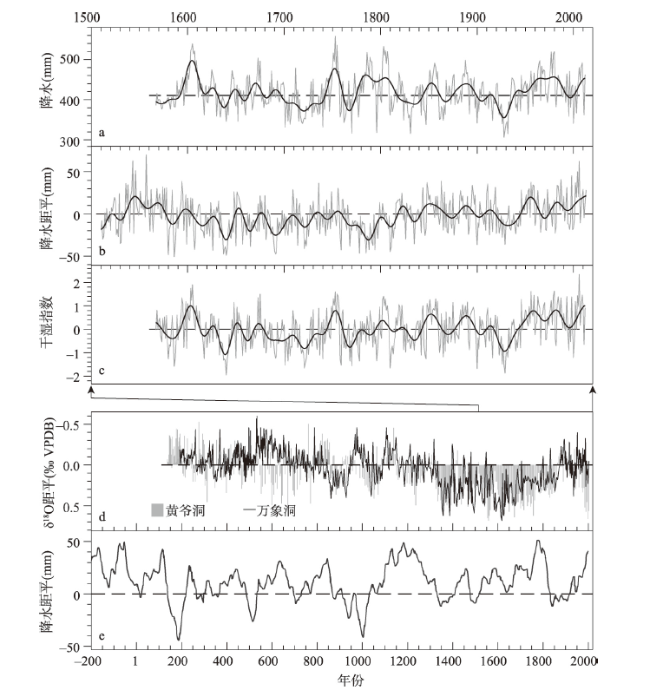
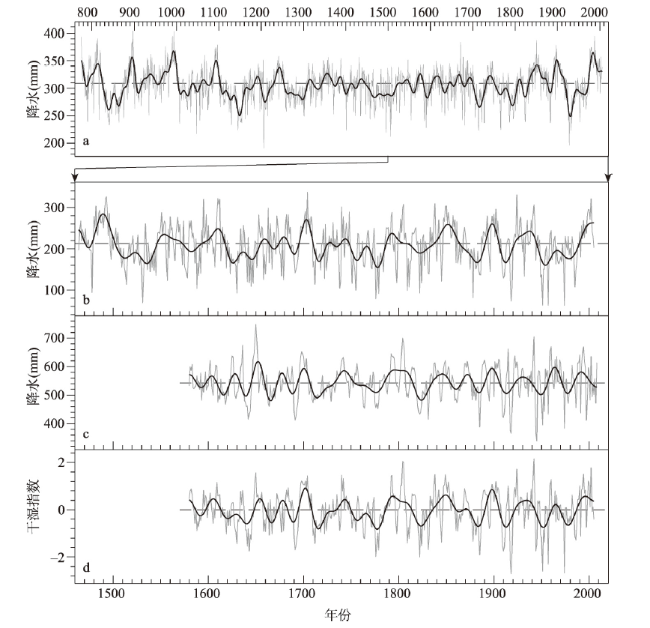
图3 利用多种代用资料重建的过去千年东北和北方半干旱区干湿变化注:a为利用树轮重建的黄土高原西部年降水量(上年8 月—当年7 月)[50];b 为利用树轮重建的黄土高原东南部5 月降水量[54];c为根据a和b 两条序列标准化值计算的区域干湿指数;图a~图c粗实线表示10 a FFT低通滤波;d 为黄土高原南侧的万象洞与黄爷洞石笋δ18O记录[55-56];e为集成东北地区和北方半干旱区11 个湖沼沉积物(孢粉记录重建的该区域过去2200 a降水变化[57]);基准线表示1851—1950 年平均值。 Fig. 3 Hydroclimate reconstructions based on multi-proxies in Northeast China and semi-arid region in North China |
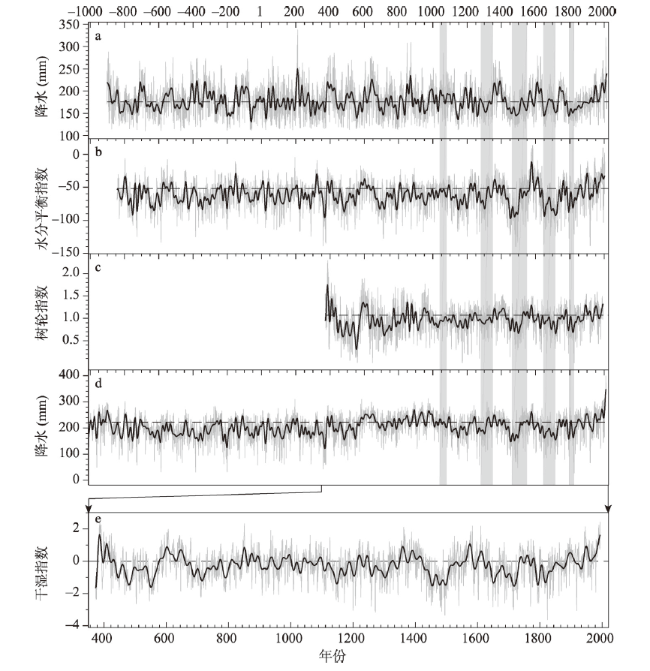
图5 利用青藏高原北部树轮重建的各地过去3000 a干湿变化序列注:a为诺木洪年(上年7月—当年6月)降水量[76];b为德令哈1—6月水分平衡指数[77];c为都兰树轮宽度指数[78];d为青藏高原东北部年(上年7 月—当年6 月)降水量[75];e为根据图a~图d 序列标准化值计算的区域干湿指数;浅灰色粗柱框为过去千年太阳黑子极小期;虚线表示1851—1950 年平均值;粗实线表示10 a FFT低通滤波。 Fig. 5 Dry/wet changes in the north of Tibetan Plateau based on tree rings over the past 3000 years |
图6 利用青藏高原南部树轮重建的各地过去1000 a干湿变化序列注:a为念青唐古拉山北部5—6 月SPEI[89];b为林周年降水量(上年7 月—当年6 月)[93];c为那曲东部5—6月PDSI[94];d 为雅鲁藏布江上游地区年降水量(上年7月—当年6 月)[91];e为横断山区年PDSI(上年5 月—当年4 月)[95];f 为图a~图e序列标准化值计算的区域干湿指数;虚线表示1851—1950 年平均值,粗实线表示10 a FFT低通滤波。 Fig. 6 Dry/wet changes reconstructed from tree rings in the south of Tibetan Plateau over the past 1000 years |
图7 过去600 a青藏高原东北部和南部年(上年7月—当年6 月)降水变化对比及其50 a滑动相关系数注:a为文献[75-76]降水重建结果的平均值;b 为文献[92-93]降水重建结果的平均值;基准线表示1851—1950 年平均值;粗实线表示10 a FFT低通滤波。 Fig. 7 Comparison on the changes of precipitations from previous July to current June in the northeast (a) and south (b) of Tibetan Plateau, and the bar chart between (a) and (b) shows their correlation coefficient in the 50-year running windows |
| [1] |
PAGES. PAGES Restructured. Past Global Changes Magazine, 2014,22(1):3.
|
| [2] |
|
| [3] |
PAGES Hydro2k Consortium. Comparing proxy and model estimates of hydroclimate variability and change over the Common Era. Climate of the Past, 2017,13(12):1851-1900.
|
| [4] |
|
| [5] |
|
| [6] |
|
| [7] |
|
| [8] |
|
| [9] |
|
| [10] |
|
| [12] |
|
| [13] |
|
| [14] |
|
| [15] |
|
| [16] |
|
| [17] |
|
| [18] |
Academy of Meteorological Science of China Central Meteorological Administration. Yearly Charts of Dryness/Wetness in China for the Last 500-year Period. Beijing: Sinomap Press, 1981.
[ 中央气象局气象科学研究院. 中国近五百年旱涝分布图集. 北京: 地图出版社, 1981.]
|
| [19] |
[ 葛全胜. 中国历朝气候变化. 北京: 科学出版社, 2011.]
|
| [20] |
|
| [21] |
|
| [22] |
|
| [23] |
|
| [24] |
[ 秦大河, 罗勇, 董文杰. 中国气候与环境演变: 第一卷, 科学基础. 北京: 气象出版社, 2012: 55-58.]
|
| [25] |
Committee for the Preparation of the Second National Assessment Report on Climate Change. The Second National Assessment Report on Climate Change. Beijing: Science Press, 2011: 124-125.
[ 《第二次气候变化国家评估报告》编写委员会. 第二次气候变化国家评估报告. 北京: 科学出版社, 2011: 124-125.]
|
| [26] |
Committee for the Preparation of the Third National Assessment Report on Climate Change. The Third National Assessment Report on Climate change. Beijing: Science Press, 2015: 20-21.
[ 《第三次气候变化国家评估报告》编写委员会. 第三次气候变化国家评估报告. 北京: 科学出版社, 2015: 20-21.]
|
| [27] |
[ 张丕远. 中国历史气候变化. 济南: 山东科学技术出版社, 1996: 200-204.]
|
| [28] |
[ 张德二, 刘传志, 江剑民. 中国东部6区域近1000年干湿序列的重建和气候跃变分析. 第四纪研究, 1997,17(1):1-11.]
|
| [29] |
|
| [30] |
[ 郑景云, 郝志新, 方修琦, 等. 中国过去2000年极端气候事件变化的若干特征. 地理科学进展, 2014,33(1):3-12.]
|
| [31] |
|
| [32] |
|
| [33] |
|
| [34] |
|
| [35] |
|
| [36] |
|
| [37] |
|
| [38] |
|
| [39] |
|
| [40] |
|
| [41] |
|
| [42] |
|
| [43] |
|
| [44] |
|
| [45] |
|
| [46] |
|
| [47] |
|
| [48] |
|
| [49] |
|
| [50] |
|
| [51] |
|
| [52] |
|
| [53] |
|
| [54] |
|
| [55] |
|
| [56] |
|
| [57] |
|
| [58] |
[ 谭明. 近千年气候格局的环流背景: ENSO态的不确定性分析与再重建. 中国科学: 地球科学, 2016,46(5):657-673.]
|
| [59] |
|
| [60] |
|
| [61] |
|
| [62] |
|
| [63] |
|
| [64] |
|
| [65] |
|
| [66] |
|
| [67] |
|
| [68] |
|
| [69] |
|
| [70] |
|
| [71] |
[ 蒋庆丰, 沈吉, 刘兴起, 等. 2.5 ka来新疆吉力湖湖泊沉积记录的气候环境变化. 湖泊科学, 2010,22(1):119-126.]
|
| [72] |
|
| [73] |
[ 姚檀栋, 等. 青藏高原环境变化科学评估. 北京: 科学出版社, 2015: 157.]
|
| [74] |
|
| [75] |
|
| [76] |
|
| [77] |
|
| [78] |
|
| [79] |
|
| [80] |
|
| [81] |
|
| [82] |
|
| [83] |
|
| [84] |
[ 田立德, 姚檀栋. 青藏高原冰芯高分辨率气候环境记录研究进展. 科学通报, 2016,61(9):926-937.]
|
| [85] |
|
| [86] |
|
| [87] |
|
| [88] |
|
| [89] |
|
| [90] |
|
| [91] |
|
| [92] |
|
| [93] |
|
| [94] |
|
| [95] |
|
| [96] |
|
| [97] |
|
| [98] |
|
/
| 〈 |
|
〉 |

