
中国城市群城市用地扩张时空动态特征
|
欧阳晓(1990-), 男, 博士生, 研究方向为城市化过程及生态环境效应。E-mail: xiao.ouyang@foxmail.com |
收稿日期: 2019-04-30
要求修回日期: 2020-01-07
网络出版日期: 2020-05-25
基金资助
国家社会科学基金重大项目(18ZDA040)
国土资源评价与利用湖南省重点实验室开放课题(SYS-ZX-201902)
湖南省研究生科研创新项目(CX2018B296)
版权
Spatio-temporal characteristics of urban land expansion in Chinese urban agglomerations
Received date: 2019-04-30
Request revised date: 2020-01-07
Online published: 2020-05-25
Supported by
Major Program of National Social Science Foundation of China(18ZDA040)
The Open Topic of Hunan Key Laboratory of Land Resources Evaluation and Utilization(SYS-ZX-201902)
Hunan Provincial Innovation Foundation for Postgraduate(CX2018B296)
Copyright
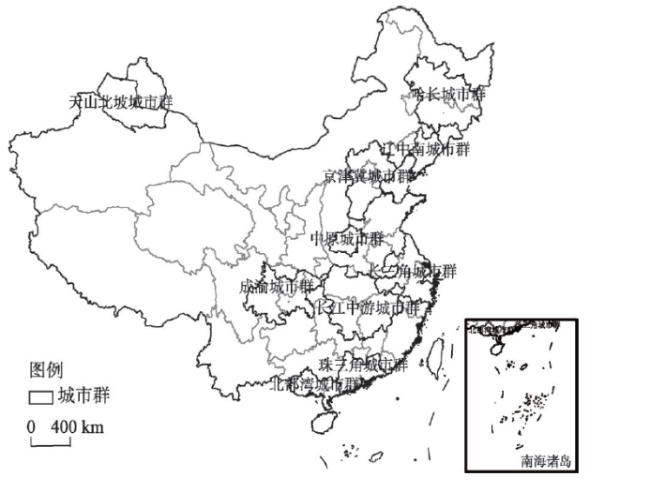
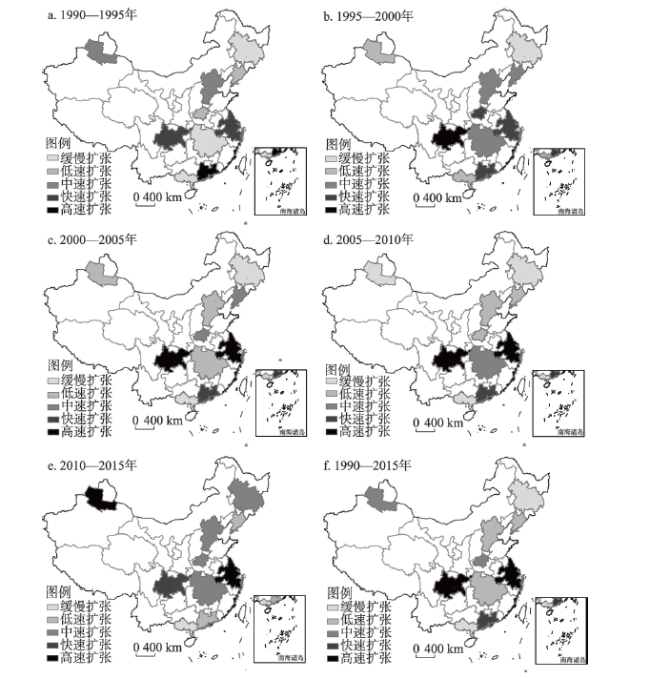
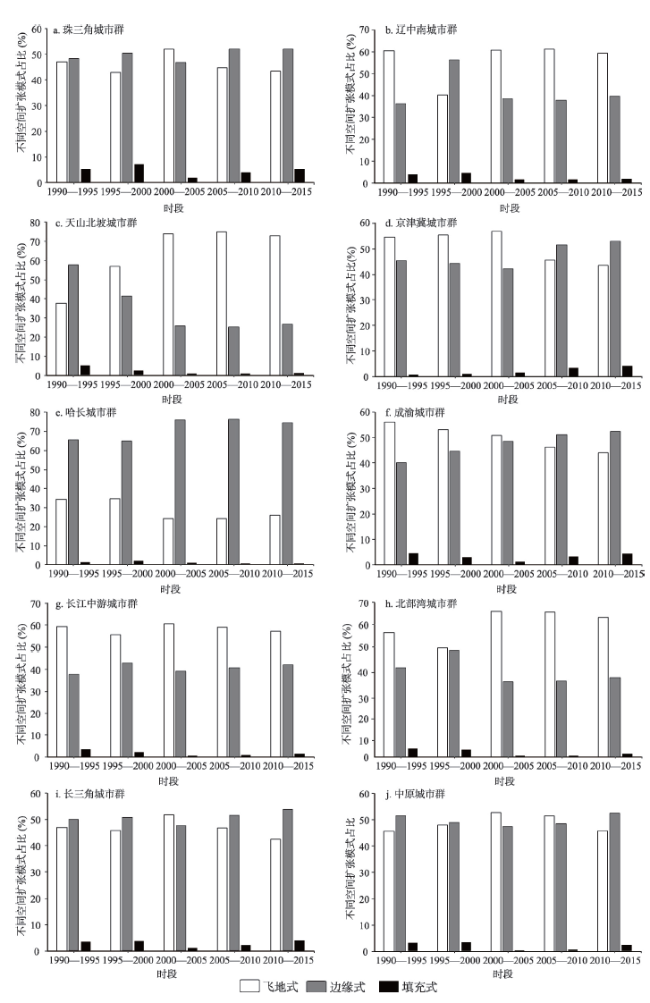
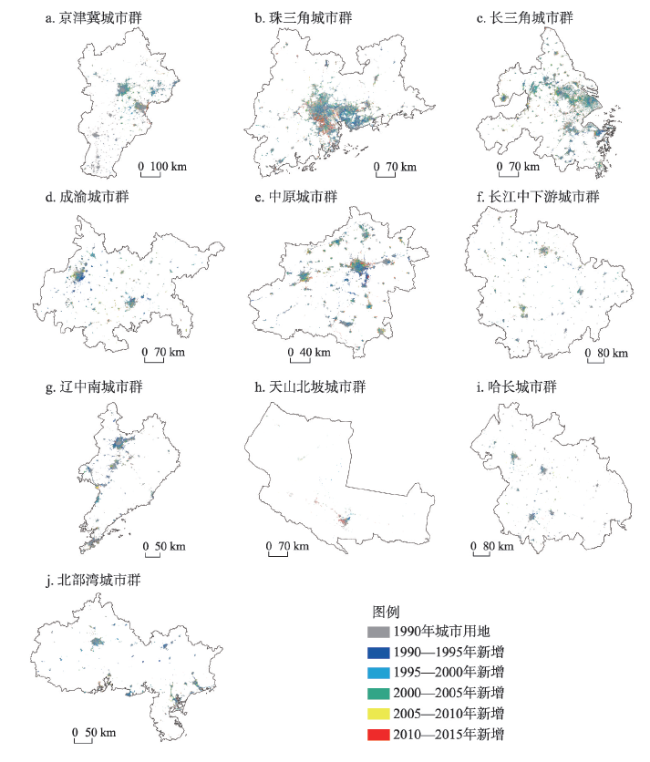
认识城市群城市用地扩张特征、扩张质量及景观生态效应等综合信息将有助于城市群空间高质量发展规划与决策。选取10个不同发育等级的城市群作为研究对象,综合运用城市用地扩张强度指数、城市用地扩张强度差异指数、景观扩张指数、景观格局指数,分析1990—2015年期间城市群城市用地扩张时空特征及景观生态效应,并构建人口、经济与城市用地协同发展指数,据此分析城市用地扩张中“人—地”关系协同程度。结果表明:① 1990—2015年,各个城市群城市用地面积持续增加,建成区的范围不断扩大,扩张强度呈现“上升—下降”的趋势;在2010年之前成熟型城市群的扩张强度最高,2010年之后培育型城市群成为扩张强度最高的类型。② 城市群城市用地扩张总体上呈现不均衡布局的趋势,高速扩张区域主要分布在沿海地区。从全国视角来看,东部高于中、西、东北部,整体城市群快速扩张的中心由东向西移动。③ 城市群城市用地空间扩张模式表现出边缘式和飞地式两种空间扩张模式并存,不同发育等级之间具有明显差异性,成熟型城市群的空间结构较为稳定,其他两种类型的城市群空间结构初具雏形或尚未形成。④ 城市群城市用地扩张“吞没”了郊区和农村地区,破碎化程度、形状的复杂程度较高,景观格局表现出不稳定。⑤ 城市群“人口—土地”协同程度逐步增强,“经济—土地”协同程度整体较高,整体上表现出城市用地扩张质量有所提升。新时期城市群城市用地应严格控制扩张规模,加快中小城市的发展,促进城市群城市用地扩张均衡发展,为城市群国土空间高质量发展提供重要参考。

欧阳晓 , 朱翔 . 中国城市群城市用地扩张时空动态特征[J]. 地理学报, 2020 , 75(3) : 571 -588 . DOI: 10.11821/dlxb202003010
Comprehensive analysis of the characteristics, quality, and ecological effects of urban land expansion would be extremely valuable in high-quality development planning and decision-making. Using data of ten urban agglomerations of China from 1990 to 2015 at varying levels of urban development, this study analyzed the degree of urban land expansion based on the "human-land" synergistic relationship and examined the spatio-temporal characteristics and landscape ecological effects of urban development. Various development indexes for population, economy, and urban land were evaluated, including the urban land expansion intensity index, the intensity differentiation index, the landscape expansion index, and the pattern index. The results of the study are as follows: (1) From 1990 to 2015, the built-up areas in the urban agglomerations expanded continuously, while the expansion intensity showed a fluctuating trend. The highest values of expansion intensity for developed urban agglomerations appeared before 2010, while for the developing areas, the highest values came after 2010. (2) Overall, there was an asymmetrical urban growth among the agglomerations, and the areas with high urban expansion were mainly distributed along the coastal zones. At the national level, the epicenter of rapid urban growth moved from east to west, with the urban expansion in eastern China being much faster compared with the central, western, and northeastern regions. (3) The evolution in urban land use displayed two main spatial patterns, namely edge expansion and outlying, which varied based on the level of urban development. The spatial pattern in the developed urban clusters was more stable, while in the developing areas, the spatial structure started to take shape but have yet to be formed. (4) Urban expansion sprawling over suburban and rural areas resulted in relatively high degrees of fragmentation and structural complexity and instability of the landscape pattern. (5) The man-land synergy in these urban agglomerations increased gradually over time while the economy-land interaction was generally high, indicating an improvement in the overall quality of urban growth. The results of this study highlight the need to have stricter supervision of urban expansion particularly in the early stages of city development, to foster the development of small and middle-sized cities, and to propose a more balanced approach in urban land expansion. The findings here provide valuable lessons for high-quality development of land use in urban agglomerations of China.
表1 景观格局指数与城市用地扩张之间的关系Tab. 1 Relationship between landscape pattern indexes and urban land expansion |
| 景观格局指数 | 单位 | 公式 | 生态学意义 | 与城市用地扩张的关系 |
|---|---|---|---|---|
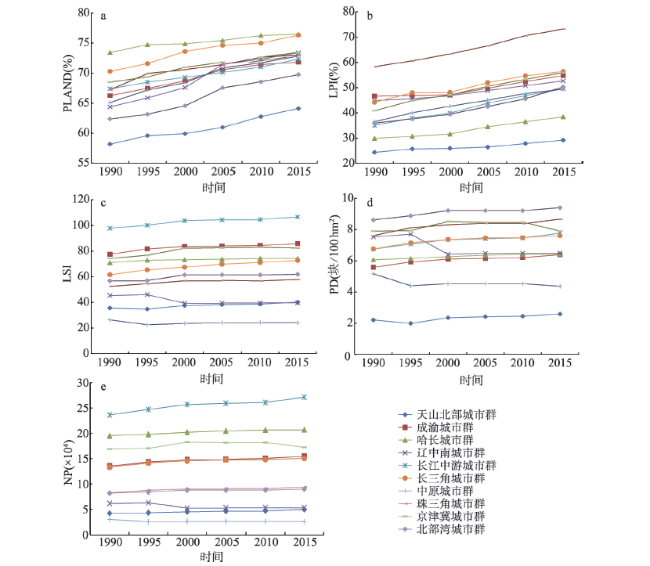
| 斑块数量(NP) | 个 | 斑块的数量 | 衡量城市用地离散程度。随着城市用地快速发展,斑块数呈上升趋势,随着城市用地的集聚,斑块数可能会下降。 | |
| 景观类型比例 (PLAND) | % | 斑块类型所占景观面积比例 | 反映城市用地的规模。值越大,城市用地扩张强度越大。 | |
| 最大斑块指数(LPI) | % | 最大斑块在整个景观中所占比例 | 反映城市用地斑块的优势度。值越大,城市用地扩张越集聚。 | |
| 景观形状指数(LSI) | - | 斑块形状复杂程度 | 反映城市用地斑块周边的复杂性。值越大,景观的形状越不规则。 | |
| 斑块密度(PD) | 个/hm2 | 单位面积斑块数量 | 反映城市用地斑块的数量。值越大,城市用地破碎程度越高。 |
注:为景观总面积;为斑块的面积;为类斑块的数目;为类斑块的面积;为斑块总周长。 |
表2 城市群城市用地扩张强度指数(%)Tab. 2 The intensity index of urban land expansion in urban agglomerations of China (%) |
| 城市群 | 1990—1995年 | 1995—2000年 | 2000—2005年 | 2005—2010年 | 2010—2015年 | 1990—2015年 |
|---|---|---|---|---|---|---|
| 京津冀城市群 | 0.79 | 0.91 | 0.95 | 0.57 | 0.55 | 0.81 |
| 长三角城市群 | 1.12 | 1.40 | 4.54 | 2.33 | 2.19 | 2.87 |
| 珠三角城市群 | 1.54 | 2.08 | 3.38 | 1.43 | 1.29 | 2.04 |
| 成渝城市群 | 1.11 | 3.00 | 4.07 | 2.22 | 1.54 | 2.99 |
| 中原城市群 | 0.31 | 0.46 | 0.77 | 1.67 | 1.61 | 1.05 |
| 长江中游城市 | 0.13 | 0.77 | 0.79 | 0.96 | 0.60 | 0.69 |
| 辽中南城市群 | 0.46 | 0.80 | 1.37 | 0.54 | 0.38 | 0.76 |
| 北部湾城市群 | 0.15 | 0.18 | 0.29 | 0.47 | 0.49 | 0.32 |
| 天山北坡城市群 | 0.60 | 0.49 | 0.77 | 0.36 | 2.37 | 0.99 |
| 哈长城市群 | 0.14 | 0.22 | 0.15 | 0.23 | 0.64 | 0.28 |
表3 城市用地与人口增长、经济增长协同发展指数Tab. 3 Temporal coevolution indexes of urban land with population and GDP |
| 城市群 | RatioPOP | LandGDP | |||||||||
|---|---|---|---|---|---|---|---|---|---|---|---|
| 1990—1995年 | 1995—2000年 | 2000—2005年 | 2005—2010年 | 2010—2015年 | 1990—1995年 | 1995—2000年 | 2000—2005年 | 2005—2010年 | 2010—2015年 | ||
| 京津冀城市群 | 0.97 | 0.89 | 1.00 | 1.02 | 1.05 | 3.49 | 4.85 | 4.74 | 7.16 | 7.44 | |
| 长三角城市群 | 0.94 | 0.95 | 0.94 | 0.97 | 0.96 | 1.62 | 2.85 | 1.35 | 2.31 | 3.37 | |
| 珠三角城市群 | 0.99 | 0.99 | 1.00 | 0.90 | 1.02 | 1.23 | 2.55 | 1.63 | 2.77 | 3.19 | |
| 成渝城市群 | 1.00 | 0.88 | 0.94 | 0.96 | 1.00 | 1.26 | 1.77 | 1.26 | 2.20 | 1.12 | |
| 中原城市群 | 1.00 | 0.90 | 0.77 | 0.94 | 0.96 | 1.51 | 2.97 | 2.49 | 3.28 | 4.92 | |
| 长江中游城市 | 0.93 | 0.90 | 1.00 | 0.95 | 0.98 | 4.52 | 5.54 | 3.97 | 5.19 | 7.11 | |
| 辽中南城市群 | 0.93 | 0.93 | 0.96 | 0.85 | 0.92 | 4.63 | 5.56 | 3.19 | 2.58 | 1.98 | |
| 北部湾城市群 | 1.24 | 0.94 | 1.00 | 0.91 | 1.14 | 8.29 | 9.09 | 6.28 | 7.89 | 8.04 | |
| 天山北坡城市群 | 0.85 | 0.85 | 1.00 | 0.97 | 1.03 | 4.51 | 6.73 | 3.86 | 5.62 | 6.69 | |
| 哈长城市群 | 0.95 | 0.75 | 1.00 | 0.97 | 1.06 | 5.32 | 6.83 | 7.13 | 6.41 | 3.83 | |
| [1] |
|
| [2] |
|
| [3] |
|
| [4] |
|
| [5] |
|
| [6] |
|
| [7] |
|
| [8] |
|
| [9] |
|
| [10] |
|
| [11] |
|
| [12] |
|
| [13] |
[ 王翠平, 王豪伟, 李春明 , 等. 基于DMSP/OLS影像的我国主要城市群空间扩张特征分析. 生态学报, 2012,32(3):942-954.]
|
| [14] |
|
| [15] |
|
| [16] |
|
| [17] |
|
| [18] |
|
| [19] |
[ 黄金川, 林浩曦 . 京津冀城市群多情景空间演化模拟. 地理研究, 2017,36(3):506-517.]
|
| [20] |
[ 欧维新, 张振, 陶宇 . 长三角城市土地利用格局与PM2.5浓度的多尺度关联分析. 中国人口·资源与环境, 2019,29(7):11-18.]
|
| [21] |
[ 沈威, 鲁丰先, 秦耀辰 , 等. 长江中游城市群城市生态承载力时空格局及其影响因素. 生态学报, 2019,39(11):3937-3951.]
|
| [22] |
[ 税丽, 潘洪义, 张秋月 , 等. 成渝城市群城市土地—耕地利用效率时空耦合研究. 水土保持通报, 2017,37(6):261-268.]
|
| [23] |
[ 周春山, 金万富, 史晨怡 . 新时期珠江三角洲城市群发展战略的思考. 地理科学进展, 2015,34(3):302-312.]
|
| [24] |
[ 许芸鹭, 雷国平 . 辽中南城市群城市用地结构的时空演变分析. 经济地理, 2018,38(1):69-77.]
|
| [25] |
[ 张苏文, 杨青山 . 哈长城市群核心—外围结构及发展阶段判断研究. 地理科学, 2018,38(10):1699-1706.]
|
| [26] |
[ 王万同, 孙汀, 王金霞 , 等. 基于多源遥感数据的区域生态系统服务价值年际动态监测: 以中原城市群为例. 地理科学, 2019,39(4):680-687.]
|
| [27] |
[ 杨勇, 任志远, 樊新生 . 中原城市群土地利用综合评价与分区研究. 经济地理, 2017,37(9):177-184.]
|
| [28] |
[ 方创琳, 高倩, 张小雷 , 等. 城市群扩展的时空演化特征及对生态环境的影响: 以天山北坡城市群为例. 中国科学: 地球科学, 2019,49(9):1413-1424.]
|
| [29] |
[ 王成港, 宁晓刚, 王浩 , 等. 利用夜间灯光数据的城市群格局变化分析. 测绘科学, 2019,44(6):176-186.]
|
| [30] |
[ 杨洋, 李雅静, 何春阳 , 等. 环渤海地区三大城市群城市规模分布动态比较: 基于1992—2012年夜间灯光数据的分析和透视. 经济地理, 2016,36(4):59-69.]
|
| [31] |
[ 方创琳 . 中国城市群研究取得的重要进展与未来发展方向. 地理学报, 2014,69(8):1130-1144.]
|
| [32] |
[ 王利伟, 冯长春 . 转型期京津冀城市群空间扩展格局及其动力机制: 基于夜间灯光数据方法. 地理学报, 2016,71(12):2155-2169.]
|
| [33] |
|
| [34] |
|
| [35] |
[ 王婧, 方创琳 . 城市建设用地增长研究进展与展望. 地理科学进展, 2011,30(11):1440-1448.]
|
| [36] |
[ 赵丹阳, 佟连军, 仇方道 , 等. 松花江流域城市用地扩张的生态环境效应. 地理研究, 2017,36(1):74-84.]
|
| [37] |
|
| [38] |
|
| [39] |
|
| [40] |
[ 方创琳, 姚士谋, 刘盛和 , 等. 中国城市群发展报告. 北京: 科学出版社, 2011.]
|
| [41] |
The State Council of the People's Republic of China. National Main Function Zone Planning. Beijing: People's Publishing House, 2015.
[ 国务院. 全国主体功能区规划. 北京: 人民出版社, 2015.]
|
| [42] |
[ 方创琳, 王振波, 马海涛 . 中国城市群形成发育规律的理论认知与地理学贡献. 地理学报, 2018,73(4):651-665.]
|
| [43] |
|
| [44] |
[ 刘纪远, 匡文慧, 张增祥 , 等. 20世纪80年代末以来中国土地利用变化的基本特征与空间格局. 地理学报, 2014,69(1):3-14.]
|
| [45] |
Bureau of Statistics of China. China City Statistical Yearbook. Beijing: China Statistics Press.
[ 中华人民共和国国家统计局. 中国城市统计年鉴. 北京: 中国统计出版社.]
|
| [46] |
Bureau of Statistics of China. China Statistical Yearbook. Beijing: China Statistics Press.
[ 中华人民共和国国家统计局. 中国统计年鉴. 北京: 中国统计出版社.]
|
| [47] |
[ 王海军, 张彬, 刘耀林 , 等. 基于重心—GTWR模型的京津冀城市群城镇扩展格局与驱动力多维解析. 地理学报, 2018,73(6):1076-1092.]
|
| [48] |
[ 关兴良, 方创琳, 周敏 , 等. 武汉城市群城镇用地空间扩展时空特征分析. 自然资源学报, 2012,27(9):1447-1459.]
|
| [49] |
|
| [50] |
|
| [51] |
|
| [52] |
|
| [53] |
[ 张琳, 王亚辉, 郭雨娜 . 中国土地城镇化与经济城镇化的协调性研究. 华东经济管理, 2016,30(6):111-117.]
|
| [54] |
[ 杨艳昭, 封志明, 赵延德 , 等. 中国城市土地扩张与人口增长协调性研究. 地理研究, 2013,32(9):1668-1678.]
|
| [55] |
[ 许雪爽, 包安明, 常存 , 等. 新疆重点城市建设用地扩张与人地配置协调性分析. 经济地理, 2017,37(10):92-99.]
|
| [56] |
The State Council of the People's Republic of China. National Urban System Planning (2016-2030). Beijing: People's Publishing House, 2016.
[ 国务院. 全国城镇体系规划(2016-2030). 北京: 人民出版社, 2016.]
|
| [57] |
[ 叶裕民, 陈丙欣 . 中国城市群的发育现状及动态特征. 城市问题, 2014(4):9-16.]
|
| [58] |
[ 王德利, 杨青山 . 中国城市群规模结构的合理性诊断及演变特征. 中国人口·资源与环境, 2018,28(9):123-132.]
|
| [59] |
[ 朱志军 . 新版《城市规划编制办法》总体规划阶段的现代技术应对与方法. 上海城市规划, 2007(4):12-15.]
|
| [60] |
|
| [61] |
|
/
| 〈 |
|
〉 |