
2000—2014年全球粮食安全格局的时空演化及影响因素
|
马恩朴(1989-), 男, 博士生, 贵州毕节人, 研究方向为城市农业、可持续城市化与土地利用/覆被变化研究。E-mail:maenpu2015@sina.com |
收稿日期: 2018-05-28
要求修回日期: 2019-12-02
网络出版日期: 2020-04-25
基金资助
国家自然科学基金重点项目(71734001)
版权
Spatio-temporal evolution of global food security pattern and its influencing factors in 2000-2014
Received date: 2018-05-28
Request revised date: 2019-12-02
Online published: 2020-04-25
Supported by
Key Project of National Natural Science Foundation of China(71734001)
Copyright
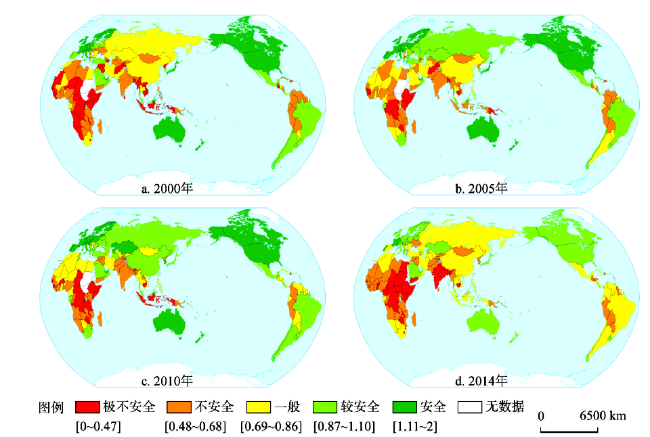
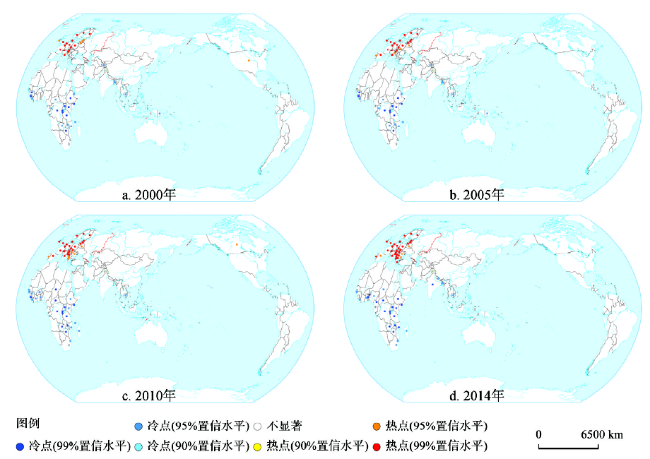
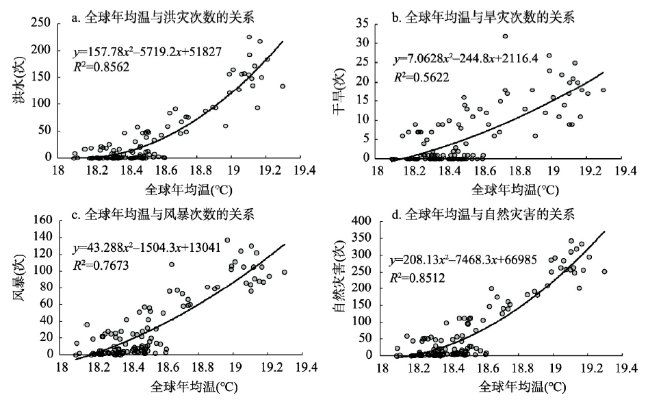
粮食安全是实现可持续发展整体目标的基础,由于“至2015年使饥饿人口比例减半”的千年发展目标并未如期实现,使得2030年零饥饿目标的实现面临更大挑战。鉴于此,亟需从全球粮食安全格局的时空演化中寻找全球粮食安全问题的内在原因。在建立粮食安全评价因子数据集和粮食安全影响因素数据集的基础上,运用多指标综合评价法评价2000—2014年172个国家的粮食安全水平;进而通过空间自相关分析研究全球粮食安全格局的空间模式与变化特征;在此基础上运用多元非线性回归方法分析粮食安全格局的影响因素。结果表明:① 全球粮食安全格局呈现出社会经济发展与粮食安全水平“高—高集聚、低—低集聚”的空间模式,其中高值区主要分布在除东欧以外的欧洲区域、北美洲、大洋洲和东亚部分国家,低值区主要集中在撒哈拉以南非洲、南亚和西亚地区、以及东南亚部分国家;② 在99%的置信水平上,欧洲和撒哈拉以南非洲分别是全球粮食安全格局的热点和冷点,在非集聚区,海地和朝鲜等国存在长期粮食不安全问题;③ 全球粮食安全格局总体稳定,但极不安全和不安全组的内部变化明显,粮食安全水平波动最大的国家也是粮食最不安全的国家;④ 年平均气温、人均国内生产总值、获得洁净用水的人口占比、政治稳定与无暴力程度是全球粮食安全格局的主要影响因素。研究表明,自2000年以来,全球粮食安全状况有所改善,但2013年出现趋势性逆转。受气候变化、居民购买力、健康卫生水平和政治经济稳定性影响,全球粮食安全始终波动不稳,局部区域目前仍面临突出的粮食安全问题。为此,建议制定基于粮食供给、食物获取、食物利用和政治稳定性四大支柱的粮食安全战略,并通过全球乡村振兴策略来推动粮食安全建设,同时逐步引入城市农业等多元化生产方式,使高度城市化区域建立起更富弹性的食物系统。
马恩朴 , 蔡建明 , 林静 , 郭华 , 韩燕 , 廖柳文 . 2000—2014年全球粮食安全格局的时空演化及影响因素[J]. 地理学报, 2020 , 75(2) : 332 -347 . DOI: 10.11821/dlxb202002009
Food security is the basic foundation in accomplishing of the overall Sustainable Development Goals (SDGs). As the objective in SDGs of "halving the proportion of hungry people by 2015" has not been achieved as scheduled, it will become more challenging to realize its final goal of zero hunger by 2030. So exploring the underlying causes of global food security pattern from perspectives of spatio-temporal evolution is badly needed. In this paper, a comprehensive evaluation method with multi-indices was applied to evaluate the food security level of 172 countries in 2000-2014 based on an established global database with country-specific time series data. Then the spatial pattern and changing characteristics of global food security by country was conducted through the spatial autocorrelation analysis. Upon this basis, the underlying factors affecting the food security pattern were further identified and analyzed with a multiple nonlinear regression method. The findings and results show that: (1) The global food security pattern can be summarized as "high-high and low-low agglomerations" of socio-economic status and food security level. The most food secure countries are mainly distributed in the regions with more advanced economy such as North America, Oceania, parts of East Asia, and Western Europe. On the contrary, the least food secure countries are mainly distributed in sub-Saharan Africa, South Asia, West Asia, and parts of Southeast Asia. (2) At 99% confidence level, Western Europe and sub-Saharan Africa are respectively the hot and cold spots in global food security landscape, while in non-aggregation areas such as Haiti and North Korea, there exist long-term food insecurity problems. (3) The spatio-temporal pattern of global food security is generally stable, but the internal changes in the extremely insecure groups are significant. The countries with the most changeable levels of food security are also the countries with the most food insecurity. (4) Annual mean temperature, per capita GDP, the proportion of people who have access to clean water, and political stability are the key factors affecting the global food security pattern. The study indicates that while the global food security situation has improved since 2000, there was a reverse sign or omen in 2013. Affected by climate change, residents' purchasing power, infrastructure condition, and political and economic stability, global food security has in fact been volatile and some areas in the world are still facing acute food security problems. In addressing this challenge, a food security strategy based on the four dimensions, i.e. food supply, food access, food use and political stability, and a worldwide rural revitalization approach, is highly recommended. Meanwhile, it is necessary to progressively introduce some diversified modes of production such as urban agriculture to build a more resilient food system in those fully urbanized regions.
表1 粮食安全评价指标体系与测量方法Tab. 1 Index system and method for evaluation of food security |
| 一级指标 | 二级指标 | 三级指标 | 指标向性 | 测量方法 |
|---|---|---|---|---|
| 粮食安全 指数 | 粮食供给 | X1:人均粮食产量(kg/人) | +① | X1=粮食总产量/总人口 |
| X2:人均蛋白质供应量(g/人·日) | + | X2=食物蛋白供应量/(总人口×当年天数) | ||
| X3:人均动物源蛋白供应量(g/人·日) | + | X3=动物源蛋白供应量/(总人口×当年天数) | ||
| X4:膳食能量供应充足率(%) | + | X4=每日膳食能量供应大于2320千卡②的 人口数/总人口数 | ||
| 食物获取 | X5:粮食短缺程度(kcal/人·日) | - | X5=2320-营养不良人群的每日人均膳食 能量摄入 | |
| X6:人均国内生产总值 (2011年美元定值) | + | X6=按购买力平价换算的国内生产总值/总 人口 | ||
| 食物利用 | X7:5岁以下矮小儿童占比(%) | - | X7=5岁以下矮小儿童数/5岁以下儿童总数 | |
| X8:5岁以下受浪费影响的儿童占比(%) | - | X8=5岁以下受浪费影响的儿童数/5岁以下 儿童总数 | ||
| X9:获得洁净用水的人口占比(%) | + | X9=获得洁净用水的人口数/总人口 | ||
| 经济与政治稳定性 | X10:人均粮食产量变异性 | - | X10=人均粮食产量的标准差/人均粮食产量 的平均值 | |
| X11:人均粮食供给变异性(kcal/人·日) | - | X11=人均粮食供给的标准差 | ||
| X12:政治稳定与无暴力程度 | + | X12来自世界银行开发的世界治理指标 (WGI)③ |
注:① 指标向性中“+”表示指标取值越大,粮食安全指数越高,“-”表示指标取值越大,粮食安全指数越低;② 2320千卡是按成人等价单位换算的每日膳食能量最低标准;③ 政治稳定与无暴力程度是世界治理指标(WGI)体系的6大指标之一,最早由考夫曼(Kaufmann)等于1999年提出,用于衡量人们对政局稳定、政治暴力和恐怖主义等的感知。 |
表2 粮食安全影响因素的测量方法与数据来源Tab. 2 Methods of measuring factors affecting food security and data sources |
表3 三级指标的权重Tab. 3 Weight of the third tier indicators |
| 二级指标 | 粮食供给 | 食物获取 | 食物利用 | 经济与政治稳定性 | |||||||||||
|---|---|---|---|---|---|---|---|---|---|---|---|---|---|---|---|
| 三级指标代码 | X1 | X2 | X3 | X4 | X5 | X6 | X7 | X8 | X9 | X10 | X11 | X12 | |||
| 权重 | 0.21 | 0.28 | 0.33 | 0.18 | 0.51 | 0.49 | 0.39 | 0.31 | 0.30 | 0.27 | 0.31 | 0.42 | |||
注:三级指标代码的含义详见表1。 |
表4 2000—2014年粮食安全指数的聚类有效性Tab. 4 Classification validity of Food Security Index in 2000-2014 |
| 年份 | 2000 | 2001 | 2002 | 2003 | 2004 | 2005 | 2006 | 2007 | 2008 | 2009 | 2010 | 2011 | 2012 | 2013 | 2014 |
|---|---|---|---|---|---|---|---|---|---|---|---|---|---|---|---|
| Si | 0.69 | 0.67 | 0.67 | 0.66 | 0.67 | 0.67 | 0.67 | 0.64 | 0.66 | 0.63 | 0.63 | 0.63 | 0.62 | 0.65 | 0.63 |
表5 2000—2014年粮食安全指数的Moran's I、z得分与P值Tab. 5 Moran 's I, z score and P value of the food security index in 2000-2014 |
| 年份 | 2000 | 2001 | 2002 | 2003 | 2004 | 2005 | 2006 | 2007 | 2008 | 2009 | 2010 | 2011 | 2012 | 2013 | 2014 |
|---|---|---|---|---|---|---|---|---|---|---|---|---|---|---|---|
| Moran's I | 0.22 | 0.22 | 0.22 | 0.23 | 0.24 | 0.25 | 0.28 | 0.27 | 0.28 | 0.26 | 0.29 | 0.25 | 0.27 | 0.24 | 0.27 |
| z得分 | 14.00 | 13.84 | 13.71 | 14.40 | 15.14 | 15.39 | 17.12 | 16.51 | 17.69 | 16.44 | 18.27 | 15.44 | 16.68 | 15.04 | 17.04 |
| P值 | 0 | 0 | 0 | 0 | 0 | 0 | 0 | 0 | 0 | 0 | 0 | 0 | 0 | 0 | 0 |
表6 各年多元非线性回归方程组Tab. 6 Multiple nonlinear regression equations by years |
| 年份 | 多元非线性回归方程 |
|---|---|
| 2002 | FSI = 0.30+0.27Z43-0.41Z42+0.12Z4-1.20Z82+1.52Z8+1.85Z93-2.83Z92+1.35Z9+0.20Z102+0.02Z10 |
| 2003 | FSI = 0.31-0.06Z4-1.16Z82+1.47Z8+2.04Z93-2.98Z92+1.31Z9+0.19Z102+0.05Z10 |
| 2004 | FSI = 0.28+0.03Z42-0.09Z4+0.25Z83-1.42Z82+1.47Z8+2.19Z93-3.32Z92+1.56Z9+0.11Z103+0.01Z102+0.12Z10 |
| 2005 | FSI = -0.06-0.04Z4-1.01Z82+1.26Z8+3.38Z93-5.54Z92+2.91Z9+0.20Z102+0.27Z10 |
| 2006 | FSI = 0.34-0.13Z33+0.18Z32-0.05Z3-0.11Z4-1.18Z82+1.53Z8+2.65Z93-3.95Z92+1.7Z9+0.26Z103-0.17Z102+0.13Z10 |
| 2007 | FSI = 0.39-0.09Z4-0.35Z63+0.49Z62-0.15Z6-0.96Z82+1.28Z8+2.40Z93-3.51Z92+1.50Z9+0.22Z102-0.01Z10 |
| 2008 | FSI = 0.54-0.14Z4-1.22Z82+1.61Z8+0.30Z92-0.13Z9+0.21Z103-0.08Z102+0.11Z10 |
| 2009 | FSI = 0.39+0.12Z33-0.17Z32+0.06Z3-0.11Z4-0.14Z63+0.20Z62-0.08Z6-1.14Z82+1.47Z8+2.13Z93-3.26Z92+1.46Z9 +0.26Z103-0.11Z102+0.10Z10 |
| 2010 | FSI = 0.38+0.02Z42-0.12Z4+0.82Z63-1.07Z62+0.26Z6-1.18Z82+1.52Z8+2.47Z93-3.79Z92+1.69Z9+0.24Z103-0.14Z102+0.10Z10 |
| 2011 | FSI = -0.02-0.05Z4-3.32Z63+3.91Z62-0.61Z6-1.13Z82+1.45Z8+3.10Z93-5.10Z92+2.62Z9+0.45Z103-0.56Z102+0.47Z10 |
| 2012 | FSI = 0.35-0.06Z4-0.06Z63+0.07Z62-0.01Z6-1.03Z82+1.39Z8+1.96Z93-3.01Z92+1.34Z9+0.33Z103-0.27Z102+0.23Z10 |
| 2013 | FSI = 0.46-0.04Z4+0.32Z83-0.77Z82+0.63Z8+1.69Z93-2.21Z92+0.68Z9+0.29Z103-0.30Z102+0.24Z10 |
| 2014 | FSI = 0.49-0.04Z4+0.97Z83-1.90Z82+1.24Z8+1.33Z93-1.70Z92+0.49Z9+0.29Z102-0.09Z10 |
表7 多元线性与非线性回归方程的检验比较Tab. 7 Comparison of regression test between multiple linear and nonlinear regression equations |
| 方程组类型 | 检验项 | 2002 | 2003 | 2004 | 2005 | 2006 | 2007 | 2008 | 2009 | 2010 | 2011 | 2012 | 2013 | 2014 |
|---|---|---|---|---|---|---|---|---|---|---|---|---|---|---|
| 多元线性回归方程组 | R2 | 0.78 | 0.79 | 0.78 | 0.79 | 0.83 | 0.83 | 0.82 | 0.83 | 0.83 | 0.86 | 0.86 | 0.69 | 0.72 |
| F | 114.45 | 118.01 | 110.6 | 117.77 | 124.08 | 121.3 | 147.35 | 102.51 | 124.83 | 153.29 | 152.71 | 70.32 | 80.87 | |
| 非线性回归方程组 | R2 | 0.83 | 0.83 | 0.82 | 0.82 | 0.88 | 0.84 | 0.85 | 0.86 | 0.86 | 0.85 | 0.87 | 0.72 | 0.77 |
| F | 160.09 | 157.89 | 141.2 | 146.46 | 185.76 | 129.99 | 186.05 | 128.65 | 160.09 | 147.59 | 162.64 | 81.11 | 106.88 |
注:两类方程组的所有Sig.均为0。 |
表8 各因素的影响系数Tab. 8 Influence coefficient of each factor |
| 年份 | 年降水量 | 年平均气温 | 地均化肥施用量 | 人均国内生产总值 | 获得洁净用水 的人口比重 | 政治稳定与 无暴力程度 |
|---|---|---|---|---|---|---|
| 2002 | - | -0.0216 | - | 0.3192 | 0.3720 | 0.2262 |
| 2003 | - | -0.0570 | - | 0.3190 | 0.3780 | 0.243 |
| 2004 | - | -0.0682 | - | 0.2970 | 0.4366 | 0.2436 |
| 2005 | - | -0.0354 | - | 0.2538 | 0.7518 | 0.4713 |
| 2006 | -0.0104 | -0.1104 | - | 0.3472 | 0.3978 | 0.2200 |
| 2007 | - | -0.0924 | -0.0087 | 0.3180 | 0.3885 | 0.2128 |
| 2008 | - | -0.1380 | - | 0.3840 | 0.1689 | 0.2324 |
| 2009 | 0.0048 | -0.1056 | -0.0066 | 0.3245 | 0.3276 | 0.2520 |
| 2010 | - | -0.1005 | 0.0120 | 0.3360 | 0.3630 | 0.1955 |
| 2011 | - | -0.1000 | -0.6400 | 0.8200 | 0.6100 | 0.3600 |
| 2012 | - | -0.0560 | -0.00029 | 0.3540 | 0.2886 | 0.2871 |
| 2013 | - | -0.0380 | - | 0.1850 | 0.1610 | 0.2379 |
| 2014 | - | -0.0378 | - | 0.3120 | 0.1224 | 0.2035 |
注:“-”指影响因素未出现在该年的回归方程中。 |
| [1] |
[ 刘月, 赵文武, 张骁 . 助推2030可持续发展议程环境目标落实: 第二届联合国环境大会会议简述. 生态学报, 2016,36(12):3843-3846.]
|
| [2] |
|
| [3] |
[ 刘源鑫, 赵文武 . 未来地球全球可持续性研究计划. 生态学报, 2013,33(23):7610-7613.]
|
| [4] |
|
| [5] |
[ 刘源鑫, 赵文武, 王军 . 协同应对全球变化,促进可持续发展: “未来地球2025愿景”. 生态学报, 2015,35(7):2414-2417.]
|
| [6] |
Food and Agriculture Organization of the United Nations, United Nations Children's Fund, World Food Programme, et al. The State of Food Security and Nutrition in the World 2017: Enhancing Resilience and Promoting Peace and Food Security. Rome: Food and Agriculture Organization of the United Nations, 2017.
[ 联合国粮食及农业组织, 联合国儿童基金会, 世界粮食计划署, 等. 2017年世界粮食安全和营养状况: 增强抵御能力,促进和平与粮食安全. 罗马: 粮农组织, 2017.]
|
| [7] |
[ 罗孝玲, 张妤, 杨怀东 . 我国粮食安全的界定与评估. 山东农业大学学报, 2006,30(3):14-18.]
|
| [8] |
FAO. The State of Food Insecurity in the World 2001. Rome, Italy: Food and Agriculture Organization, 2002.
|
| [9] |
[ 吴文斌, 唐华俊, 杨鹏 , 等. 基于空间模型的全球粮食安全评价. 地理学报, 2010,65(8):907-918.]
|
| [10] |
[ 安艺明, 赵文武 . 全球气候变化与粮食安全: 2012年Planet Under Pressure国际会议述评. 生态学报, 2012,32(15):4940-4942.]
|
| [11] |
|
| [12] |
|
| [13] |
[ 蒋丽, 徐飞彪 . 气候变化与粮食安全问题研究综述. 国际资料信息, 2011(5):37-42.]
|
| [14] |
|
| [15] |
[ 朱晓禧, 方修琦, 高勇 . 基于系统科学的中国粮食安全评价研究. 中国农业资源与区划, 2012,33(6):11-17.]
|
| [16] |
|
| [17] |
|
| [18] |
|
| [19] |
[ 殷培红, 方修琦 . 中国粮食安全脆弱区的识别及空间分异特征. 地理学报, 2008,63(10):1064-1072.]
|
| [20] |
[ 李忠佩, 李德成, 张桃林 . 土地退化对全球粮食安全的威胁及防治对策. 水土保持通报, 2001,21(4):65-69.]
|
| [21] |
[ 闫慧敏, 刘纪远, 曹明奎 . 中国农田生产力变化的空间格局及地形控制作用. 地理学报, 2007,62(2):171-180.]
|
| [22] |
[ 康绍忠 . 水安全与粮食安全. 中国生态农业学报, 2014,22(8):880-885.]
|
| [23] |
[ 贾慧聪, 王静爱, 潘东华 , 等. 基于EPIC模型的黄淮海夏玉米旱灾风险评价. 地理学报, 2011,66(5):643-652.]
|
| [24] |
IPCC Working Group III. Intergovernmental Panel on Climate Change Special Report on Emissions Scenarios Geneva,Switzerland: Intergovernmental Panel on Climate Change, 2007.
|
| [25] |
[ 巴赫 , 等. 全球气候变化背景下跨界流域水、能源和粮食安全的合作. 水利水电快报, 2016,37(8):1-7.]
|
| [26] |
|
| [27] |
|
/
| 〈 |
|
〉 |