
中国优质基础教育资源空间格局形成机制及综合效应
|
袁振杰(1989-), 男, 广东东莞人, 博士, 副教授, 主要从事社会文化地理学和教育地理学研究。E-mail:zjyuan@gzhu.edu.cn |
收稿日期: 2019-07-29
要求修回日期: 2020-01-13
网络出版日期: 2020-04-25
基金资助
广东省自然科学基金项目(2019A1515012102)
国家自然科学基金项目(41701146)
国家自然科学基金项目(41601133)
国家自然科学基金项目(41971184)
版权
Analysis of the spatial structure, mechanism and social-political effects of the high-quality basic educational resources in China
Received date: 2019-07-29
Request revised date: 2020-01-13
Online published: 2020-04-25
Supported by
Natural Science Foundation of Guangdong Province, China(2019A1515012102)
National Natural Science Foundation of China(41701146)
National Natural Science Foundation of China(41601133)
National Natural Science Foundation of China(41971184)
Copyright
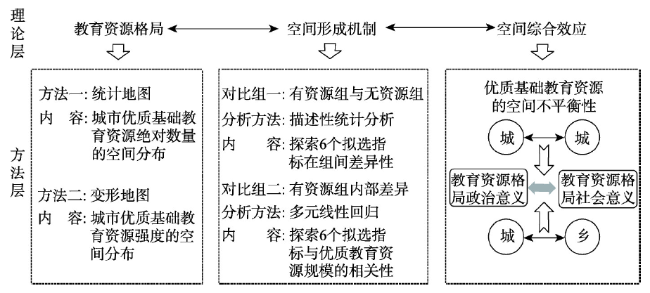
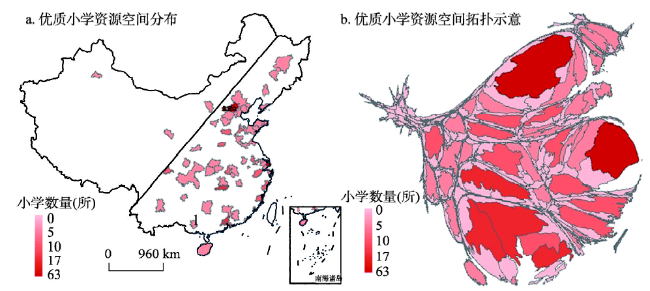
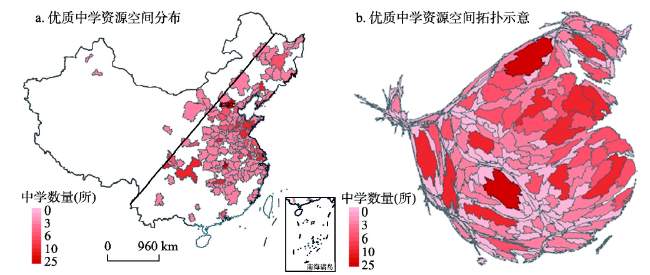
教育关乎一个国家人口素质的提升和综合实力的发展,也是塑造国家和地区人地关系的重要因素。通过回顾并反思中西方人文地理学视角下的教育资源配置研究,总结当前中国相关研究的不足。借鉴当前西方教育资源空间格局研究中所采取的“资源格局—影响机制—社会效应”的主流路径,本文利用多种空间分析和机制研究方法,对中国优质基础教育资源空间格局、形成机制和综合效应进行了分析。研究发现:① 优质小学基础教育资源和优质中学教育资源的区域格局和强度虽各有差异,但都体现出不平衡的发展特征,特别是在区域尺度上,体现出明显的东西部差异。此外,中国几大城市群,如京津冀,沪宁杭,珠三角,武汉都市圈以及成渝都市圈等,是优质基础教育资源的优势区域;② 优质小学教育资源的形成和规模增长与城市居民经济自由度以及城市专任教师规模两个因素高度相关;优质中学教育资源的形成和规模增长和城市本底经济社会发展水平因素高度相关;③ 在多元相关机制作用下,中国优质教育资源空间结构在当下及未来必定处于复杂动态变化之中,并将更为深刻地塑造着城市与城市、城市与社会之间的互动关系。本文有助于理解中国优质教育资源空间结构不平衡的现状,同时反思和探索教育资源结构所蕴含和产生的政治意义和社会影响。
袁振杰 , 郭隽万果 , 杨韵莹 , 朱竑 . 中国优质基础教育资源空间格局形成机制及综合效应[J]. 地理学报, 2020 , 75(2) : 318 -331 . DOI: 10.11821/dlxb202002008
Education is not only important for strengthening a country's population quality and comprehensive power but key in reshaping the "man-land" relations in a country. This article reviews studies on the distribution of educational resources in both Chinese and Anglophone literature and summarizes the research gaps in the Chinese literature, which include but are not limited to the downplay of the analysis of mechanism and comprehensive effects of the spatial structure of educational resources. Employing different map-making technologies and mechanism-analysis methods, this article dives into three findings. First, though spatial features are slightly different between primary school level and middle school level, eastern regions generally have higher quality educational resources than western regions. In addition, urban agglomeration, including Beijing-Tianjin-Hebei, Shanghai-Ningbo-Hangzhou, and the Pearl River Delta, have an advantage in attracting and cultivating high-quality educational resources. Second, the quantity of high-quality primary school resources is positively correlated with annual per capita disposable income of urban households and number of full-time primary school teachers. The quantity of high-quality middle school resources is positively correlated with the comprehensive economic and social performance of the city. Third, when affected by multiple mechanisms, the spatial structure of China's high-quality educational resources is dynamic and deeply intertwines with the interrelations between cities as well as between the societies within each city. This article contributes both to the understanding of the unequal spatial structure of high-quality educational resources in China and to the analysis of complex socio-political effects on this transforming structure. Its findings encourage further research on the connection between the spatial structure of a region's educational resources and its cooperation and geopolitics as well as on the resulting social mobility among different social strata. Study limitations include: place-related elements, such as local political resources, were not sufficiently considered when selecting factors; there is a lack of longitudinal analysis; and not enough attention is paid to the combination of number-based data and geo-information-based data in analyses.
表1 2018年中国优质中、小教育资源的总规模及区域强度排序Tab. 1 High-quality middle and primary school resources in China in 2018 |
| 序号 | 优质小学教育资源 的绝对规模强度 | 优质小学教育 资源的区域强度* | 区域 强度值 | 优质中学教育资源的绝对规模强度 | 优质中学教育 资源的区域强度* | 区域 强度值 |
|---|---|---|---|---|---|---|
| 1 | 北京市 | 上海市 | 95.03 | 北京市 | 无锡市 | 30.87 |
| 2 | 上海市 | 佛山市 | 73.75 | 武汉市 | 武汉市 | 25.06 |
| 3 | 广州市 | 深圳市 | 73.02 | 临沂市 | 苏州市 | 20.74 |
| 4 | 长沙市 | 东莞市 | 65.78 | 成都市 | 莱芜市 | 20.15 |
| 5 | 佛山市 | 广州市 | 64.43 | 潍坊市 | 北京市 | 19.19 |
| 6 | 武汉市 | 北京市 | 52.34 | 苏州市 | 镇江市 | 19.14 |
| 7 | 苏州市 | 嘉兴市 | 37.33 | 保定市 | 泰州市 | 18.81 |
| 8 | 福州市 | 长沙市 | 23.75 | 泰安市 | 泰安市 | 18.17 |
| 9 | 温州市 | 苏州市 | 23.72 | 沈阳市 | 常州市 | 17.46 |
| 10 | 天津市 | 武汉市 | 23.39 | 济南市 | 南京市 | 17.15 |
注:优质教育资源的区域强度表示地图变形比值,即区域强度值=变形后区域面积/变形前区域面积;地图变形比值越高表示区域内的优质教育资源配置的优势和强度也越大。 |
表2 2018年中国地级市优质中、小教育资源空间分布差异性Tab. 2 Spatial analysis of China's high-quality middle and primary school resources at the municipal administrative level in 2018 |
| 教育阶段 | 变形后各地级市 图显面积方差 | 变形前各地级市 图显面积方差 | 前后方差比值 |
|---|---|---|---|
| 小学阶段 | 0.0155 | 0.0014 | 11.07 |
| 中学阶段 | 0.0047 | 0.0014 | 3.36 |
表3 具有与不具有优质教育资源城市组的对比分析Tab. 3 Groups of cities with/without high-quality educational resources |
| 变量 | 小学阶段 | 中学阶段 | |||||
|---|---|---|---|---|---|---|---|
| “有”组 | “无”组 | 比值 | “有”组 | “无”组 | 比值 | ||
| (城市人口规模/万人) | 659.25 | 354.17 | 1.86 | 542.21 | 293.82 | 1.85 | |
| (城镇化水平/%) | 69.24 | 52.69 | 1.63 | 61.55 | 50.66 | 1.22 | |
| (城市人均国内生产总值/万元) | 94507.98 | 58025.35 | 1.49 | 78960.71 | 52294.76 | 1.51 | |
| (城市全体居民可支配收入/元) | 35787.62 | 24039.08 | 3.37 | 30034.71 | 22881.20 | 1.31 | |
| (城市基础教育经费投入/元) | 1665292.00 | 494263.00 | 1.31 | 1051523.74 | 420268.34 | 2.50 | |
| (城市专任教师数量/人) | 28260.61 | 14182.03 | 1.99 | 21016.61 | 11573.01 | 1.82 | |
表4 多元线性回归分析结果Tab. 4 Results of multiple linear regression analysis |
| 变量 | 小学阶段 | 中学阶段 | |||
|---|---|---|---|---|---|
| 系数 | 显著性 | 系数 | 显著性 | ||
| (城市人口规模) | - | - | - | - | |
| (城镇化水平) | - | - | - | - | |
| (城市人均国内生产总值) | - | - | 0.245 | 0.000 | |
| (城市全体居民可支配收入) | 0.548 | 0.000 | - | - | |
| (城市基础教育经费投入) | - | - | 0.311 | 0.002 | |
| (城市专任教师数量) | 0.374 | 0.000 | 0.312 | 0.001 | |
| 0.718 | 0.690 | ||||
| [1] |
|
| [2] |
|
| [3] |
|
| [4] |
|
| [5] |
|
| [6] |
|
| [7] |
|
| [8] |
|
| [9] |
|
| [10] |
|
| [11] |
|
| [12] |
|
| [13] |
|
| [14] |
|
| [15] |
|
| [16] |
|
| [17] |
|
| [18] |
|
| [19] |
|
| [20] |
|
| [21] |
|
| [22] |
|
| [23] |
|
| [24] |
[ 沈有禄 . 基础教育资源配置公平研究. 教育学术月刊, 2009(12):16-21.]
|
| [25] |
[ 刘宏燕, 陈雯 . 中国基础教育资源布局研究述评. 地理科学进展, 2017,36(5):557-568.]
|
| [26] |
[ 刘天宝, 郑莉文, 杜鹏 . 市域义务教育资源均衡水平的空间特征与分布模式: 以大连市小学为例. 经济地理, 2018,38(7):67-74.]
|
| [27] |
[ 涂唐奇, 闫东升, 陈江龙 , 等. 南京城市义务教育设施空间演化. 地理科学, 2019,39(3):433-441.]
|
| [28] |
[ 吴磊, 焦华富, 叶雷 , 等. 中国省际教育城镇化的时空特征及影响因素. 地理科学, 2018,38(1):58-66.]
|
| [29] |
[ 于洋, 韩增林, 彭飞 , 等. 辽宁省义务教育资源配置差异的时空演变分析. 地域研究与开发, 2016,35(6):21-26.]
|
| [30] |
[ 赵林, 吴殿廷, 王志慧 , 等. 中国农村基础教育资源配置的时空格局与影响因素. 经济地理, 2018,38(11):39-49.]
|
| [31] |
[ 赵晨旭, 邵景安, 郭跃 , 等. 山区乡村学校空间格局演变特征及发展水平. 地理研究, 2016,35(3):455-470.]
|
| [32] |
[ 彭永明, 王铮 . 农村中小学选址的空间运筹. 地理学报, 2013,68(10):1411-1417.]
|
| [33] |
[ 苏飞, 莫潇杭, 魏敏 , 等. 中国普通高中教育均等化及障碍因素分析. 地理科学, 2017,37(10):1478-1485.]
|
| [34] |
[ 汪凡, 白永平, 周亮 , 等. 中国基础教育公共服务均等化空间格局及其影响因素. 地理研究, 2019,38(2):285-296.]
|
| [35] |
[ 戴特奇, 廖聪, 胡科 , 等. 公平导向的学校分配空间优化: 以北京石景山区为例. 地理学报, 2017,72(8):1476-1485.]
|
| [36] |
[ 戴特奇, 王梁, 张宇超 , 等. 农村学校撤并后规模约束对学校优化布局的影响: 以北京延庆区为例. 地理科学进展, 2016,35(11):1352-1359.]
|
| [37] |
[ 杨慧敏, 张香玲, 李立 , 等. 山区贫困县中小学空间格局变化与可达性分析: 以河南省嵩县为例. 地理科学进展, 2018,37(4):556-566.]
|
| [38] |
[ 汤鹏飞, 向京京, 罗静 , 等. 基于改进潜能模型的县域小学空间可达性研究: 以湖北省仙桃市为例. 地理科学进展, 2017,36(6):697-708.]
|
| [39] |
[ 陆梦秋 . 撤点并校背景下农村义务教育服务半径分析. 经济地理, 2016,36(1):143-147.]
|
| [40] |
[ 袁振国 . 促进教育公平: 发展是前提, 改革是动力. 探索与争鸣, 2015(5):10-12.]
|
| [41] |
[ 高培超, 刘钊, 谢美慧 , 等. Cartogram属性地图: 理论概述与研究展望. 测绘与空间地理信息, 2016,39(6):211-215.]
|
| [42] |
[ 陈谊, 赵云芳, 杜晓敏 . 变形统计地图构建方法综述. 系统仿真学报, 2016,28(9):1970-1978.]
|
| [43] |
[ 王丽娜, 江南, 李响 , 等. Cartogram表示方法研究综述. 计算机辅助设计与图形学学报, 2017(3):393-405.]
|
| [44] |
[ 游小珺, 赵光龙, 杜德斌 , 等. 中国高等教育经费投入空间格局及形成机理研究. 地理科学, 2016,36(2):180-187.]
|
| [45] |
|
| [46] |
[ 汪凡, 白永平, 周亮 , 等. 中国基础教育公共服务均等化空间格局及其影响因素. 地理研究, 2019,38(2):285-296.]
|
| [47] |
[ 喻立森 . 城市教育竞争力是撬起城市综合竞争力的重要杠杆: 兼评《中国城市教育竞争力比较——探寻宁波方位》. 城市建设, 2010(30):17-18.]
|
| [48] |
[ 高书国 . 我国四大城市群教育综合竞争力与教育合作区的战略构想. 教育发展研究, 2006,26(1):23-27.]
|
| [49] |
[ 周志忍, 陈家浩 . 政府转型与制度构建: 中国教育资源配置的政治分析. 行政论坛, 2010,17(4):1-7.]
|
| [50] |
[ 阎凤桥 . 国外基础教育管理及财政体制改革. 比较教育研究, 2007,28(11):32-38.]
|
| [51] |
[ 毛丰付, 罗刚飞, 潘加顺 . 优质教育资源对杭州学区房价格影响研究. 城市与环境研究, 2014(2):53-64.]
|
| [52] |
[ 高雪莲 . 区隔的童年: 城市儿童与乡村流动儿童的课余世界. 北京社会科学, 2017(9):24-33.]
|
/
| 〈 |
|
〉 |