
青藏高原人口地域分异规律及“胡焕庸线”思想应用
|
戚伟(1989-), 男, 江苏泰州人, 副研究员, 中国地理学会会员(S110007891A), 主要从事城市地理与人口地理研究。E-mail:qiwei@igsnrr.ac.cn |
收稿日期: 2019-04-03
要求修回日期: 2019-12-31
网络出版日期: 2020-04-25
基金资助
中国科学院A类战略性先导科技专项(XDA20040401)
国家自然科学基金项目(41701165)
版权
Regional differentiation of population in Tibetan Plateau: Insight from the "Hu Line"
Received date: 2019-04-03
Request revised date: 2019-12-31
Online published: 2020-04-25
Supported by
Strategic Priority Research Program of Chinese Academy of Sciences(XDA20040401)
National Natural Science Foundation of China(41701165)
Copyright
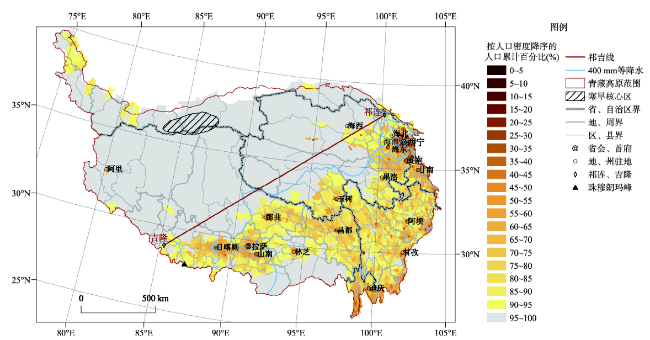
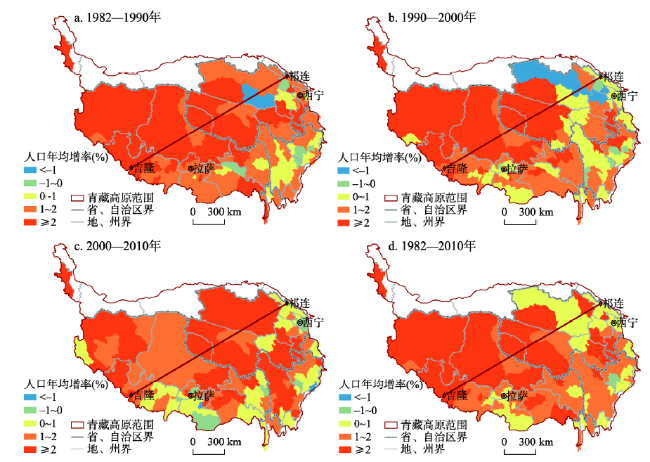
青藏高原是中国乃至全球典型的人口稀疏区之一,但内部人口地域分异明显。通过构建青藏高原乡镇街道尺度的人口空间数据集,系统核算青藏高原人口数量及其空间密度,从经度、纬度、极向和垂直4个维度解析青藏高原人口地域分异规律,并基于“胡焕庸线”思想,提出青藏高原的“祁吉线”人口地理划分方案。结论包括:① 青藏高原人口空间分布不均衡,具有“东南密、西北疏”的总体空间分布特征,距离“寒旱核心区”近疏远密的极向地域分异明显;② 青藏高原人口地域分异与海拔、土壤、水资源、气候、植被等自然环境本底具有高度耦合关系,自然因素间交互作用加强了人口地域分异;③ 青藏高原人口地域分异可以通过连接祁连县与吉隆县的“祁吉线”体现,两侧地域面积大致相同,但是东南半壁与西北半壁人口比例达到93∶7的悬殊;④ “祁吉线”长期稳定,但是东南半壁人口持续微降,西北半壁人口持续微增,未来时期,东南半壁依然是青藏高原城镇化及人类活动的主要区域,而西北半壁应当重视人口增长与生态环境压力的矛盾。
戚伟 , 刘盛和 , 周亮 . 青藏高原人口地域分异规律及“胡焕庸线”思想应用[J]. 地理学报, 2020 , 75(2) : 255 -267 . DOI: 10.11821/dlxb202002004
The Tibetan Plateau is regarded as a typically sparsely populated area both from Chinese and global perspectives. There exists a large difference in population distribution of the Tibetan Plateau. Based on the town-level census data in 2010, we compiled a spatial population database to calculate the population density of the Tibetan Plateau. We found that the population distribution on this plateau was characterized in four dimensions, namely longitude, latitude, polarization and altitude. In addition, similar to the "Hu Line" for Chinese population distribution, we introduce the "Qilian-Gyirong Line" (short for Qi-Ji Line), a spatial division line of population geography in the Tibetan Plateau. Our main results are summarized as follows. (1) There are significant regional differences in the spatial population distribution in the Tibetan Plateau. The population density in the southeast was higher than that in the northwest. Compared to longitude-oriented, latitude-oriented and altitude-oriented regional differences, the polarization-oriented regional difference of population distribution was more prominent. This finding indicates that fewer people live in areas close to the cold-arid core of the Tibetan Plateau. (2) The spatial population distribution is closely related to the natural and environmental factors, including altitude, soil, water resources, climate and vegetation. The interaction between the natural factors has an impact on enhancing the regional difference of population. (3) The "Qiji Line" reveals the spatial differences of population in the Tibetan Plateau. The areas on either side of the line are approximately similar, whereas the population shares in the southeast and northwest halves are 93% and 7%, respectively. (4) In general, the population differences on both sides of the "Qiji Line" were stable over time. During 1982-2010 the population share in the southeast half decreased counterbalanced by an increased share in the northeast half. In the future, the majority of the people are expected to live on the southeast side. This is likely to imply two major policy initiatives. More attention is required on the urbanization development and transportation network construction in the southeast half and the increasing eco-environmental pressures from the growing population in the northwest half.
表1 2010年青藏高原分乡镇街道分级人口及面积统计Tab. 1 Population and area statistics based on town-level hierarchies in Tibetan Plateau in 2010 |
| 人口累计百分比 分级值域(%) | 对应人口密度分 级值域(人/km2) | 乡镇街道 数量(个) | 人口总数 (万人) | 人口累计 百分比(%) | 地域面积 (km2) | 面积累计 百分比(%) |
|---|---|---|---|---|---|---|
| 0~10 | 53804~2419 | 35 | 119.02 | 9.60 | 141.51 | 0.01 |
| 10~20 | 2063~375 | 36 | 126.69 | 19.82 | 1822.94 | 0.08 |
| 20~30 | 358~143 | 60 | 126.18 | 30.00 | 5487.38 | 0.29 |
| 30~40 | 142~65 | 85 | 119.94 | 39.67 | 12783.35 | 0.78 |
| 40~50 | 64~31 | 149 | 125.31 | 49.78 | 29551.04 | 1.91 |
| 50~60 | 31~16 | 195 | 126.48 | 59.98 | 56302.22 | 4.08 |
| 60~70 | 16~9 | 275 | 136.40 | 70.98 | 118059.57 | 8.62 |
| 70~80 | 9~6 | 271 | 111.57 | 79.98 | 158700.70 | 14.72 |
| 80~90 | 6~3 | 352 | 123.86 | 89.97 | 306130.03 | 26.49 |
| 90~100 | 3~0 | 447 | 124.30 | 100.00 | 1911686.74 | 100.00 |
表2 青藏高原人口地域分异地理探测分析Tab. 2 The geo-detector results of regional differences of population in Tibetan Plateau |
| 因子 | 因子作用 (q值) | 交互作用 | |||||
|---|---|---|---|---|---|---|---|
| 海拔 | 年均降水 | 年均气温 | NPP | 土壤类型 | 产水模数 | ||
| 海拔 | 0.32*** | ||||||
| 年均降水 | 0.08*** | 0.55++ | |||||
| 年均气温 | 0.08*** | 0.47++ | 0.25++ | ||||
| NPP | 0.05*** | 0.64++ | 0.18++ | 0.24++ | |||
| 土壤类型 | 0.37*** | 0.58+ | 0.52++ | 0.48++ | 0.47++ | ||
| 产水模数 | 0.16*** | 0.55++ | 0.29++ | 0.39++ | 0.31++ | 0.49+ | |
注:***代表在p < 0.01显著;++代表非线性增强;+代表双因子增强。 |
表3 基于乡镇街道单元的2010年“祁吉线”两侧人口和面积统计Tab. 3 Population and area statistics on both sides of the "Qilian-Gyirong Line" based on town-level units |
| “祁吉线” 半壁 | 常住人口 | 地域面积 | 人口密度 (人/km2) | |||
|---|---|---|---|---|---|---|
| 数量(万人) | 占比(%) | 数量(km2) | 占比(%) | |||
| 东南半壁 | 1149.75 | 92.74 | 1223069 | 47.03 | 9.40 | |
| 西北半壁 | 90.01 | 7.26 | 1377596 | 52.97 | 0.65 | |
表4 基于县市单元的1982—2010年“祁吉线”两侧人口和面积统计Tab. 4 Population and area statistics on both sides of the "Qilian-Gyirong Line" cbased on county-level units |
| 年份 | 常住人口(万人) | 常住人口占比(%) | 人口密度(人/km2) | |||||
|---|---|---|---|---|---|---|---|---|
| 东南半壁 | 西北半壁 | 东南半壁 | 西北半壁 | 东南半壁 | 西北半壁 | |||
| 1982年 | 779.94 | 33.35 | 95.72 | 4.28 | 3.50 | 0.37 | ||
| 1990年 | 890.78 | 41.74 | 95.31 | 4.69 | 4.00 | 0.47 | ||
| 2000年 | 996.59 | 51.31 | 94.85 | 5.15 | 4.48 | 0.58 | ||
| 2010年 | 1147.35 | 64.73 | 94.36 | 5.64 | 5.16 | 0.73 | ||
| [1] |
[ 成升魁, 沈镭 . 青藏高原人口、资源、环境与发展互动关系探讨. 自然资源学报, 2000,15(4):297-304.]
|
| [2] |
|
| [3] |
|
| [4] |
[ 郑度 . 青藏高原对中国西部自然环境地域分异的效应. 第四纪研究, 2001,21(6):484-489.]
|
| [5] |
[ 郑度, 赵东升 . 青藏高原高寒荒漠地带与寒冷干旱核心区域. 干旱区研究, 2019,36(1):1-6.]
|
| [6] |
[ 李渤生 . 南迦巴瓦峰地区植被水平地带. 山地研究, 1985,3(4):291-298.]
|
| [7] |
[ 张镱锂, 张玮, 摆万奇 , 等. 青藏高原统计数据分析: 以人口为例. 地理科学进展, 2005,24(1):11-20.]
|
| [8] |
|
| [9] |
[ 廖顺宝, 孙九林 . 青藏高原人口分布与环境关系的定量研究. 中国人口·资源与环境, 2003,13(3):65-70.]
|
| [10] |
[ 戚伟, 刘盛和, 赵美风 . “胡焕庸线”的稳定性及其两侧人口集疏模式差异. 地理学报, 2015,70(4):551-566.]
|
| [11] |
[ 杨强, 李丽, 王运动 , 等. 1935—2010年中国人口分布空间格局及其演变特征. 地理研究, 2016,35(8):1547-1560.]
|
| [12] |
[ 李佳洺, 陆大道, 徐成东 , 等. 胡焕庸线两侧人口的空间分异性及其变化. 地理学报, 2017,72(1):148-160.]
|
| [13] |
[ 李建新, 杨珏 . “胡焕庸线”以西的西部人口格局. 西北民族研究, 2018(1):191-202.]
|
| [14] |
[ 高向东, 王新贤, 朱蓓倩 . 基于“胡焕庸线”的中国少数民族人口分布及其变动. 人口研究, 2016,40(3):3-17.]
|
| [15] |
[ 樊杰, 王海 . 西藏人口发展的空间解析与可持续城镇化探讨. 地理科学, 2005,25(4):385-392.]
|
| [16] |
[ 刘成明 . 青海人口分布格局及变迁. 青海社会科学, 2004(3):41-46.]
|
| [17] |
[ 柏中强, 王卷乐, 杨雅萍 , 等. 基于乡镇尺度的中国25省区人口分布特征及影响因素. 地理学报, 2015,70(8):1229-1242.]
|
| [18] |
[ 张镱锂, 李炳元, 郑度 . 《论青藏高原范围与面积》一文数据的发表: 青藏高原范围界线与面积地理信息系统数据. 地理学报, 2014,69(增刊):65-68.]
|
| [19] |
[ 方瑜, 欧阳志云, 郑华 , 等. 中国人口分布的自然成因. 应用生态学报, 2012,23(12):3488-3495.]
|
| [20] |
[ 王劲峰, 徐成东 . 地理探测器: 原理与展望. 地理学报, 2017,72(1):116-134.]
|
| [21] |
[ 吕晨, 蓝修婷, 孙威 . 地理探测器方法下北京市人口空间格局变化与自然因素的关系研究. 自然资源学报, 2017,32(8):1385-1397.]
|
| [22] |
[ 张镱锂, 李炳元, 郑度 . 论青藏高原范围与面积. 地理研究, 2002,21(1):1-8.]
|
| [23] |
[ 莫申国, 张百平, 程维明 , 等. 青藏高原的主要环境效应. 地理科学进展, 2004,23(2):88-96.]
|
| [24] |
[ 胡焕庸 . 中国人口的分布、区划和展望. 地理学报, 1990,45(2):139-145.]
|
/
| 〈 |
|
〉 |
