
中国人口疏密区分界线的历史变迁及数学拟合与地理意义
|
龚胜生(1965-), 男, 湖南涟源人, 博士, 教授, 博士生导师, 中国地理学会会员(S110001186M), 主要从事历史地理学、医学地理学、可持续发展研究。E-mail: shshgong@mail.ccnu.edu.cn |
收稿日期: 2018-09-14
要求修回日期: 2019-06-26
网络出版日期: 2019-10-29
基金资助
国家自然科学基金项目(No.41171408)
国家社会科学基金项目(No.11AZD117)
国家社会科学基金项目(No.12&ZD145)
版权
The historical change, mathematical fitting and geographical significance of demographic borderlines in China
Received date: 2018-09-14
Request revised date: 2019-06-26
Online published: 2019-10-29
Supported by
National Natural Science Foundation of China(No.41171408)
National Social Science Foundation of China(No.11AZD117)
National Social Science Foundation of China(No.12&ZD145)
Copyright
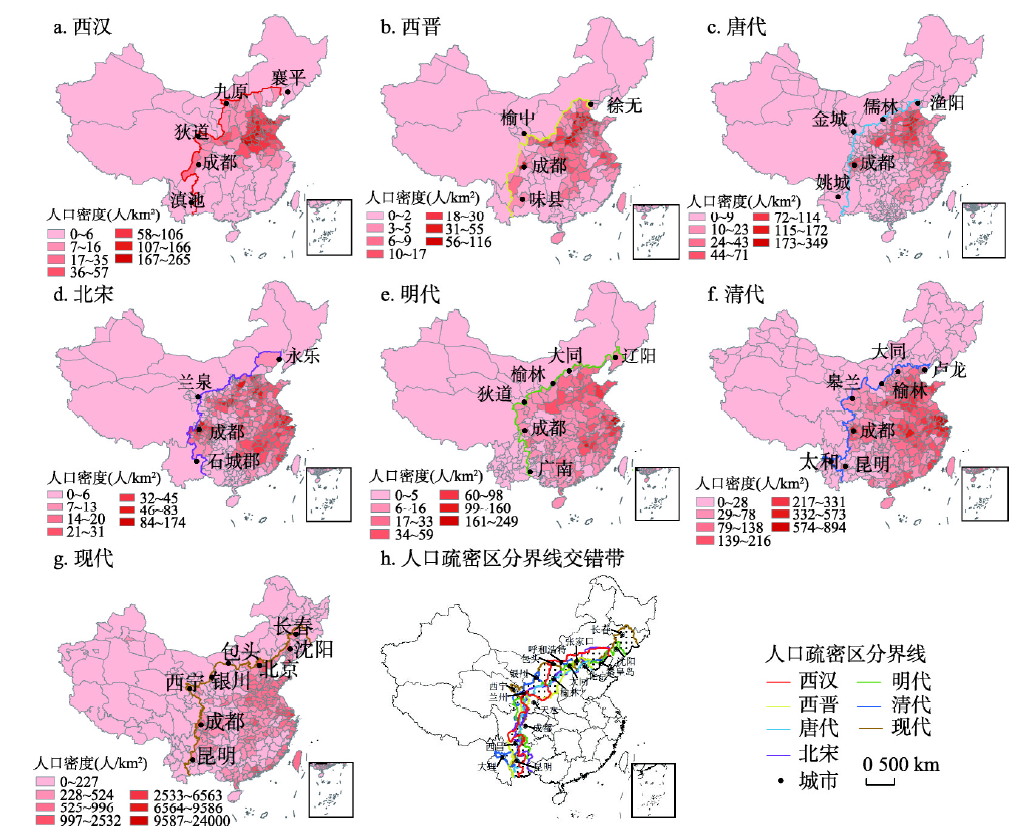
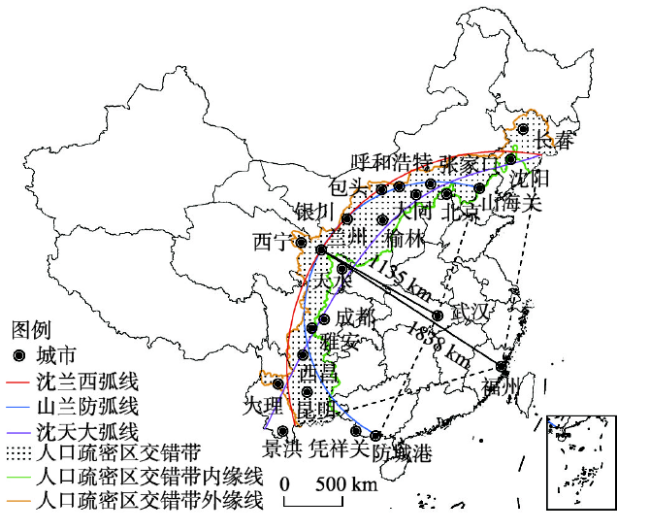
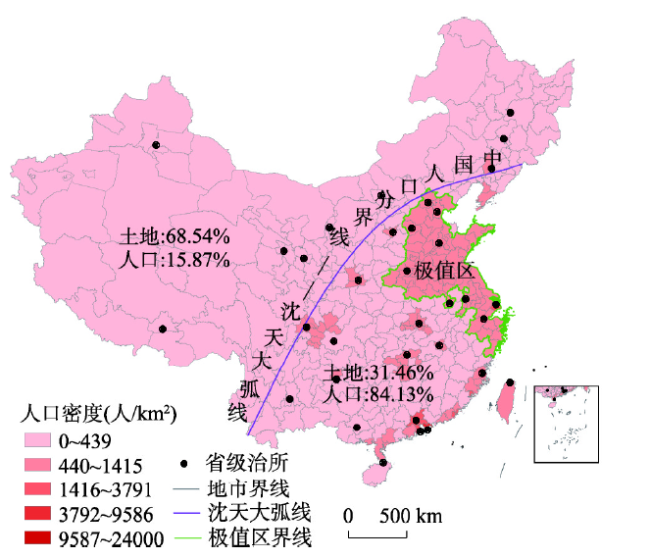
采用历史时间断面方法和现代空间分析方法,对中国西汉、西晋、唐代、北宋、明代、清代、现代7个时间断面的人口分布进行分析。结果发现:① 中国人口疏密区的分界线就是中国农牧区的分界线,中国人口分布的大格局由中国农耕区和畜牧区的空间分异奠定,理论上中国人口疏密区分界线就是中国农牧交错带的拟合线。② 两千多年的历史证明,中国农牧交错带是一个弧状地带,不能用直线拟合,只能用弧线拟合;“沈天大弧线”(沈阳—天水—大理弧线)是该交错带的函数拟合线,“山兰防弧线”(山海关—兰州—防城港弧线)是该交错带的内缘拟合线,也是中原王朝衰弱时期的农牧分界线;“沈兰西弧线”(沈阳—兰州—西双版纳弧线)是该交错带的外缘拟合线,也是中原王朝强盛时期的农牧分界线;直线的“爱辉—腾冲线”理论上不能拟合弧状的中国农牧交错带,但因为它碰巧是中国农牧交错带的函数拟合线的切线,因而也能较好地刻画中国人口的宏观分异格局。③ 中国人口疏密区分界线有着丰富的地理学意义:一是分界线本身就是农牧业分界线;二是分界线与海岸线围成的区域是中国的“国家核心区”;三是分界线最大限度地刻画了中国东南和西北的自然地理和人文地理的分异。
龚胜生 , 陈云 . 中国人口疏密区分界线的历史变迁及数学拟合与地理意义[J]. 地理学报, 2019 , 74(10) : 2147 -2162 . DOI: 10.11821/dlxb201910014
By the methods of historical temporal section and modern spatial analysis, this paper analyzes the change of population distribution in China since the past 2000 years ago, such as the Western Han Dynasty (the representative year A.D. 2), the Western Jin Dynasty (A.D. 280), the Tang Dynasty (A.D. 742), the Northern Song Dynasty (A.D. 1102), the Ming Dynasty (A.D. 1460), the Qing Dynasty (A.D. 1820), and the present (A.D. 2010). It is found that China demographic borderlines dividing sparsely and densely populated areas are the borderlines which divide farming and pastoral areas, and the pattern of China's population distribution depends on the spatial differentiation of China's farming and pastoral areas. Therefore, theoretically the fitting curve of sparse-dense borderlines of China's population distribution in various times can be seen as the fitting curve of the farming-pastoral ecotone. The history has proved that China's farming-pastoral ecotone is an arc-shaped belt, so it can not be fitted by straight line but by arc-curve. Shenyang-Tianshui-Dali Arc is a function fitting line of the ecotone; Shanhaiguan-Lanzhou-Fangchenggang Arc is a fitting of the inner edge curve of the ecotone, which is a farming-pastoral borderline when the empire's rule was not so strong; Shenyang-Lanzhou-Xishuangbanna Arc is a fitting of the outer edge curve of the ecotone, which is another farming-pastoral borderline when the empire’s rule was very strong. As for Aihui-Tengchong Line, theoretically, it cannot fit the arc-shaped farming-pastoral ecotone, but coincidentally, because of being the tangent of Shenyang-Tianshui-Dali Arc, it can also depict the macro pattern of China's population distribution. China's demographic borderline dividing sparsely and densely populated areas is of geographical significance: first, the line is an farming-pastoral borderline of historical China; second, it, along with the coastline, encircles the "National Core Area" of China, in term of political geography; third, it, to the greatest extent, distinguishes the natural and human geographical differences existing in the northwestern and southeastern China.
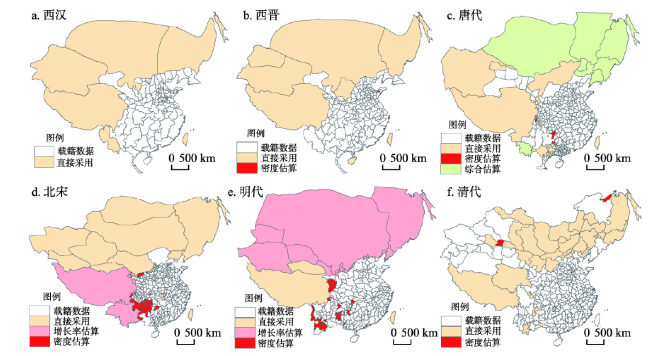
图1 中国历史版图及其人口估算Fig. 1 China's historical territory and population estimation methods in various missing-recorded areas |
表1 中国历史时期各时间断面失载区域人口的估算Tab. 1 The estimated population of the missing-recorded regions in China's historical periods |
| 时期 | 估算 方法 | 失载区块(个) | 估计人口 (万) | 估算依据 |
|---|---|---|---|---|
| 西汉 (2年) | 直接采用 | 6 | 167 | 哀牢5万[17, 20],匈奴23万[12, 23],唐旄、发羌30万[12],鲜卑、扶余、肃慎55万[17, 20],西域都护府51万[12],台湾3万[20, 24] |
| 西晋 (280年) | 直接采用 | 8 | 554 | 夫余、高句丽74万,羌胡、西部鲜卑20万,羌250万,乌孙65万,西域长史府65万,鲜卑60万,夷洲10万,朱崖10万[25] |
| 密度估算 | 1 | 2 | 北海郡2.38万 | |
| 唐代 (742年) | 直接采用 | 20 | 573 | 平琴州0.40万,汤州0.52万,山州0.52万,陆州0.27万,冈州3.34万,郁林州9.07万,安南、和蛮部9.07万,邕州0.73万,桂州所领2.60万,荣州1.65万,沔州3.8万,奉州0.16万,济州21.70万,仪州5.03万,庭州0.97万[26],安西都护府60万,琉球10万[25],吐蕃400万[18],单于都护府40万[27],兰州2.85万[13] |
| 综合估算 | 8 | 400 | 突厥160万[18, 27],黑水都护府30万,松漠都督府30万,霫20万,金齿部、望部等40万,室韦都督府30万,安东都督府30万,渤海都督府60万[25] | |
| 密度估算 | 8 | 38 | 罗伏州0.19万,唐林州0.40万,环州0.19万,矩州0.07万,应州0.61万,充州1.13万,蓬鲁、姜、恕、葛、勿、占、达、浪等州30.94万,胡逗洲4.39万 | |
| 北宋 (1102年) | 直接采用 | 19 | 814 | 东京道117万,中京道94万,江陵府22.33万,丹州3.58万,绥德军2.49万,晋宁军3.42万,永宁军6.32万,滦州4.93万,西夏300万[14],上京道16.72万,辖戛斯、斡郎改5.82万,流求10万,汉阳军3.05万,荆门军23.76万,黄头回纥18万,西州回鹘90万,于阗40.46万,黑汗51.81万[20],定边军0.24[28] |
| 增长率估算 | 8 | 311 | 大理280万,复州9.91万,洮州0.28万,廓州0.04万,积石军0.15万,西宁州0.07万,湟州0.21万,吐蕃诸部20万[19] | |
| 密度估算 | 24 | 229 | 怀德军3.70万,西安州5.18万,会州3.09万,武冈军22.18万,永康军13.75万,西山野川诸部36.30万,两林部、虚恨部、邛部19.55万,祥州1.06万,石门蕃部45.67万,罗氏29.46万,纯州1.25万,滋州3.75万,田氏9.05万,珍州2.28万,承州2.36万,南平军1.98万,溱州1.10万,播州1.45万,遵义军1.21万,黔州所领诸羁縻州19.24万,罗殿2.27万,观州3.06万,自杞0.24万,特磨道0.36万 | |
| 明代 (1460年) | 直接采用 | 3 | 90 | 乌思藏宣慰司69.18万,鞑靼土默特部10.82万,东番10万[18] |
| 增长率估算 | 13 | 343 | 鞑靼、瓦剌58.04万,吐鲁番8.49万,叶尔羌22.05万,亦力把里8.80万,万全都司26.67万,女真70.90万,辽东都司71.90万,靖虏卫5.60万,宁夏中卫3.16万,宁夏后卫1.35万,榆林卫24.93万,宁夏卫7.97万,陕西行都司33.71万[15] | |
| 密度估算 | 37 | 82 | 永宁宣抚司4.50万,黎州安抚司0.71万,天全六番招讨司0.96万,叠溪所0.69万,松潘卫22.26万,岷州卫8.69万,洮州卫11.54万,孟琏司1.15万,钮兀司0.21万,车里宣慰司1.50万,威远州0.41万,者乐甸司0.03万,勐缅司0.34万,新化州0.10万,镇康州0.27万,陇川宣抚司0.13万,芒市司0.03万,湾甸州0.08万,大侯州0.19万,干崖宣抚司0.08万,南甸宣府0.14万,里麻司0.28万,普安州1.43万,镇宁州0.44万,安顺州0.41万,安隆司1.26万,上林司0.68万,安南卫0.84万,赤水卫2.73万,平坝卫0.11万,威清卫0.08万,里古州7.10万,兴隆卫0.21万,毕节卫2.06万,普市所0.56万,保靖州宣慰司3.32万,永顺宣慰司5.99万 | |
| 清代 (1820年) | 直接采用 | 36 | 716 | 三音诺颜部5.48万,东川府28.80万,乌兰察布盟22.59万,乌噜木齐21.10万,伊克昭盟23.81万,元江州18.31万,养息牧场0.84万,卓索图盟8.16万,口北三厅11.70万,哲里木盟38.01万,唐努乌梁海4.11万,土谢图汗部6.15万,大凌河牧场0.55万,察哈尔7.75万,巴里坤8万,广南府32万,懋功厅3.9万,扎萨克图汗部3.76万,昭乌达盟23.86万,昭通府63.10万,普洱府63.30万,西藏119万,车臣汗部4.19万,达里冈爱牧场7.5784万,锡林郭勒盟37.7857万,镇沅州6万,阿拉善厄鲁特旗31.8802万,青海30万,额济纳土尔扈特旗26.18万[16],三姓副都统辖区37.22万,宁古塔副都统辖区11.04万,白都讷副都统辖区0.64万,阿勒楚喀副都统辖区1.97万,呼伦贝尔总管辖区2.88万,墨尔根副都统辖区1.54万,齐齐哈尔副都统辖区2.81万[29] |
| 密度估算 | 2 | 3 | 古城2.79万,中俄尼布楚条约待议地区0.55万 |
Tab. 2 The population of important time sections in China since historical time (10 000 persons) |
| 时间断面 | 西汉(2年) | 西晋(280年) | 唐代(742年) | 北宋(1102年) | 明代(1460年) | 清代(1820年) | 现代(2010年) |
|---|---|---|---|---|---|---|---|
| 载籍区域人口数 | 5842 | 1657 | 5146 | 4071 | 5270 | 34483 | 136362 |
| 失载区域人口数 | 167 | 556 | 1011 | 1354 | 515 | 719 | - |
| 历史版图内人口 | 6009 | 2213 | 6157 | 5425 | 5785 | 35202 | - |
| 现今版图内人口 | 5793 | 2025 | 5810 | 5198 | 5659 | 34962 | 136362 |
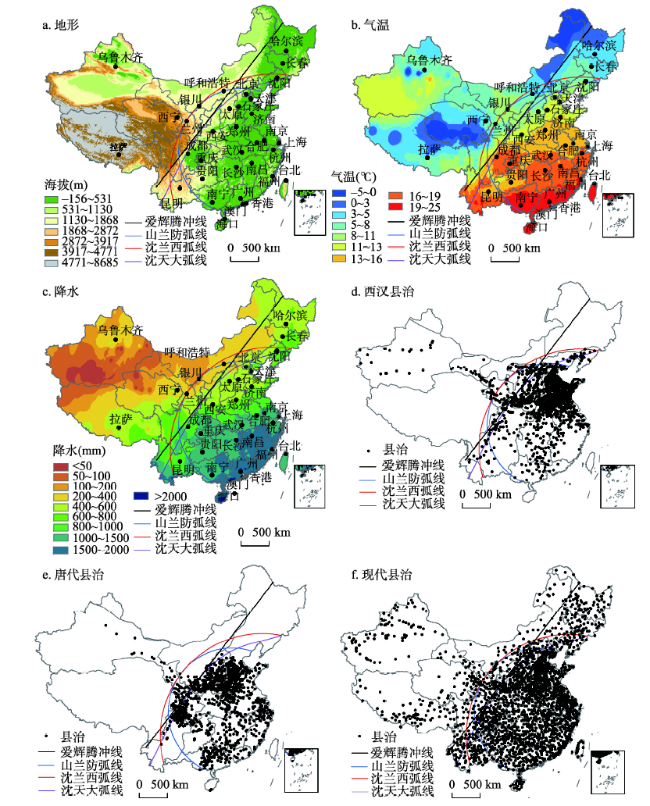
表3 中国人口疏密区分界线东南半壁自然地理要素紧凑度的比较Tab. 3 The compactness of natural geographical elements to the southeast of China's demographic borderline |
| 分界线名称 | 平均海拔(m) | 地形区紧凑度(%) | 平均气温(℃) | 气温区紧凑度(%) | 平均降水(mm) | 降水区紧凑度(%) |
|---|---|---|---|---|---|---|
| 爱辉腾冲线 | 606 | 13.18 | 13.6 | 11.53 | 1001 | 10.23 |
| 沈天大弧线 | 573 | 11.78 | 16.2 | 12.39 | 1151 | 12.89 |
| 山兰防弧线 | 665 | 10.77 | 15.3 | 12.86 | 1074 | 12.84 |
| 沈兰西弧线 | 768 | 10.16 | 14.8 | 12.55 | 1034 | 12.69 |
注:紧凑度=各类自然区连片面积之和÷(自然区类型数×国土总面积)×100%。 |
表4 中国人口疏密区分界线东南半壁人文地理要素集中度的比较Tab. 4 Comparison of the concentration of human geographical elements to the southeast of China's demographic borderline |
| 比较项目 | 爱辉腾冲线 | 山兰防弧线 | 沈兰西弧线 | 沈天大弧线 |
|---|---|---|---|---|
| 国土面积占比(%) | 43.69 | 32.97 | 38.30 | 31.22 |
| 人口数量占比(%) | 90.49 | 87.92 | 91.12 | 85.64 |
| 地级城市占比(%) | 89.86 | 76.69 | 85.81 | 78.72 |
| GDP占比(%) | 95.90 | 82.69 | 93.09 | 88.82 |
| 县治占比(%) | 87.64 | 86.26 | 88.83 | 84.54 |
| 人口集中度(倍) | 2.07 | 2.67 | 2.38 | 2.74 |
| 城市集中度(倍) | 2.06 | 2.33 | 2.24 | 2.52 |
| 经济集中度(倍) | 2.20 | 2.51 | 2.43 | 2.84 |
| 政区集中度(倍) | 2.01 | 2.62 | 2.32 | 2.71 |
注:集中度=特定区域某项社会经济指标的全国占比÷该区域国土面积的全国占比。 |
表5 中国人口疏密区分界线东南半壁人口、土地、县治占比情况(%)Tab. 5 The proportion of population, land and county to the southeast of China's demographic borderline (%) |
| 分界线名称 | 指标统计 | 西汉 (2年) | 西晋 (280年) | 唐代 (742年) | 北宋 (1102年) | 明代 (1460年) | 清代 (1820年) | 现代 (2010年) | 平均 |
|---|---|---|---|---|---|---|---|---|---|
| 爱辉腾冲线 | 土地占比 | 43.52 | 43.60 | 43.64 | 43.68 | 43.70 | 43.80 | 43.89 | 43.69 |
| 人口占比 | 92.21 | 80.11 | 90.36 | 87.74 | 94.09 | 95.16 | 93.76 | 90.49 | |
| 县治占比 | 87.46 | - | 92.94 | - | - | - | 82.53 | 87.64 | |
| 沈天大弧线 | 土地占比 | 31.02 | 31.12 | 31.16 | 31.21 | 31.23 | 31.35 | 31.46 | 31.22 |
| 人口占比 | 88.08 | 75.06 | 85.67 | 82.15 | 91.12 | 92.50 | 84.13 | 85.64 | |
| 县治占比 | 83.13 | - | 88.88 | - | - | - | 81.61 | 84.54 | |
| 山兰防弧线 | 土地占比 | 32.77 | 32.86 | 32.91 | 32.97 | 32.99 | 33.13 | 33.19 | 32.97 |
| 人口占比 | 92.12 | 77.08 | 88.96 | 84.59 | 94.70 | 94.75 | 83.24 | 87.92 | |
| 县治占比 | 89.40 | - | 97.29 | - | - | - | 72.09 | 86.26 | |
| 沈兰西弧线 | 土地占比 | 38.11 | 38.19 | 38.24 | 38.28 | 38.31 | 38.43 | 38.52 | 38.30 |
| 人口占比 | 96.16 | 80.36 | 90.00 | 88.81 | 96.48 | 97.04 | 89.01 | 91.12 | |
| 县治占比 | 93.81 | - | 98.16 | - | - | - | 74.53 | 88.83 |
注:① 1935年时,香港的九龙、香港岛,澳门、台湾被他国占领,胡焕庸先生未将其纳入国土统计,而香港的新界因为只是被租借而纳入了国土统计。为保证可比性,表中所有国土面积统计都包括了港澳台地区。② 过去两千多年来,因河流三角洲的扩张,东南半壁国土面积是不断增加的,表中所有时间断面的人口密度是以相应时间断面的国土面积数来计算的。 |
| [1] |
[ 胡焕庸 . 中国人口之分布: 附统计表与密度图. 地理学报, 1935,2(2):33-74.]
|
| [2] |
[ 胡焕庸 . 中国人口的分布、区划和展望. 地理学报, 1990,45(2):139-145.]
|
| [3] |
[ 葛美玲, 封志明 . 基于GIS的中国2000年人口之分布格局研究: 兼与胡焕庸1935年之研究对比. 人口研究, 2008,32(1):51-57.]
|
| [4] |
[ 杨强, 李丽, 王运动 , 等. 1935-2010年中国人口分布空间格局及其演变特征. 地理研究, 2016,35(8):1547-1560.]
|
| [5] |
[ 胡璐璐, 刘亚岚, 任玉环 , 等. 近80年来中国大陆地区人口密度分界线变化. 遥感学报, 2015,19(6):928-934.]
|
| [6] |
[ 戚伟, 刘盛和, 赵美风 . “胡焕庸线”的稳定性及其两侧人口集疏模式差异. 地理学报, 2015,70(4):551-566.]
|
| [7] |
[ 王露, 杨艳昭, 封志明 , 等. 基于分县尺度的2020-2030年中国未来人口分布. 地理研究, 2014,33(2):310-322.]
|
| [8] |
[ 潘倩, 金晓斌, 周寅康 . 近300年来中国人口变化及时空分布格局. 地理研究, 2013,32(7):1291-1302.]
|
| [9] |
[ 吴静, 王铮 . 2000年来中国人口地理演变的Agent模拟分析. 地理学报, 2008,63(2):185-194.]
|
| [10] |
[ 姜泓冰 . “胡焕庸线”为何稳定80年? 纪念“瑷珲—腾冲线”发现, 专家研讨中国人口地理格局变化. 2015-11-08, 人民网-上海频道, .]
|
| [11] |
[ 梁方仲 . 中国历代户口、田地、田赋统计. 北京: 中华书局, 2008: 19-384.]
|
| [12] |
[ 葛剑雄 . 中国人口史(第一卷):导论、先秦至南北朝时期. 上海: 复旦大学出版社, 2002: 397-434.]
|
| [13] |
[ 葛剑雄, 冻国栋 . 中国人口史(第二卷): 隋唐五代时期. 上海: 复旦大学出版社, 2002: 198-555.]
|
| [14] |
[ 葛剑雄, 吴松弟 . 中国人口史(第三卷): 辽宋金元时期. 上海: 复旦大学出版社, 2000. 12:191-221.]
|
| [15] |
[ 葛剑雄, 曹树基 . 中国人口史(第四卷): 明时期. 上海: 复旦大学出版社, 2000. 09:225-275.]
|
| [16] |
[ 葛剑雄, 曹树基 . 中国人口史(第五卷):清时期. 上海: 复旦大学出版社, 2001: 232-454.]
|
| [17] |
[ 葛剑雄 . 西汉人口地理. 北京: 人民出版社, 1986: 119-120.]
|
| [18] |
[ 葛剑雄 . 中国人口发展史. 福州: 福建人民出版社, 1991: 165, 241.]
|
| [19] |
[ 吴松弟 . 中国移民史(第4卷): 辽宋金元时期. 福州: 福建人民出版社, 1997: 56.]
|
| [20] |
[ 赵文林, 谢淑君 . 中国人口史. 北京: 人民出版社, 1988: 30-275.]
|
| [21] |
Census Office of the State Council, Bureau of Population and Employment Statistics of the National Bureau Of Statistics. China's 2010 Census of County Data. Beijing: China Statistics Press, 2012: 1-102.
[ 国务院人口普查办公室, 国家统计局人口和就业统计司. 中国2010年人口普查分县资料. 北京: 中国统计出版社, 2012: 1-102.]
|
| [22] |
Census Office of the State Council, Bureau of Population and Employment Statistics of the National Bureau of Statistics. China's 2010 Census (2nd Part). Beijing: China Statistics Press, 2012: 2337.
[ 国务院人口普查办公室, 国家统计局人口和就业统计司. 中国2010年人口普查资料(下册). 北京: 中国统计出版社, 2012: 2337.]
|
| [23] |
[ 尚新丽 . 西汉时期匈奴人口数量变化蠡测. 人口与经济, 2006(2):60-65.]
|
| [24] |
[ 张环宙 . 从台湾历史人口的构成看台湾与祖国大陆的渊源关系. 安徽师范大学学报(自然科学版), 2005,28(4):490-493.]
|
| [25] |
[ 路遇, 滕泽之 . 中国人口通史. 北京: 中国社会科学出版社, 2015: 212-416.]
|
| [26] |
(Tang Dynasty)
[(唐) 杜佑 . 通典(卷171-184). 北京: 国家图书馆出版社, 2006.]
|
| [27] |
[ 宋迺工, 张增智, 王鸣中 , 等. 中国人口内蒙古分册. 北京: 中国财政经济出版社, 1987: 37.]
|
| [28] |
[ 薛平拴 . 陕西历史人口地理. 北京: 人民出版社, 2001: 134.]
|
| [29] |
(
[(清) 仁宗敕撰 . 嘉庆重修一统志(卷67-71). 上海: 上海书店出版社, 1984: 596, 805.]
|
| [30] |
[ 祝卓 . 人口地理学. 北京: 中国人民大学出版社, 1991: 76.]
|
| [31] |
(U.S.)
[(美) 安迪·米切尔 . GIS空间分析指南. 北京: 测绘出版社, 2011: 38.]
|
| [32] |
[ 谭其骧 . 中国历史地图集. 北京: 中国地图出版社, 1982-1988年版.]
|
| [33] |
[ 鲜肖威 . 兰州城市聚落的形成与发展. 经济地理, 1982(2):131.]
|
| [34] |
[ 韩茂莉 . 中国历史农业地理(下). 北京: 北京大学出版社, 2012: 850.]
|
| [35] |
[ 赵松乔 . 川滇农牧交错地区农牧业地理调查资料. 北京: 科学出版社, 1959.]
|
| [36] |
[ 史念海 . 论两周时期农牧业地区的分界线. 中国历史地理论丛, 1987(1):57.]
|
| [37] |
[ 王恩涌, 王正毅, 楼耀亮 , 等. 政治地理学: 时空中的政治格局. 北京: 高等教育出版社, 1998: 89.]
|
| [38] |
[ 冀朝鼎 . 中国历史上的基本经济区. 北京: 商务印书馆, 2014: 11, 15.]
|
| [39] |
[ 龚胜生 . 中国古代长寿点区的地理分布及其环境背景的初步研究. 中国历史地理论丛, 1997(3):227-251.]
|
| [40] |
[ 王静爱 . 中国地理教程. 北京: 高等教育出版社, 2007: 107-110.]
|
| [41] |
China Meteorological Data Network: China data set of values of annual and for years in succession (1981-2010). .
[ 中国气象数据网: 中国地面累年值年值数据集(1981-2010年), . .]
|
| [42] |
Department of Comprehensive Statistics of National Bureau of Statistics. China Regional Economic Statistical Yearbook 2011. Beijing: China Statistics Press, 2012: 217.
[ 国家统计局国民经济综合统计司. 中国区域经济统计年鉴2011. 北京: 中国统计出版社, 2012: 217.]
|
| [43] |
National Bureau of Statistics of P. R. China. China Statistical Yearbook 2011. Beijing: China Statistics Press, 2012: 220, 957, 1009, 1016, 1031, 1039.
[ 中华人民共和国国家统计局. 中国统计年鉴2011. 北京: 中国统计出版社, 2012: 220, 957, 1009, 1016, 1031, 1039.]
|
| [44] |
Department of Urban Social and Economic Survey, National Bureau of Statistics. China City Statistical Yearbook 2011. Beijing: China Statistics Press, 2012: 24-29.
[ 国家统计局城市社会经济调查司. 中国城市统计年鉴2011. 北京: 中国统计出版社, 2012: 24-29.]
|
| [45] |
[ 中国政府网: 台湾地理与居民, .]
|
| [46] |
(Tang Dynasty)
[(唐) 李吉甫 . 元和郡县图志. 北京: 中华书局, 1983.]
|
/
| 〈 |
|
〉 |
