
秦岭—大巴山高分辨率气温和降水格点数据集的建立及其对区域气候的指示
|
陆福志(1993-), 男, 云南富宁人, 博士生, 主要从事地表过程和古气候研究。E-mail: geolfz@163.com |
收稿日期: 2018-01-17
要求修回日期: 2019-01-22
网络出版日期: 2019-05-24
基金资助
国家重点研发计划(2016YFA0600503)
国家重点研发计划(2016YFE0109500)
国家自然科学基金项目(41690111)
版权
A high-resolution grid dataset of air temperature and precipitation for Qinling-Daba Mountains in central China and its implications for regional climate
Received date: 2018-01-17
Request revised date: 2019-01-22
Online published: 2019-05-24
Supported by
National Key R&D Program of China(2016YFA0600503)
National Key R&D Program of China(2016YFE0109500)
National Natural Science Foundation of China(41690111)
Copyright
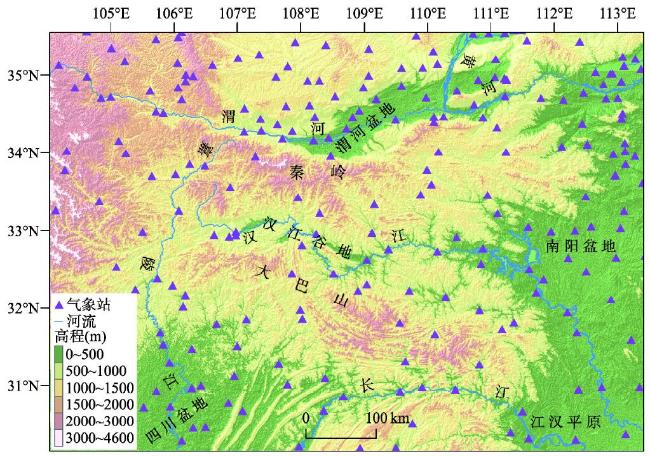
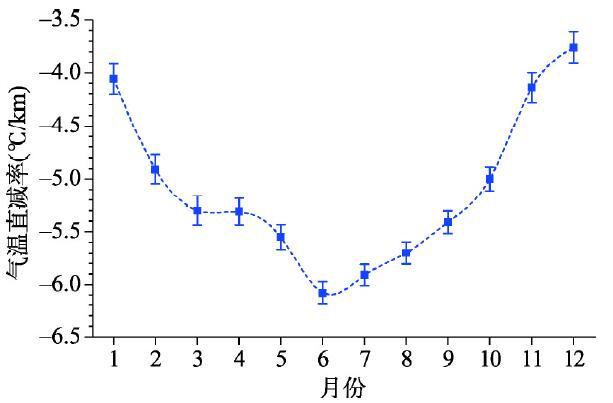
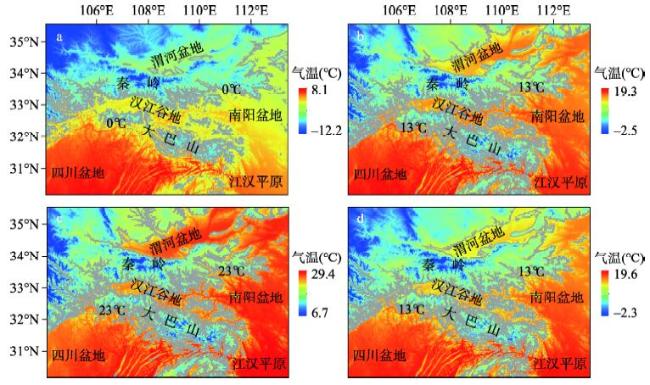
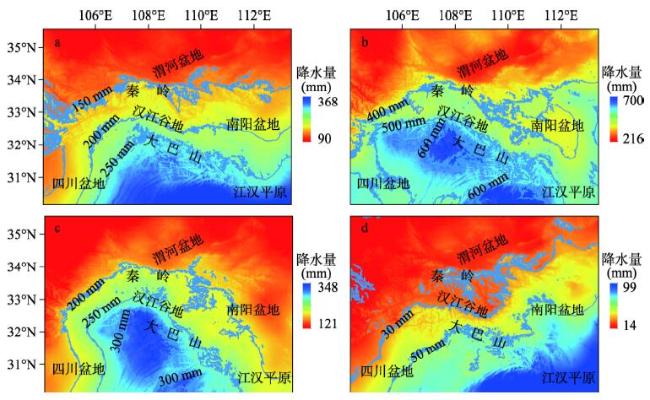
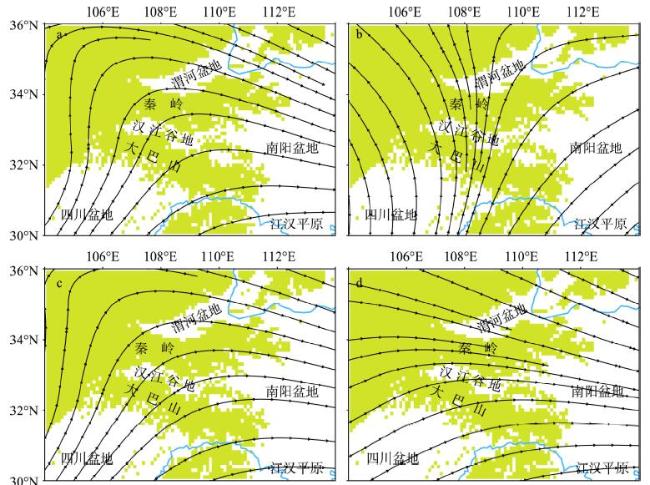
本文建立了秦岭—大巴山高分辨率(~29 m×29 m)的气候格点数据集,包括逐月气温和降水、年均温和年降水、春夏秋冬气温和降水。空间插值方法采用国际上较为先进的ANUSPLIN软件内置的薄盘光滑样条函数,以经度、纬度和海拔为独立变量。空间插值结果与流行的WorldClim 2.0气候格点数据集具有一致性,但是比后者更精确、分辨率更高、细节更突出。本文揭示和证实:秦岭南麓是最冷月气温的0 ℃分界线。秦岭—大巴山气温具有明显的垂直地带性。6月气温直减率最大,为0.61 ℃/100 m;12月气温直减率最小,为0.38 ℃/100 m;年均气温直减率为0.51 ℃/100 m。夏季和秋季降水从西南向东北递减,强降水中心出现在大巴山西南坡。冬季降水从东南向西北递减。大巴山是年降水1000 mm分界线,夏季降水500 mm分界线;秦岭是年降水800 mm分界线,夏季降水400 mm分界线。与大尺度大气环流对比揭示:秦岭—大巴山气温和降水空间分布主要受到东亚季风和地形因子的控制。本文进一步明确了秦岭和大巴山的气候意义:大巴山主要阻挡夏季风北上,影响降水空间分布;秦岭主要阻挡冬季风南下,影响冬季气温空间分布。本文建立的高分辨率气候格点数据集,加深了对区域气候的认识,并将有多方面的用途。
陆福志 , 鹿化煜 . 秦岭—大巴山高分辨率气温和降水格点数据集的建立及其对区域气候的指示[J]. 地理学报, 2019 , 74(5) : 875 -888 . DOI: 10.11821/dlxb201905003
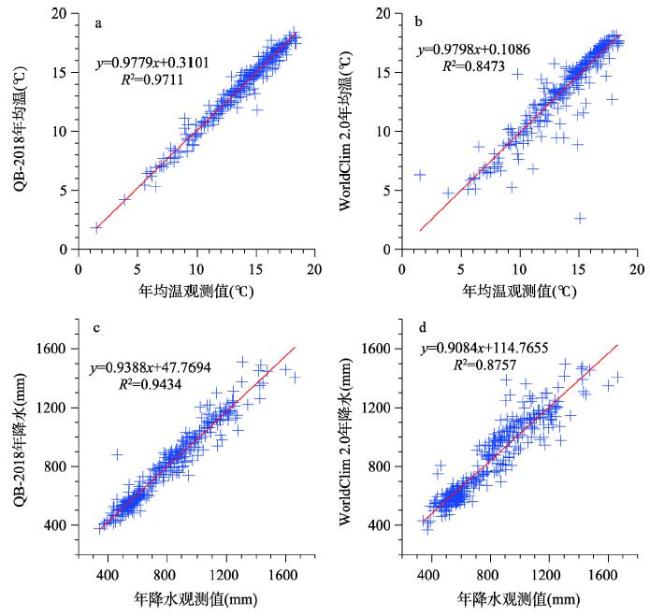
In this study, we developed a high-resolution grid dataset of air temperature and precipitation for the Qinling-Daba Mountains in central China, which includes monthly precipitation and temperature, seasonal precipitation and temperature, annual precipitation and temperature. Spatial interpolation was performed using thin-plate smoothing spline in the software ANUSPLIN, with latitude, longitude and elevation as independent variables. Our dataset is consistent with the widely-used WorldClim 2.0 dataset, but has more accuracy, because it is based on a larger number of meteorological stations and higher-resolution elevation data. Our results show that the southern foot of Qinling Mountains is the 0 ℃ isothermal line in the coldest month (January). The Qinling-Daba Mountains has obvious vertical temperature zones. The maximum temperature lapse rate occurs in June, which is 0.61 ℃ per 100 m, while the minimum temperature lapse rate is 0.38 ℃ per 100 m, occurring in December. The annual mean temperature lapse rate is 0.51 ℃ per 100 m. Both summer and autumn precipitations decrease from southwest to northeast, with heavy rainfall center located on the southwestern slope of the Daba Mountains, while winter precipitation decreases from southeast to northwest. The Daba Mountains is the 1000 mm isohyetal line of annual precipitation and 500 mm isohyetal line of summer precipitation, while the Qinling Mountains is the 800 mm isohyetal line of annual precipitation and 400 mm isohyetal line of summer precipitation. Comparison with large-scale atmospheric circulation indicates that the spatial distributions of air temperature and precipitation in the Qinling-Daba Mountains are mainly controlled by the East Asian monsoon and topography. In summer, the Daba Mountains prevents the northward penetration of East Asian summer monsoon and therefore influences the spatial distribution of precipitation. In winter, the Qinling Mountains prevents the southward penetration of East Asian winter monsoon and therefore influences the spatial distribution of air temperature. In summary, our high-resolution grid dataset contributes to a better understanding of regional climate and will have many applications in future researches.
表1 空间插值模型广义交叉验证结果Tab. 1 Generalized cross-validation results of the spatial interpolation model |
| 气候参数 | 平均值 | 标准差 | GCV | MSR | MSE | VAR | MRE(%) | 单位 |
|---|---|---|---|---|---|---|---|---|
| T1 | 1.31 | 3.93 | 0.53 | 0.21 | 0.26 | 0.33 | NA | ℃ |
| T2 | 4.12 | 3.47 | 0.49 | 0.23 | 0.25 | 0.34 | NA | ℃ |
| T3 | 8.73 | 3.02 | 0.51 | 0.29 | 0.25 | 0.38 | NA | ℃ |
| T4 | 14.84 | 2.74 | 0.47 | 0.28 | 0.23 | 0.36 | NA | ℃ |
| T5 | 19.65 | 2.73 | 0.44 | 0.29 | 0.21 | 0.36 | NA | ℃ |
| T6 | 23.36 | 2.77 | 0.40 | 0.07 | 0.15 | 0.17 | NA | ℃ |
| T7 | 25.36 | 2.71 | 0.38 | 0.20 | 0.19 | 0.27 | NA | ℃ |
| T8 | 24.37 | 2.89 | 0.40 | 0.22 | 0.20 | 0.30 | NA | ℃ |
| T9 | 20.02 | 3.04 | 0.41 | 0.23 | 0.20 | 0.31 | NA | ℃ |
| T10 | 14.47 | 3.23 | 0.42 | 0.24 | 0.21 | 0.32 | NA | ℃ |
| T11 | 8.39 | 3.73 | 0.51 | 0.26 | 0.26 | 0.36 | NA | ℃ |
| T12 | 2.89 | 3.91 | 0.56 | 0.25 | 0.28 | 0.37 | NA | ℃ |
| Tspr | 14.41 | 2.79 | 0.46 | 0.28 | 0.22 | 0.36 | NA | ℃ |
| Tsum | 24.36 | 2.76 | 0.38 | 0.20 | 0.19 | 0.27 | NA | ℃ |
| Taut | 14.29 | 3.29 | 0.42 | 0.22 | 0.21 | 0.30 | NA | ℃ |
| Twin | 2.77 | 3.76 | 0.51 | 0.21 | 0.25 | 0.32 | NA | ℃ |
| Tann | 13.96 | 3.05 | 0.41 | 0.20 | 0.21 | 0.29 | NA | ℃ |
| P1 | 11.7 | 10.0 | 1.8 | 1.0 | 0.9 | 1.3 | 7.7 | mm |
| P2 | 16.8 | 13.5 | 2.3 | 1.5 | 1.1 | 1.8 | 6.4 | mm |
| P3 | 31.9 | 17.4 | 3.6 | 2.2 | 1.7 | 2.8 | 5.4 | mm |
| P4 | 54.0 | 31.0 | 4.5 | 3.0 | 2.2 | 3.7 | 4.0 | mm |
| P5 | 86.9 | 39.4 | 6.3 | 4.1 | 3.0 | 5.1 | 3.4 | mm |
| P6 | 106.7 | 46.5 | 8.4 | 5.2 | 4.1 | 6.6 | 3.8 | mm |
| P7 | 156.6 | 52.8 | 16.6 | 9.2 | 8.3 | 12.4 | 5.3 | mm |
| P8 | 133.9 | 35.0 | 13.3 | 8.8 | 6.3 | 10.8 | 4.7 | mm |
| P9 | 97.2 | 29.4 | 9.3 | 5.3 | 4.6 | 7.1 | 4.7 | mm |
| P10 | 59.8 | 22.1 | 5.0 | 3.6 | 2.3 | 4.2 | 3.8 | mm |
| P11 | 26.6 | 15.7 | 2.8 | 1.9 | 1.3 | 2.3 | 4.8 | mm |
| P12 | 10.8 | 7.8 | 1.4 | 0.8 | 0.7 | 1.1 | 6.6 | mm |
| Pspr | 172.9 | 84.9 | 12.2 | 7.8 | 5.8 | 9.7 | 3.4 | mm |
| Psum | 397.0 | 123.4 | 32.9 | 18.4 | 16.3 | 24.6 | 4.1 | mm |
| Paut | 183.7 | 56.8 | 14.3 | 8.6 | 7.0 | 11.1 | 3.8 | mm |
| Pwin | 39.3 | 30.7 | 5.0 | 2.8 | 2.5 | 3.8 | 6.4 | mm |
| Pann | 792.8 | 270.4 | 53.7 | 31.1 | 26.5 | 40.9 | 3.3 | mm |
表2 本文交叉验证结果及其与WorldClim 2.0数据集的比较Tab. 2 Cross-validation results in this study and comparison with WorldClim 2.0 dataset |
| 气候参数 | QB-2018 | WorldClim 2.0 | 单位 | |||||||
|---|---|---|---|---|---|---|---|---|---|---|
| R | MAE | RMSE | MRE(%) | R | MAE | RMSE | MRE(%) | |||
| T1 | 0.985 | 0.46 | 0.68 | NA | 0.951 | 0.65 | 1.22 | NA | ℃ | |
| T2 | 0.981 | 0.44 | 0.67 | NA | 0.930 | 0.74 | 1.38 | NA | ℃ | |
| T3 | 0.976 | 0.45 | 0.66 | NA | 0.905 | 0.78 | 1.41 | NA | ℃ | |
| T4 | 0.978 | 0.40 | 0.56 | NA | 0.892 | 0.73 | 1.35 | NA | ℃ | |
| T5 | 0.981 | 0.37 | 0.53 | NA | 0.893 | 0.74 | 1.39 | NA | ℃ | |
| T6 | 0.985 | 0.32 | 0.48 | NA | 0.888 | 0.78 | 1.46 | NA | ℃ | |
| T7 | 0.986 | 0.32 | 0.45 | NA | 0.887 | 0.73 | 1.43 | NA | ℃ | |
| T8 | 0.987 | 0.34 | 0.46 | NA | 0.899 | 0.86 | 1.43 | NA | ℃ | |
| T9 | 0.987 | 0.34 | 0.48 | NA | 0.915 | 0.68 | 1.35 | NA | ℃ | |
| T10 | 0.987 | 0.35 | 0.51 | NA | 0.930 | 0.65 | 1.25 | NA | ℃ | |
| T11 | 0.986 | 0.43 | 0.63 | NA | 0.949 | 0.63 | 1.19 | NA | ℃ | |
| T12 | 0.985 | 0.46 | 0.66 | NA | 0.957 | 0.66 | 1.15 | NA | ℃ | |
| Tspr | 0.979 | 0.39 | 0.57 | NA | 0.897 | 0.73 | 1.36 | NA | ℃ | |
| Tsum | 0.986 | 0.31 | 0.45 | NA | 0.892 | 0.75 | 1.42 | NA | ℃ | |
| Taut | 0.988 | 0.35 | 0.52 | NA | 0.933 | 0.63 | 1.24 | NA | ℃ | |
| Twin | 0.985 | 0.44 | 0.65 | NA | 0.948 | 0.63 | 1.22 | NA | ℃ | |
| Tann | 0.985 | 0.35 | 0.52 | NA | 0.921 | 0.63 | 1.28 | NA | ℃ | |
| P1 | 0.976 | 1.5 | 2.2 | 12.6 | 0.928 | 2.7 | 4.1 | 23.0 | mm | |
| P2 | 0.983 | 1.7 | 2.5 | 10.1 | 0.959 | 2.9 | 4.3 | 17.1 | mm | |
| P3 | 0.975 | 2.7 | 3.8 | 8.6 | 0.954 | 4.4 | 6.0 | 13.9 | mm | |
| P4 | 0.987 | 3.5 | 5.1 | 6.5 | 0.951 | 12.2 | 14.1 | 22.6 | mm | |
| P5 | 0.983 | 5.2 | 7.2 | 6.0 | 0.953 | 10.3 | 12.7 | 11.9 | mm | |
| P6 | 0.976 | 7.0 | 10.1 | 6.6 | 0.958 | 9.8 | 13.6 | 9.2 | mm | |
| P7 | 0.925 | 13.2 | 20.1 | 8.4 | 0.808 | 24.1 | 31.6 | 15.4 | mm | |
| P8 | 0.887 | 10.8 | 16.2 | 8.1 | 0.802 | 16.8 | 24.0 | 12.6 | mm | |
| P9 | 0.921 | 7.5 | 11.5 | 7.7 | 0.835 | 21.0 | 26.2 | 21.6 | mm | |
| P10 | 0.969 | 4.0 | 5.4 | 6.6 | 0.923 | 7.6 | 9.9 | 12.8 | mm | |
| P11 | 0.982 | 2.1 | 3.0 | 7.8 | 0.950 | 5.1 | 6.3 | 19.2 | mm | |
| P12 | 0.976 | 1.2 | 1.7 | 10.8 | 0.939 | 2.0 | 2.8 | 18.8 | mm | |
| Pspr | 0.987 | 9.5 | 13.7 | 5.5 | 0.965 | 22.2 | 27.9 | 12.8 | mm | |
| Psum | 0.945 | 26.0 | 40.2 | 6.6 | 0.878 | 42.8 | 60.1 | 10.8 | mm | |
| Paut | 0.954 | 11.8 | 16.9 | 6.4 | 0.899 | 31.6 | 38.8 | 17.2 | mm | |
| Pwin | 0.981 | 4.1 | 6.0 | 10.4 | 0.956 | 6.8 | 9.6 | 17.3 | mm | |
| Pann | 0.971 | 43.0 | 64.3 | 5.4 | 0.936 | 78.5 | 104.5 | 9.9 | mm | |
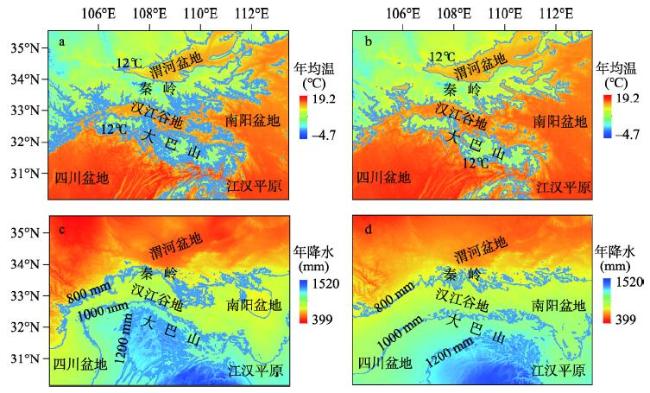
图4 秦岭—大巴山年均温(a, b)和年降水(c, d)空间分布(a、c来自QB-2018数据集(本文),b、d来自WorldClim 2.0数据集[2])Fig. 4 Spatial distribution of annual mean temperature (a, b) and annual precipitation (c, d) in the Qinling-Daba Mountains, where (a) and (c) are from QB-2018 dataset (this study) while (b) and (d) are from WorldClim 2.0 dataset[2] |
The authors have declared that no competing interests exist.
作者已声明无竞争性利益关系。
| [1] |
|
| [2] |
|
| [3] |
|
| [4] |
|
| [5] |
[ 吴佳, 高学杰 . 一套格点化的中国区域逐日观测资料及与其它资料的对比. 地球物理学报, 2013,56(4):1102-1111.]
|
| [6] |
[ 吴娴, 黄伟, 陈发虎 . 1951-2012年中国大陆0.025°×0.025°高分辨率月气温和降水量格点数据集的建立及其初步应用. 兰州大学学报(自然科学版), 2014,50(2):213-220.]
|
| [7] |
[ 陈明荣, 唐海彬, 田连恕 , 等. 陕西省地理. 西安: 陕西人民出版社, 1996.]
|
| [8] |
[ 冯绳武, 徐德馥, 雷新彦 . 中国自然地理. 北京: 高等教育出版社, 1989.]
|
| [9] |
[ 张强, 阮新, 熊安元 . 近57年我国气温格点数据集的建立和质量评估. 应用气象学报, 2009,20(4):385-393.]
|
| [10] |
[ 卓静, 朱延年 . 秦岭主脊区年降水量空间插值最优方法研究. 干旱区地理, 2017,40(3):555-563.]
|
| [11] |
[ 孙伟红, 常直杨 . 基于GIS的西秦岭地区降水量空间插值方法探讨. 中国水土保持, 2017,38(6):54-56.]
|
| [12] |
[ 莫申国, 张百平 . 基于DEM的秦岭温度场模拟. 山地学报, 2007,25(4):406-411.]
|
| [13] |
[ 白红英, 马新萍, 高翔 , 等. 基于DEM的秦岭山地1月气温及0 ℃等温线变化. 地理学报, 2012,67(11):1443-1450.]
|
| [14] |
[ 刘志红 ,
|
| [15] |
|
| [16] |
|
| [17] |
|
| [18] |
|
| [19] |
[ 谭剑波, 李爱农, 雷光斌 . 青藏高原东南缘气象要素Anusplin和Cokriging空间插值对比分析. 高原气象, 2016,35(4):875-886.]
|
| [20] |
[ 廖荣伟, 曹丽娟, 张冬斌 , 等. 中国地面气温和降水网格化数据精度比较. 气象科技, 2017,45(2):364-374.]
|
| [21] |
[ 钱永兰, 吕厚荃, 张艳红 . 基于ANUSPLIN软件的逐日气象要素插值方法应用与评估. 气象与环境学报, 2010,26(2):7-15.]
|
| [22] |
|
| [23] |
|
| [24] |
[ 熊秋芬, 黄玫, 熊敏诠 , 等. 基于国家气象观测站逐日降水格点数据的交叉检验误差分析. 高原气象, 2011,30(6):1615-1625.]
|
| [25] |
[ 刘正佳, 于兴修, 王丝丝 , 等. 薄盘光滑样条插值中三种协变量方法的降水量插值精度比较. 地理科学进展, 2012,31(1):56-62.]
|
| [26] |
[ 马新萍, 白红英, 郭帅 , 等. 秦岭太白山气温垂直递减率研究. 干旱区资源与环境, 2017,31(7):139-144.]
|
| [27] |
[ 翟丹平, 白红英, 秦进 , 等. 秦岭太白山气温直减率时空差异性研究. 地理学报, 2016,71(9):1587-1595.]
|
| [28] |
[ 李双双, 芦佳玉, 延军平 , 等. 1970-2015年秦岭南北气温时空变化及其气候分界意义. 地理学报, 2018,73(1):13-24.]
|
| [29] |
[ 毕宝贵 . 中尺度地形对陕南暴雨的影响研究. 南京: 南京气象学院, 2004.]
|
/
| 〈 |
|
〉 |