
基于随机森林模型的西藏人口分布格局及影响因素
作者简介:王超(1992-), 女, 山西晋城人, 硕士生, 研究方向为区域可持续发展。E-mail: lrningxiang@163.com
收稿日期: 2017-08-31
要求修回日期: 2019-03-11
网络出版日期: 2019-04-23
基金资助
西藏自治区自然科学基金项目(XZ2017ZRG-100, 2015ZR-13-56)
国家科技支撑计划(2014BAL07B02-2)
中国清洁发展机制基金赠款项目(2014058)
Population distribution pattern and influencing factors in Tibet based on random forest model
Received date: 2017-08-31
Request revised date: 2019-03-11
Online published: 2019-04-23
Supported by
Natural Science Foundation of Tibet Autonomous Region, No.XZ2017ZRG-100, No.2015ZR-13-56
The National Key Technology R&D Program of China, No.2014BAL07B02-2
Grants Program of China Clean Development Mechanism Fund, No.2014058
Copyright
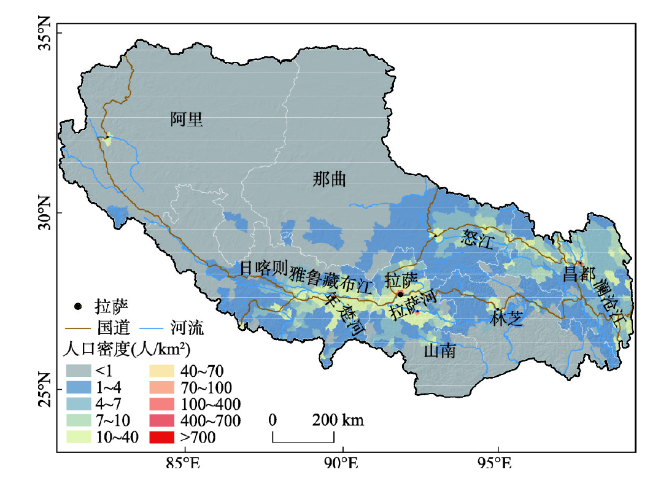
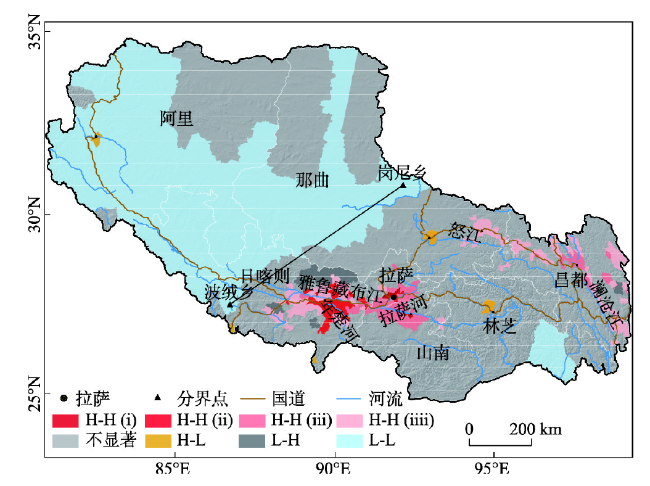
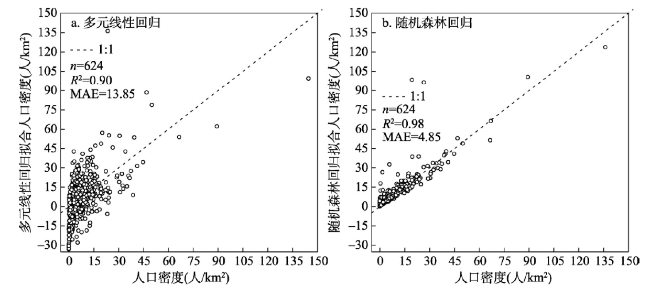
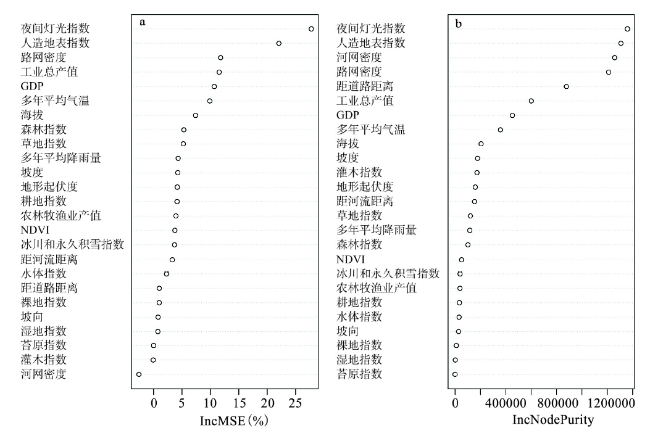
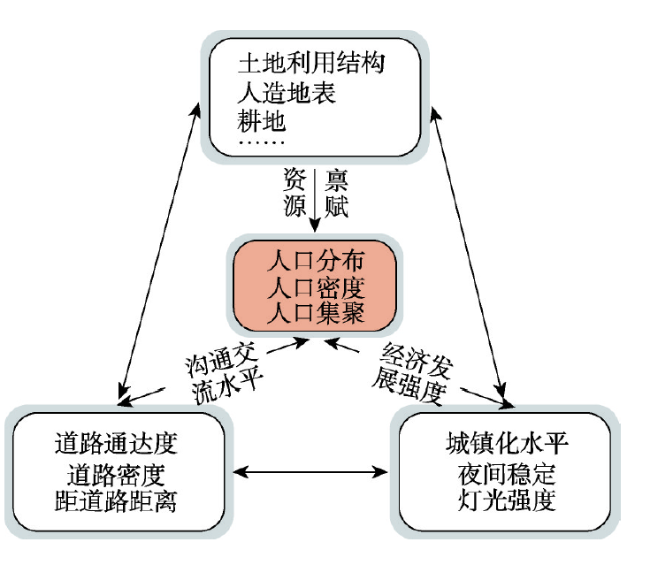
在乡镇尺度下厘清人口分布格局及其影响因素与区域差异,对在生态脆弱区制定可持续发展政策具有重大指导意义。基于2010年西藏自治区的乡镇尺度人口普查数据,提取人口密度和空间因子,利用空间统计方法分析了人口分布的疏密特征和集聚特征,对比运用多元线性回归方法和随机森林回归方法探索该地区人口分布的影响因素及其区域差异。结果表明:① 西藏乡镇人口密度在空间上表现出极强的非均衡性,其总体趋势是东南高西北低,高密度区与大江大河及主要交通干线具有较强的空间耦合性;② 大致以波绒乡(聂拉木县)—岗尼乡(安多县)为西藏的人口分界线,人口集聚的“核心—边缘”特征明显;③ 多元线性回归方法中,人造地表指数对人口分布的影响程度最大,随后依次为夜间灯光指数和路网密度;④ 利用随机森林方法进行的人口密度预测比多元线性回归方法精度高,可以用来对影响因子的重要性进行排序;排序在前六位的影响因子由高到低依次为夜间灯光指数、人造地表指数、路网密度、工业总产值、GDP和多年平均气温,它们与人口密度均呈正相关关系;地形地貌要素中以海拔和坡度的贡献率最大且与人口密度均呈负相关关系;⑤ 西藏人口分布格局的影响因素及其相互作用呈现出明显的区域差异特征,河谷是西藏地区人口的集聚区,主要分布在拉萨河谷、年楚河谷以及三江河谷;⑥ 通过随机森林回归分析,可以利用概念模型来表达人口分布影响因素,将主导因素概括为土地利用结构、道路通达度及城镇化水平。
王超 , 阚瑷珂 , 曾业隆 , 李国庆 , 王民 , 次仁 . 基于随机森林模型的西藏人口分布格局及影响因素[J]. 地理学报, 2019 , 74(4) : 664 -680 . DOI: 10.11821/dlxb201904004
Clarifying the spatial pattern of population distribution, its influencing factors and regional differences at the township level is of great guiding significance for formulating sustainable development policies in ecologically fragile areas. Based on the population census data of Tibet at the township level in 2010, the population density and spatial factors were extracted. The density and clustering characteristics of the population distribution were analyzed by spatial statistical method. The multiple linear regression method and the random forest regression method were used to explore the population influencing factors and their regional differences of population distribution. The results showed that: (1) The population density of Tibet at the township level showed a strong spatial non-equilibrium. The general trend was high in the southeast and low in the northwest, and there was a strong spatial coupling between the main rivers and the main traffic trunks in high density area. (2) The "core-edge" characteristic of population clustering was obvious, and roughly to the wave of Borong (Nyalam County)-Gangni (Anduo County) as the demarcation line. (3) In the multiple linear regression method, the artificial surface index had the greatest influence on the population distribution, followed by the nighttime light index and road network density. (4) Random forest method was more accurate than multiple linear regression method to predict the population density, which can be used to sort the importance of the influencing factors. The influencing factors of the first six factors were the night light index, artificial surface index, road network density, industrial output value, GDP and multi-year average temperature, and these factors were positively correlated with population density. Among topographic factors, the contribution rate of elevation and slope was the largest, which was negatively correlated with population density. (5) The influencing factors and their interactions of population distribution in Tibet showed obvious regional differences. The valley was a gathering area for population in the study region, mainly in Lhasa River Valley, Nianchu River Valley and Sanjiang River Valley. (6) Through the analysis of random forest regression, the conceptual model can be used to express the influencing factors of population distribution, and the dominant factors were summarized as land use structure, road accessibility and urbanization level.
Tab. 1 Influencing factors of population distribution表1 影响人口分布的因素 |
| 影响因素 | 影响因子 | 描述 |
|---|---|---|
| 地形地貌(A) | 海拔(A1) | 地形地貌是影响人口分布的最基本因素之一:随着海拔高度的增加,地形起伏度呈现逐渐升高趋势,人口也随之减少[20];在中国人口大多居住在坡度小于15°的地区[19];而坡向是构成地形地貌因素的重要定量指标,通过调节各自然要素的分配影响人口分布,已有研究将其作为乡镇尺度人口分布的影响因子[28]。 |
| 坡度(A2) | ||
| 坡向(A3) | ||
| 地形起伏度(A4) | ||
| 气候(B) | 多年平均降雨量(B1) | 人类对不同水热条件影响下的资源和环境条件具有选择偏好,在较广的范围内,人口密度与气温、降水量呈显著的正相关关系[29]。 |
| 多年平均气温(B2) | ||
| 植被覆盖(C) | NDVI(C) | 以NDVI为代表的植被指数能反映植被覆盖情况,一方面显示了人类生产生活所依赖的植被资源分布,另一方面则展示了不适宜居住区的空间分布(如沙漠和密林)[30]。 |
| 土地利用(D) | 土地利用指数(Dn) | 根据“无土地则无人口”原则,人口分布受特定的土地利用类型影响,且土地利用面积与人口分布具有强相关性[22]。 |
| 河流(E) | 河网密度(E1) | 河流一方面为人们提供充足而稳定的水源,另一方面造就沿岸地势低平、土壤肥沃的格局,为人们居住生活、基础设施建设和发展生产提供适宜的空间[20]。 |
| 距河流距离(E2) | ||
| 道路(F) | 路网密度(F1) | 基于交通条件的区域可达性与人口分布关系密切,该因素对欠发达地区人口集聚所起的作用远大于发达地区[15]。 |
| 距道路距离(F2) | ||
| 经济发展(G) | 夜间灯光指数(G1) | 夜间灯光亮度是城镇化的一个解释性指标,能反映城镇化水平,根据灯光影像的亮度值和人口距离衰减定律可以估算人口总数和人口分布[31,32];也可以在一定程度上反映GDP,但两者的定量关系仍存在较大不确定性,并且夜间灯光指数反映的是消费而非生产[33],不能完全替代经济统计数据;另外它还能反映区域的总体能源消耗量[34,35]。一般来说,区域人口分布与经济发展之间具有较强的一致性,产业结构的差异也会影响人口分布[36,37]。 |
| GDP(G2) | ||
| 工业总产值(G3) | ||
| 农林牧渔业 产值(G4) |
Fig. 1 The population density at township level in Tibet in 2010图1 2010年西藏乡镇尺度人口密度分布 |
Tab. 2 The total population and area of each population density range at township level in Tibet表2 西藏不同人口密度分级的乡镇人口总数与面积 |
| 人口密度分级(人/km2) | 统计单元个数(个) | 总人口(人) | 人口占比(%) | 总面积(km2) | 面积占比(%) |
|---|---|---|---|---|---|
| 0~1 | 102 | 235880 | 7.86 | 768471 | 63.82 |
| 1~4 | 189 | 550149 | 18.33 | 244664 | 20.32 |
| 4~7 | 115 | 482070 | 16.06 | 91516 | 7.60 |
| 7~10 | 75 | 378282 | 12.60 | 45631 | 3.79 |
| 10~40 | 126 | 870345 | 28.99 | 51935 | 4.31 |
| 40~70 | 7 | 43936 | 1.46 | 918 | 0.08 |
| 70~100 | 1 | 6621 | 0.22 | 74 | 0.01 |
| 100~400 | 6 | 142181 | 4.74 | 722 | 0.06 |
| 400~700 | 2 | 93542 | 3.12 | 172 | 0.01 |
| >700 | 1 | 199159 | 6.63 | 68 | 0.01 |
Fig. 2 Spatial clustering characteristics of population distribution in the study area图2 研究区人口分布的空间集聚特征 |
Tab. 3 The correlation coefficient between population distribution with each influencing factor表3 人口分布与各影响因子的相关系数 |
| 影响因子 | 序号 | 与人口密度相关系数 | 与人口总数相关系数 | 相关系数平均值 |
|---|---|---|---|---|
| 海拔 | A1 | -0.137** | -0.172** | -0.155 |
| 坡度 | A2 | -0.058 | -0.058 | - |
| 坡向 | A3 | 0.013 | 0.016 | - |
| 地形起伏度 | A4 | -0.043 | -0.058 | - |
| 多年平均降雨量 | B1 | -0.057 | -0.02 | - |
| 多年平均气温 | B2 | 0.171** | 0.197** | 0.184 |
| NDVI | C | -0.001 | 0.047 | - |
| 冰川和永久积雪指数 | D1 | -0.044 | -0.047 | - |
| 草地指数 | D2 | -0.043 | -0.008 | - |
| 耕地指数 | D3 | 0.078 | 0.088* | - |
| 灌木指数 | D4 | 0.067 | 0.049 | - |
| 裸地指数 | D5 | -0.05 | -0.100* | - |
| 人造地表指数 | D6 | 0.942** | 0.810** | 0.876 |
| 森林指数 | D7 | -0.025 | -0.009 | - |
| 湿地指数 | D8 | -0.015 | -0.02 | - |
| 水体指数 | D9 | -0.023 | -0.021 | - |
| 苔原指数 | D10 | -0.005 | 0.072 | - |
| 河网密度 | E1 | 0.498** | 0.437** | 0.468 |
| 距河流距离 | E2 | -0.045 | -0.071 | - |
| 路网密度 | F1 | 0.664** | 0.630** | 0.647 |
| 距道路距离 | F2 | -0.048 | -0.089* | - |
| 夜间灯光指数 | G1 | 0.902** | 0.792** | 0.847 |
| GDP | G2 | 0.398** | 0.490** | 0.444 |
| 工业总产值 | G3 | 0.453** | 0.452** | 0.453 |
| 农林牧渔业产值 | G4 | 0.036 | 0.327** | - |
注:*在0.05水平上显著相关,**在0.01水平上显著相关。 |
Fig. 3 Scatter plot of population density verification in Multiple Linear Regression (a) and Random Forest Regression (b)图3 多元线性回归(a)与随机森林回归(b)人口密度验证散点图 |
Fig. 4 The importance ranking of influencing factors图4 影响因子重要性排序 |
Fig. 5 Impact of the night light index (a), artificial surface index (b), road density (c), industrial output (d), GDP (e), annual average temperature (f), elevation (g) and slope (h) on population density图5 夜间灯光指数(a)、人造地表指数(b)、路网密度(c)、工业总产值(d)、GDP(e)、多年平均气温(f)、海拔(g)、坡度(h)对人口密度的影响强度 |
Tab. 4 Population density fitting R2, MAE and their rankings of influencing factors among different regions in Tibet表4 西藏各地区人口密度拟合R2、MAE与影响因子排序 |
| 地区 | R2 | MAE | 排序1 | 排序2 | 排序3 | 排序4 | 排序5 | 排序6 |
|---|---|---|---|---|---|---|---|---|
| 拉萨市 | 0.98 | 50.84 | G1 | D6 | B2 | G3 | A1 | D2 |
| 昌都地区 | 0.96 | 1.94 | A1 | D6 | G1 | B2 | G2 | D3 |
| 山南地区 | 0.95 | 3.36 | D3 | B2 | A1 | D6 | G1 | D1 |
| 日喀则地区 | 0.97 | 3.53 | D6 | G1 | D3 | F1 | B2 | A1 |
| 那曲地区 | 0.92 | 0.60 | C | A1 | B1 | B2 | F1 | D6 |
| 阿里地区 | 0.98 | 0.30 | D6 | G1 | D3 | B2 | F1 | D1 |
| 林芝地区 | 0.87 | 1.16 | G1 | D6 | F1 | F2 | D8 | A2 |
注:日喀则、昌都、林芝、山南先后于2014-2016年完成撤地设市。 |
Fig. 6 Conceptual model of population distribution图6 人口分布概念模型 |
The authors have declared that no competing interests exist.
| [1] |
[
|
| [2] |
|
| [3] |
|
| [4] |
[
|
| [5] |
[
|
| [6] |
[
|
| [7] |
[
|
| [8] |
[
|
| [9] |
[
|
| [10] |
[
|
| [11] |
[
|
| [12] |
[
|
| [13] |
[
|
| [14] |
[
|
| [15] |
[
|
| [16] |
[
|
| [17] |
[
|
| [18] |
[
|
| [19] |
[
|
| [20] |
[
|
| [21] |
[
|
| [22] |
[
|
| [23] |
[
|
| [24] |
[
|
| [25] |
[
|
| [26] |
[
|
| [27] |
[
|
| [28] |
[
|
| [29] |
[
|
| [30] |
|
| [31] |
|
| [32] |
|
| [33] |
|
| [34] |
|
| [35] |
|
| [36] |
[
|
| [37] |
[
|
| [38] |
[
|
| [39] |
|
| [40] |
|
| [41] |
|
| [42] |
|
| [43] |
|
| [44] |
|
| [45] |
[
|
| [46] |
|
| [47] |
[
|
| [48] |
[
|
| [49] |
[
|
| [50] |
[
|
| [51] |
[
|
| [52] |
|
| [53] |
[
|
| [54] |
|
| [55] |
|
| [56] |
[
|
| [57] |
|
| [58] |
[
|
| [59] |
[
|
| [60] |
[
|
/
| 〈 |
|
〉 |
