
高铁网络化下中国城市旅游场强空间格局及演化
作者简介:汪德根(1973-), 男, 安徽黄山人, 博士, 教授, 主要研究城市旅游与高铁旅游。E-mail: wdg713@163.com
收稿日期: 2016-03-31
要求修回日期: 2016-05-25
网络出版日期: 2016-11-28
基金资助
国家自然科学基金项目(41271134)
Evolution and spatial characteristics of tourism field strength of cities under high speed rail network in China
Received date: 2016-03-31
Request revised date: 2016-05-25
Online published: 2016-11-28
Supported by
National Natural Science Foundation of China, No.41271134
Copyright
交通是旅游系统不可或缺的先决条件。“四纵四横”高铁网络是中国“交通革命”的重要里程碑,高铁网络化对中国城市旅游可达性空间格局产生重要影响,进而极大地改变城市的旅游吸引力和辐射力。本文运用GIS空间分析方法测度高铁对全国338个城市可达性影响,进而分析高铁网络化全国城市旅游吸引力空间特征及演变。结果表明:① 高铁网络化下中国城市可达性整体得到优化,可达性空间格局呈现明显交通指向性,形成“高铁廊道”效应;② 高铁网络化下中国城市旅游场强空间格局呈现出“多中心”环状发散和“枝状”扩散的双重特征,尤其是沿高铁线“枝状”扩散更为明显;城市旅游场强变化率在高铁线形成高值走廊,并呈现以高铁轴线为中心向外围递减的空间格局;③ 高铁对高旅游场强区和较高旅游场强区影响最为显著,分布城市数量大幅增加,面积拓展超过100%;且高铁提升了区域中心城市旅游场强值,旅游吸引力辐射范围沿高铁线扩张。
汪德根 , 钱佳 , 牛玉 . 高铁网络化下中国城市旅游场强空间格局及演化[J]. 地理学报, 2016 , 71(10) : 1784 -1800 . DOI: 10.11821/dlxb201610010
Traffic is an indispensable prerequisite for tourism system. The high speed rail network of "four vertical and four horizontal" is an important milestone of "traffic revolution" in China, which will produce important effect on the spatial pattern of tourism accessibility in Chinese cities, and then change the tourism attraction force and radiation force of cities greatly. The paper analyzes the evolution and spatial characteristics of tourism attraction force of cities under high speed rail network in China, based on the measurements of the influence of accessibility of 338 cities under HSR with the help of GIS. The results show that: (1) the accessibilities of Chinese cities are optimized under high speed rail network. The spatial pattern of accessibilities presents obvious traffic direction and forms the “high speed rail corridor” effect. (2) The spatial pattern of tourism field strength in Chinese cities presents the dual characteristics of the "multi-center" annular divergence and "dendritic" diffusion, especially "dendritic" diffusion is more obvious along high speed rails; The change rate of urban tourism field strength forms the high value corridor along high speed rails and presents the spatial pattern of decreasing from the center to the outer circumference along high speed rails. (3) The influence of the highest tourism field strength area and higher tourism field strength area under high speed rails is most significant, and the number of cities distributed in two types of tourism field strength increases significantly, the area of the two types of tourism field strength expands more than 100%; high speed rails enhance the tourism field strength value of regional central cities, and radiation range of tourism attraction extends along high speed rails.
Key words: high speed rail network; tourism field strength; spatial pattern; evolution; China
Fig. 1 Traffic network distribution under HSR in China图1 高铁条件下中国交通网络分布 |
Tab. 1 Time cost of different types of transportation modes and land use表1 空间地物时间成本 |
| 空间对象 | 高速公路 | 国道 | 省道 | 水域 | 铁路 | 高铁 | 陆地 | ||
|---|---|---|---|---|---|---|---|---|---|
| 速度(km/h) | 120 | 80 | 60 | 1 | 160 | 200 | 250 | 300 | 5 |
| 时间成本(Min) | 0.5 | 0.75 | 1 | 60 | 0.375 | 0.3 | 024 | 0.2 | 12 |
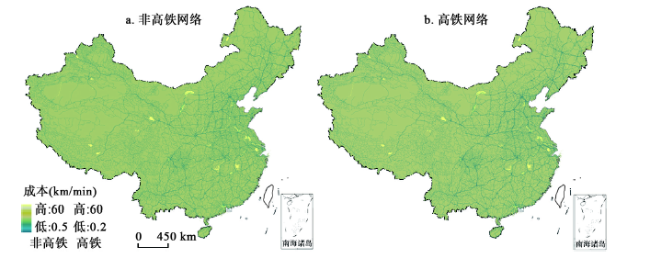
Fig. 2 Cost grid of the road with and without the HSR network in China图2 非高铁和高铁网络下中国道路成本栅格图 |
Tab. 2 The first and last 20 cities of the tourism comprehensive scale in China表2 中国旅游综合规模值前20位和后20位城市 |
| 前20位 | 后20位 | |||||||
|---|---|---|---|---|---|---|---|---|
| 城市 | Zi | 城市 | Zi | 城市 | Zi | 城市 | Zi | |
| 北京 | 161.06 | 武汉 | 25.15 | 果洛 | 0.07 | 阿里 | 0.52 | |
| 上海 | 76.62 | 南京 | 23.72 | 黄南 | 0.20 | 山南 | 0.65 | |
| 广州 | 56.23 | 青岛 | 19.84 | 玉树 | 0.21 | 怒江 | 0.65 | |
| 深圳 | 53.58 | 大连 | 19.32 | 克孜 | 0.24 | 阿拉善 | 0.68 | |
| 重庆 | 50.20 | 沈阳 | 18.44 | 海北 | 0.33 | 吴忠 | 0.69 | |
| 天津 | 35.26 | 宁波 | 18.42 | 金昌 | 0.37 | 和田 | 0.71 | |
| 苏州 | 32.90 | 西安 | 18.06 | 七台河 | 0.47 | 中卫 | 0.74 | |
| 杭州 | 32.79 | 长沙 | 18.03 | 大兴安岭 | 0.47 | 固原 | 0.74 | |
| 珠海 | 29.28 | 无锡 | 18.01 | 海南(州) | 0.49 | 嘉峪关 | 0.75 | |
| 成都 | 26.41 | 郑州 | 16.35 | 昌都 | 0.50 | 博尔塔拉 | 0.76 | |
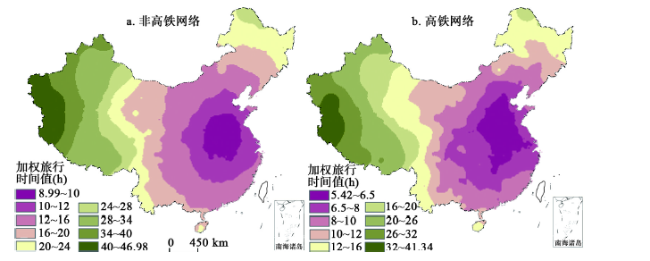
3.2 高铁网络化下全国城市可达性空间特征及演变 3.2.1 高铁网络化下全国城市可达性空间格局特征及演变 非高铁网络化下,全国城市可达性空间格局呈现以中原地区为中心的“核心—外围”模式,围绕中心区域呈规则环状向外扩散,并向西部和东北地区逐级递减,全国地级市区域加权平均旅行时间平均值为21.23 h(图3a)。河南、湖北、安徽和山东等省份大部分地区,山西、江苏和河北等省份小部分地区构成全国的可达性中心区,加权平均旅行时间值均在10 h以内。加权旅行平均时间高值区位于区域的边缘地区,主要为新疆西南部和西藏西北部,加权旅行时间值在40 h以上。 |
Fig. 3 Overall spatial pattern of accessibility of cities with and without the HSR network in China图3 非高铁和高铁网络化下中国城市可达性空间格局 |
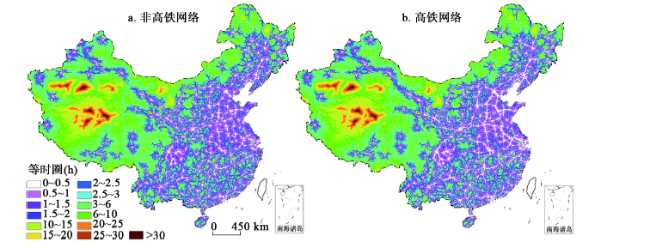
Fig. 4 Distribution of isochronous rings of cities with and without the HSR network in China图4 非高铁和高铁网络化下中国城市等时圈空间分布特征 |
Tab. 3 Area and change rate of isochronous rings with and without the HSR network表3 非高铁和高铁网络化下中国等时圈面积及变化率 |
| 等时圈(h) | 非高铁(km2) | 高铁(km2) | 变化率(%) | 等时圈(h) | 非高铁(km2) | 高铁(km2) | 变化率(%) |
|---|---|---|---|---|---|---|---|
| 0~0.5 | 345868 | 470327 | 35.98 | 6~10 | 1278643 | 1260835 | -1.39 |
| 0.5~1 | 884396 | 950462 | 7.47 | 10~15 | 582401 | 577868 | -0.78 |
| 1~1.5 | 1003070 | 998255 | -0.48 | 15~20 | 265217 | 263301 | -0.72 |
| 1.5~2 | 929261 | 904988 | -2.61 | 20~25 | 135743 | 135100 | -0.47 |
| 2~2.5 | 824206 | 794014 | -3.66 | 25~30 | 51301 | 50975 | -0. 64 |
| 2.5~3 | 723282 | 697495 | -3.57 | >30 | 8692 | 8692 | 0.00 |
| 3~6 | 2748062 | 2667989 | -2.91 |
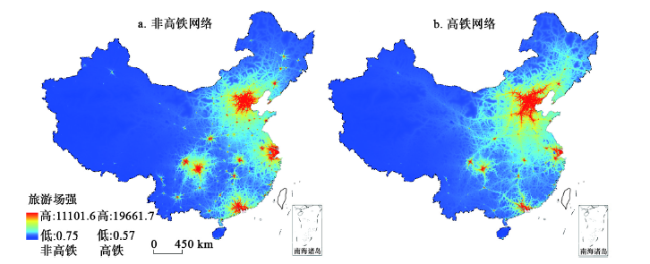
3.3 高铁网络化下全国城市旅游场强空间特征及演变 3.3.1 非高铁和高铁网络化下全国城市旅游场强空间格局特征 非高铁网络化下,全国城市旅游场强整体分布呈现“多中心”环状发散特征(图5a)。以北京和天津为中心的京津冀城市群成为全国旅游场强的一级核心区域,旅游场强值最大,且影响辐射远、面积广,在该区域内己形成连接成片的高值区,并向内蒙古、辽宁、山西、河南和山东等省扩散。以上海、杭州和南京为中心的长三角城市群,以广州和深圳为中心的珠三角城市群成为全国城市旅游场强二级核心区域,二者旅游场强值和影响范围均较大,但低于京津冀城市群。这3大城市群形成非高铁网络条件下全国城市旅游场强的3个大辐射中心区域。其他地区的旅游场强影响范围主要集中在各地级市中心城区附近,呈同心圆状向外扩散,成“核心—外围”结构,但交通“轴向”拓展并不明显。其中,成渝城市群形成以成都和重庆为核心的两个高场强区,二者辐射范围并未重叠。在西安、武汉和长沙在各自小范围区域内形成高场强区,对周边城市产生旅游吸引力,形成单极增长的态势。此外,在黑龙江哈尔滨,吉林长春,辽宁沈阳,山东青岛和济南,河南洛阳,山西太原,浙江温州、丽水和金华,安徽合肥和黄山,江苏徐州,福建福州、泉州和厦门,广西南宁、桂林和柳州,云南昆明,贵州贵阳,内蒙古呼和浩特,新疆乌鲁木齐等区域,仅在城市本身及周边形成较高场强区,从全国层面看呈现出“孤岛”格局。 |
Fig. 5 Spatial pattern of tourism field strength of cities with and without the HSR network in China图5 非高铁和高铁网络化下中国城市旅游场强空间格局 |
Tab. 4 Change rate of tourism field strength with different scales表4 不同空间尺度旅游场强变化率 |
| 地带 | 地带 | 省域 | 城市 | ||||||||
|---|---|---|---|---|---|---|---|---|---|---|---|
| 非高铁 | 高铁 | 变化率(%) | 非高铁 | 高铁 | 变化率(%) | 非高铁 | 高铁 | 变化率(%) | |||
| 东部 | 37.37 | 51.82 | 38.67 | 59.06 | 77.67 | 31.51 | 33.35 | 46.93 | 40.72 | ||
| 中部 | 15.33 | 22.07 | 43.97 | 18.19 | 28.36 | 55.91 | 19.11 | 30.40 | 59.08 | ||
| 西部 | 7.25 | 10.18 | 40.41 | 11.27 | 16.09 | 42.77 | 11.79 | 16.84 | 42.83 | ||
Tab. 5 The first and last 10 cities of tourism field strength with and without the HSR network in China表5 非高铁和高铁网络化下中国城市旅游场强排名前后10位城市 |
| 前10名 | 非高铁 | 高铁 | 后10名 | 非高铁 | 高铁 | ||||||
|---|---|---|---|---|---|---|---|---|---|---|---|
| 城市 | 场强值 | 城市 | 场强值 | 城市 | 场强值 | 城市 | 场强值 | ||||
| 1 | 北京 | 276.69 | 北京 | 346.31 | 1 | 巴音 | 4.55 | 阿克苏 | 5.93 | ||
| 2 | 深圳 | 191.91 | 深圳 | 290.03 | 2 | 那曲 | 4.38 | 巴音郭楞 | 5.93 | ||
| 3 | 廊坊 | 128.84 | 天津 | 176.30 | 3 | 山南 | 4.36 | 那曲 | 5.21 | ||
| 4 | 上海 | 125.14 | 廊坊 | 171.56 | 4 | 阿克苏 | 4.34 | 山南 | 5.21 | ||
| 5 | 天津 | 120.69 | 上海 | 136.36 | 5 | 日喀则 | 4.22 | 克孜 | 5.05 | ||
| 6 | 广州 | 108.18 | 保定 | 118.83 | 6 | 克孜 | 3.87 | 日喀则 | 4.95 | ||
| 7 | 保定 | 86.44 | 广州 | 115.35 | 7 | 喀什 | 3.69 | 喀什 | 4.75 | ||
| 8 | 唐山 | 79.05 | 东莞 | 114.33 | 8 | 阿里 | 3.48 | 和田 | 4.17 | ||
| 9 | 东莞 | 75.30 | 唐山 | 105.97 | 9 | 和田 | 3.44 | 阿里 | 3.99 | ||
| 10 | 佛山 | 67.11 | 苏州 | 93.11 | 10 | 琼直辖 | 2.50 | 琼直辖 | 3.29 | ||
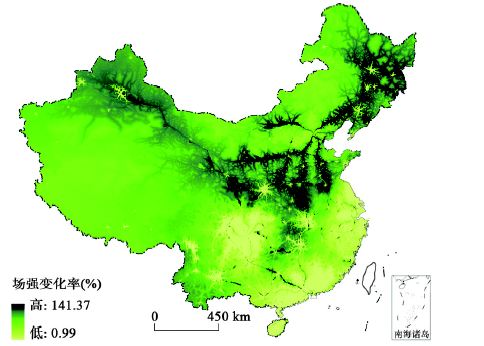
Fig. 6 Change rate of tourism field strength spatial pattern of citieswith and without the HSR network in China图6 非高铁和高铁网络化下中国城市旅游场强空间变化率 |
Fig. 7 Spatial pattern of average tourism field strength of cities with and without the HSR network in China图7 非高铁和高铁网络化下中国不同类型城市旅游场强空间格局 |
Tab. 6 Spatial change of different tourism field strength of cities under HSR network in China表6 高铁网络化下中国城市不同旅游场强区空间格局演变 |
| 场强类型 | 非高铁网络 | 高铁网络 | 面积变化率(%) | 场值变化率(%) | ||||||
|---|---|---|---|---|---|---|---|---|---|---|
| 东 | 中 | 西 | 东 | 中 | 西 | |||||
| 高场强区 | 省份 | 5 | 0 | 0 | 5 | 0 | 0 | 105.88 | 3.76 | |
| 城市 | 5 | 0 | 0 | 9 | 0 | 0 | ||||
| 较高场强区 | 省份 | 5 | 1 | 1 | 6 | 4 | 3 | 203.19 | -12.37 | |
| 城市 | 17 | 1 | 1 | 45 | 19 | 4 | ||||
| 中场强区 | 省份 | 7 | 5 | 4 | 5 | 6 | 6 | -3.76 | 12.09 | |
| 城市 | 56 | 33 | 13 | 29 | 40 | 18 | ||||
| 较低场强区 | 省份 | 5 | 7 | 9 | 4 | 5 | 10 | 1.59 | 28.55 | |
| 城市 | 22 | 70 | 70 | 17 | 45 | 78 | ||||
| 低场强区 | 省份 | 1 | 1 | 8 | 1 | 1 | 5 | -12.25 | 22.94 | |
| 城市 | 2 | 1 | 47 | 2 | 1 | 31 | ||||
Tab. 7 Main conclusions of the pattern and evolution of the urban tourism field intensity space in China under the HSR network表7 高铁网络化下中国城市旅游场强空间格局及演变的主要结论 |
| 名称 | 指标 | 非高铁网络 | 高铁网络 |
|---|---|---|---|
| 全国城市可达性空间格局 | 可达性空间格局及演变 | •“核心—外围”模式 | •“核心—外围”模式 •“高铁廊道”效应 |
| 等时圈空间格局及演变 | •“点—轴渐进式”空间格局 | •“点—轴渐进式”空间格局 →0~0.5 h等时圈范围(++) →0.5~1 h等时圈范围(+) →1~1.5 h和>12 h时圈范围(–) →1.5~10 h等时圈范围(––) | |
| 全国城市旅游场强空间格局 | 旅游场强空间格局特征 | •“多中心”环状发散 | •“多中心”环状发散 •“枝状”扩散 |
| 旅游场强空间格局演变 | •东部(+)>中部(+++)>西部(++) •全国旅游场强均值(+) | ||
| •变化率沿高铁线形成高值走廊 •变化率以高铁轴线为中心向外围递减 | |||
| 不同类型旅游场强区的空间格局 | 旅游场强区空间格局演变 | •高和较高旅游场强区面积和城市数量(+) •中旅游场强区以下城市数量(–) •区域中心城市旅游场强值(+),尤其是京津冀、长三角和珠三角等3个城市群的旅游吸引辐射范围沿高铁线向中部和西部地区扩散明显 | |
注:“+”表示增加,“+”越多表示变化幅度越明显;“–”表示减少,“–”越多表示变化幅度越明显。 |
The authors have declared that no competing interests exist.
| [1] |
[
|
| [2] |
|
| [3] |
|
| [4] |
|
| [5] |
|
| [6] |
|
| [7] |
|
| [8] |
|
| [9] |
|
| [10] |
[
|
| [11] |
|
| [12] |
Chen Cai. The effect of SHINKANSEN to tourism in Japan. Journal of Chinese Tourism, 2011-03-04.
[
|
| [13] |
. [
|
| [14] |
[
|
| [15] |
|
| [16] |
[
|
| [17] |
[
|
| [18] |
[
|
| [19] |
[
|
| [20] |
[
|
| [21] |
[
|
| [22] |
[
|
| [23] |
|
| [24] |
|
| [25] |
[
|
| [26] |
[
|
| [27] |
[
|
| [28] |
[
|
/
| 〈 |
|
〉 |

