
亚热带山地丘陵区植被NPP时空变化及其与气候因子的关系----以湖南省为例
作者简介:陈晓玲(1991-), 女, 福建漳州人, 硕士, 主要从事遥感与地理信息系统及其环境变化研究.E-mail: cxlgis@126.com
收稿日期: 2015-10-09
要求修回日期: 2015-12-15
网络出版日期: 2016-01-15
基金资助
国家自然科学基金项目(41171326, 41201386);中南大学中央高校基本科研业务费专项资金(2015zzts254)
Spatial and temporal variability of the net primary production (NPP) and its relationship with climate factors in subtropical mountainous and hilly regions of China: A case study in Hunan province
Received date: 2015-10-09
Request revised date: 2015-12-15
Online published: 2016-01-15
Supported by
National Natural Science Foundation of China, No.41171326, No.41201386;The Fundamental ResearchFunds for the Central Universities of Central South University, No.2015zzts254
Copyright
以湖南省为研究区,采用250 m×250 m空间分辨率的MODIS-NDVI数据,结合相应时间段的气象数据,使用改进的CASA模型,模拟并分析该区域2000-2013年间的植被NPP的时空变化特征,并借助统计分析方法对不同土地覆盖类型中植被NPP的变化趋势及其显著性,NPP与气候因子的相关性进行量化分析.结果表明:① 该区域的净初级生产量年际变化特征明显,年净初级生产量分布在41.62~125.40 Tg C/yr之间,平均值为86.34 Tg C/yr,总体来看,14年间湖南省植被净初级生产量呈波动减少趋势,年际减少趋势为2.70 Tg C/yr;② NPP空间分布差异较大,基本特点是西高东低,南高北低,从西南向东北呈逐渐递减趋势,其中,各植被分区的NPP有明显差异;③ 2000-2013年,湖南省植被NPP呈极显著增加(slope >0,p < 0.01),显著增加(slope > 0,0.01 ≤ p < 0.05),无明显变化(p ≥ 0.05),极显著减少(slope < 0,p < 0.01)和显著减少(slope < 0,0.01 ≤ p < 0.05)的区域分别占总面积的比例为5.40%,2.02%,61.64%,16.79%和14.15%.植被NPP变化趋势总体上显示为减少的趋势,而不同土地覆盖类型的植被NPP变化趋势及显著性存在较大差异,其中草地的NPP变化趋势最为显著,接着依次是森林,其他土地,建设用地和农田;④ 分析不同土地覆盖类型的植被NPP对气候因子的响应,发现NPP与降水量之间的相关关系强于其与温度的相关关系.
陈晓玲 , 曾永年 . 亚热带山地丘陵区植被NPP时空变化及其与气候因子的关系----以湖南省为例[J]. 地理学报, 2016 , 71(1) : 35 -48 . DOI: 10.11821/dlxb201601003
In this study, we selected Hunan province as the study area. The vegetation NPP and its changes from 2000 to 2013 were calculated using improved Carnegie-Ames-Stanford Approach (CASA) model with MODIS-NDVI data at a 250 m×250 m spatial resolution and meteorological data. Furthermore, we quantitatively analyzed the correlation between NPP and climate for various land-cover types so as to provide reliable information for local environment and sustainable development. The results indicate that: (1) The annual amount of NPP decreased from 41.62 Tg C/yr in 2000 to 125.40 Tg/yr in 2013, with an average being about 86.34 Tg C/yr. In general, the total amount of NPP has decreased obviously since 2000, with an annual rate of about 2.70 Tg C/yr. (2) The annual NPP from 2000 to 2013 had significant spatial differences throughout the study area, decreasing from the southwest to the northeast. There were obvious differences over various vegetation divisions. (3) According to the changes rate of NPP from 2000 to 2013, the study area could be divided into five regions, namely, extremely remarkable increase rate (slope > 0, p < 0.01), remarkable increase rate (slope > 0, 0.01 ≤ p < 0.05), unnoticeable rate (p ≥ 0.05), extremely remarkable decrease rate (slope < 0, p < 0.01) and remarkable decrease rate (slope < 0, 0.01 ≤ p < 0.05), which accounted for 5.40%, 2.02%, 61.64%, 16.79% and 14.15%, respectively. In general, NPP decreased from 2000 to 2013 over different land-cover types, among which, the most significant change took place in grassland and forestland, followed by other types of land, construction land and farmland. (4) The spatial distribution of NPP had higher correlation with precipitation than with temperature.
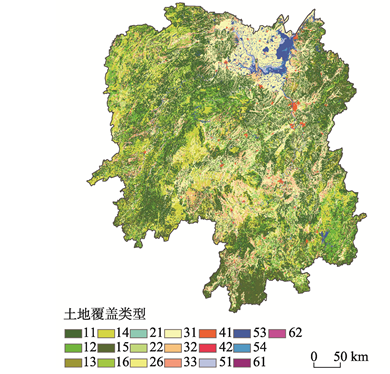
Fig. 1 Land cover map of Hunan province in 2005图1 湖南省2005年土地覆盖类型图(注:土地类型代码同表1.) |
Tab. 1 Land-cover types and NPP model parameters in Hunan province表1 湖南省土地覆盖类型及NPP模型输入参数 |
| 一级类型 | 类型代码 | 二级类型 | NDVImax | NDVImin | εmax |
|---|---|---|---|---|---|
| 森林 | 11 | 常绿针叶林 | 0.737 | 0.575 | 0.39 |
| 12 | 常绿阔叶林 | 0.732 | 0.530 | 0.99 | |
| 13 | 落叶针叶林 | 0.739 | 0.579 | 0.49 | |
| 14 | 落叶阔叶林 | 0.730 | 0.558 | 0.69 | |
| 15 | 针阔混交林 | 0.740 | 0.594 | 0.48 | |
| 16 | 灌丛 | 0.749 | 0.622 | 0.43 | |
| 草地 | 21 | 草甸草地 | 0.561 | 0.299 | 0.54 |
| 22 | 典型草地 | 0.715 | 0.509 | 0.54 | |
| 26 | 灌丛草地 | 0.739 | 0.612 | 0.54 | |
| 农田 | 31 | 水田 | 0.650 | 0.499 | 0.54 |
| 32 | 水浇地 | 0.615 | 0.473 | 0.54 | |
| 33 | 旱地 | 0.675 | 0.497 | 0.54 | |
| 建设 用地 | 41 | 城镇建设用地 | 0.550 | 0.273 | 0.54 |
| 42 | 农村建设用地 | 0.630 | 0.431 | 0.54 | |
| 其他 土地 | 51 | 沼泽 | 0.633 | 0.420 | 0.54 |
| 53 | 内陆水体 | -- | -- | -- | |
| 54 | 河湖滩地 | 0.601 | 0.291 | 0.54 | |
| 61 | 裸岩 | -- | -- | -- | |
| 62 | 裸地 | -- | -- | -- |
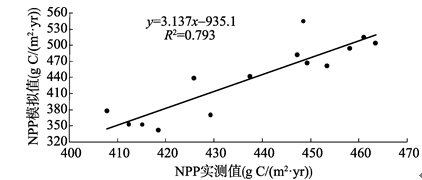
Fig. 2 Correlation between observed and estimated NPP图2 优势树种实测平均生产力与NPP模拟值对比(注:"--"表示未考虑.) |
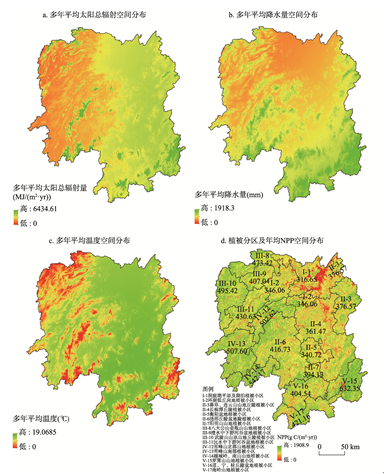
Fig 3. Spatial distribution of the annual solar radiation, precipitation, temperature and NPP in Hunan province from 2000 to 2013图3 湖南省多年平均太阳总辐射,降水量,温度和NPP空间分布 |
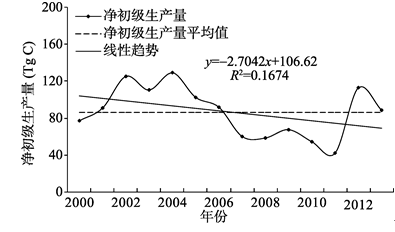
Fig. 4 Inter-annual variation of NPP in Hunan province from 2000 to 2013图4 2000-2013年湖南省NPP的年际变化趋势 |
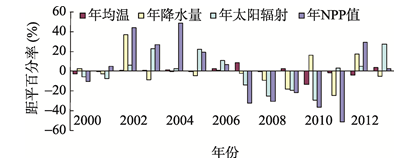
Fig. 5 Inter-annual variation of NPP and meteorological factors in Hunan province from 2000 to 2013图5 2000-2013年湖南省NPP及气象因子年际变化特征 |
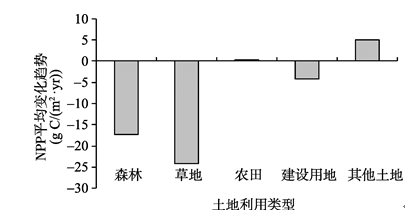
Fig. 6 The change trend of annual NPP in different land-cover types in Hunan province from 2000 to 2013图6 2000-2013年湖南省不同土地覆盖类型植被NPP的平均变化趋势 |
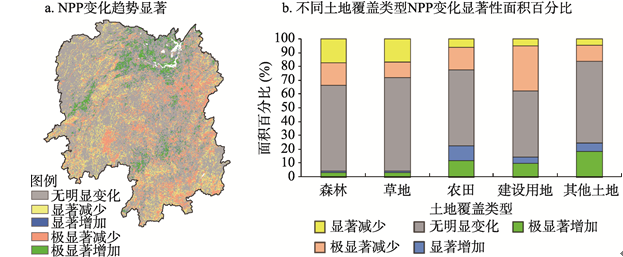
Fig. 7 Spatial distribution of significance test (a) and gradation rate (b) for different land-cover types in Hunan province from 2000 to 2013图7 2000-2013年湖南省年均NPP显著性检验 |
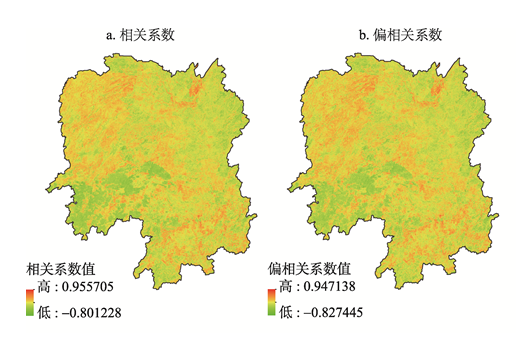
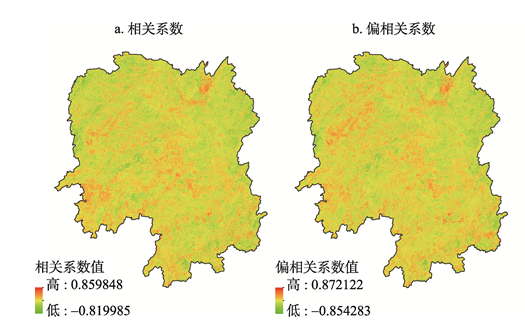
Fig. 8 Inter-annual correlation between NPP and precipitation in Hunan province from 2000 to 2013图8 2000-2013年湖南省NPP与降水年际相关性 |
Fig. 9 Inter-annual correlation between NPP and temperature in Hunan province from 2000 to 2013图9 2000-2013年湖南省NPP与温度年际相关性 |
Tab. 2 Correlation coefficient and partial correlation coefficient between NPP and climate factors in different land-cover types from 2000 to 2013表2 2000-2013年湖南省不同土地覆盖类型NPP与气候因子相关性 |
| 面积百分比(%) | ||||||
|---|---|---|---|---|---|---|
| 一级类型 | 气候因子 | 平均相关系数 | 显著正相关 | 不显著正相关 | 显著负相关 | 不显著负相关 |
| 森林 | 降水 | 0.056 | 5.27 | 63.10 | 3.67 | 27.96 |
| *降水 | 0.044 | 6.09 | 57.60 | 5.09 | 31.23 | |
| 气温 | -0.015 | 7.22 | 38.77 | 7.35 | 46.67 | |
| *气温 | 0.005 | 7.36 | 42.26 | 7.59 | 42.79 | |
| 草地 | 降水 | 0.041 | 7.60 | 61.05 | 5.00 | 26.34 |
| *降水 | 0.033 | 6.77 | 55.52 | 5.65 | 32.07 | |
| 气温 | 0.004 | 7.56 | 42.84 | 7.23 | 42.37 | |
| *气温 | 0.013 | 7.23 | 44.72 | 7.17 | 40.88 | |
| 农田 | 降水 | 0.074 | 4.88 | 64.78 | 3.70 | 26.70 |
| *降水 | 0.052 | 7.36 | 58.02 | 5.61 | 29.01 | |
| 气温 | -0.057 | 6.73 | 31.91 | 7.07 | 54.28 | |
| *气温 | -0.028 | 7.11 | 35.66 | 7.58 | 49.66 | |
| 建设用地 | 降水 | 0.052 | 4.25 | 58.13 | 4.05 | 33.57 |
| *降水 | 0.041 | 5.73 | 59.18 | 4.98 | 30.11 | |
| 气温 | -0.028 | 7.22 | 40.31 | 7.22 | 45.25 | |
| *气温 | -0.008 | 7.93 | 48.97 | 7.74 | 35.36 | |
| 其他土地 | 降水 | 0.106 | 4.40 | 65.65 | 4.20 | 25.75 |
| *降水 | 0.137 | 4.37 | 71.75 | 4.02 | 19.87 | |
| 气温 | 0.031 | 6.92 | 46.17 | 6.70 | 40.21 | |
| *气温 | 0.090 | 7.54 | 57.79 | 6.85 | 27.82 | |
注:*降水,*气温分别表示忽略气温对NPP的影响和忽略降水对NPP的影响. |
The authors have declared that no competing interests exist.
| [1] |
|
| [2] |
|
| [3] |
[
|
| [4] |
[
|
| [5] |
[
|
| [6] |
[
|
| [7] |
|
| [8] |
|
| [9] |
|
| [10] |
|
| [11] |
[
|
| [12] |
[
|
| [13] |
[
|
| [14] |
|
| [15] |
[
|
| [16] |
[
|
| [17] |
|
| [18] |
[
|
| [19] |
[
|
| [20] |
[
|
| [21] |
[
|
| [22] |
[
|
| [23] |
[
|
| [24] |
[
|
| [25] |
[
|
| [26] |
[
|
| [27] |
[
|
| [28] |
[
|
| [29] |
[
|
| [30] |
|
| [31] |
[
|
| [32] |
|
| [33] |
Agricultural Regionalization in Hunan Province. Changsha: Hunan Science & Technology Press, 1986.
[湖南省农业区划委员会. 湖南省农业区划. 长沙: 湖南省科学技术出版社, 1986.]
|
| [34] |
[
|
| [35] |
|
/
| 〈 |
|
〉 |