
20世纪40年代初以来中国大陆沿海主要海湾形态变化
作者简介:侯西勇(1975-), 男, 山东泰安人, 博士, 研究员, 博士生导师, 中国地理学会会员(S110006477M), 主要从事海岸带土地利用变化与海岸线变化遥感监测,脆弱性评价及综合管理等方面的研究.E-mail: xyhou@yic.ac.cn
收稿日期: 2015-08-15
要求修回日期: 2015-12-18
网络出版日期: 2016-01-15
基金资助
国家自然科学基金项目(31461143032);中国科学院重点部署项目(KZZD-EW-TZ-15, KZZD-EW-14);中国科学院战略性先导科技专项子课题(XDA05130703)
Shape changes of major gulfs along the mainland of Chinasince the early 1940s
Received date: 2015-08-15
Request revised date: 2015-12-18
Online published: 2016-01-15
Supported by
National Natural Science Foundation of China, No.31461143032;Key Research Program of the Chinese Academy of Sciences, No.KZZD-EW-TZ-15, No.KZZD-EW-14;Strategic Priority Research Program of Chinese Academy of Sciences, No.XDA05130703
Copyright
受气候变化和人类活动的影响,中国海岸带正在经历各种剧烈的变化,海湾形态变化是其中的一个重要方面.基于地形图资料与遥感影像提取20世纪40年代初至2014年7个时相的中国大陆沿海主要海湾的空间信息,进而分析海湾岸线类型结构,开发利用程度和空间位置的变化特征,以及海湾面积,形状和重心分布的变化特征.结果表明,20世纪40年代初以来,中国大陆沿海主要海湾的形态变化显著且复杂,主要体现为:海湾岸线的结构变化显著,自然岸线的长度和比例急剧减少;海湾岸线的开发利用程度持续增强;海湾岸线普遍背陆向海运动;海湾面积普遍大幅萎缩;海湾形状总体趋向复杂但个体间的差异在缩小;海湾重心分布位置普遍背陆向海迁移;海湾变化具有显著的时空差异性等.总的来说,以围填海为主的人类活动是导致海湾发生上述变化特征的主要原因.通过研究,指出应该对中国的海湾进行功能定位划分和分类管理,通过强化以海湾为基本单元的管理,促进中国海岸带综合管理能力的提高和管理目标的实现.
侯西勇 , 侯婉 , 毋亭 . 20世纪40年代初以来中国大陆沿海主要海湾形态变化[J]. 地理学报, 2016 , 71(1) : 118 -129 . DOI: 10.11821/dlxb201601009
Impacted by climate changes and human activities, the coastal zone of China has undergone various dramatic changes, among which, shape change of major gulfs (including bays and estuaries) is one of the most important aspects. In this paper, spatial dataset of gulf shoreline and gulf shape in seven phases since the early 1940s was delineated based on topographic maps and remote sensing imageries, and a group of indices including the ratio of natural shoreline, the shoreline utilization degree, shoreline swing direction, gulf area, gulf shape index and gulf centroid were used to analyze the spatial-temporal characteristics of gulfs in detail. It turned out that: in general, shape changes of major gulfs in the mainland of China were significant and complicated during the past 70 years, specifically, visible changes of shoreline structure, especially the decreases in both length and ratio of natural shoreline took place; the shoreline utilization degree increased remarkably because more and more natural shoreline had been artificalized; the fact that shoreline seaward shift caused by sea reclamation occurred in the majority of gulfs; spatial size (area) decreased in most of gulfs due to the fast and extensive sea reclamation; the geometric shape of most gulfs had become more complicated while the discrepancies among all the gulfs were narrowed; the centroid of most gulfs moved toward the sea; gulf-shape variations exhibited remarkable spatio-temporal differences. It is obvious that human activities, especially sea reclamation, have become the key driving force of gulf shape change since 1990. Based on the above-mentioned findings, classification management strategy based on dominant-function oriented gulf classification is strongly recommended, and gulf-based management should be strengthen in order to improve the abilities of Integrated Coastal Zone Management (ICZM) practices in China.
Key words: gulf; shoreline structure; shoreline change; gulf area; gulf shape index; gulf centroid; sea reclamation; China
Tab. 1 Major gulfs along the mainland of China表1 中国大陆沿海主要的海湾 |
| 海区 | 海湾名称 | 数量 |
|---|---|---|
| 渤海 | 营城子湾,金州湾,普兰店湾,董家口湾,葫芦山湾,复州湾,太平湾,锦州湾,渤海湾,莱州湾 | 10 |
| 黄海 | 青堆子湾,常江澳,窑湾,大连湾,套子湾,芝罘湾,四十里湾,双岛港,威海湾,朝阳港,荣成湾--俚岛湾,爱连湾,桑沟湾,石岛湾,靖海湾--五垒岛湾,险岛湾,乳山湾,丁字湾,横门湾,北湾(鳌山湾),崂山湾,沙子口湾,胶州湾,灵山湾,崔家潞,琅琊湾,海州湾 | 27 |
| 东海 | 长江口,杭州湾,象牙港,三门湾,浦坝港,涂茨--爵溪湾,门前涂湾,高湾--昌国湾,台州湾,隘顽湾,漩门湾,乐清湾,温州湾,大渔--鱼寮湾,沿浦湾,沙埕湾,福宁湾,三沙湾,罗源湾,福清湾,兴化湾,湄洲湾,泉州湾,围头湾--厦门港,佛昙湾,旧镇湾,东山湾,诏安湾,宫口湾 | 29 |
| 南海 | 汕头湾,海门湾,碣石湾,红海湾,大亚湾,大鹏湾,珠江口,广海湾,镇海湾,海陵湾--北津港,水东港,湛江港--雷州湾,安铺港,铁山港,廉州湾,大风江口,钦州湾,防城港,珍珠港 | 19 |
Tab. 2 Categories of gulf shoreline in China表2 中国海湾岸线分类 |
| 代码 | 利用方式分类 | 说明 |
|---|---|---|
| 1 | 丁坝与突堤岸线 | 丁坝:与海岸成一定角度向外伸出,具有保滩和挑流作用的护岸建筑物;突堤:一端与岸连接,一端伸入海中的实体防浪建筑物. |
| 2 | 港口码头岸线 | 港池与航运码头形成的岸线 |
| 3 | 围垦(中)岸线 | 正在建设中的围海堤坝 |
| 4 | 养殖围堤岸线 | 用于养殖的人工修筑堤坝 |
| 5 | 盐田围堤岸线 | 用于盐碱晒制而围垦的堤坝 |
| 6 | 交通围堤岸线 | 用于交通运输的人工修筑堤坝 |
| 7 | 防潮堤岸线 | 分隔陆域和水域的其他海堤护岸工程(非养殖区,非盐田区,且交通功能不显著的海堤/海塘工程) |
| 8 | 自然岸线 | 未利用的岸线 |
Tab. 3 Indices of human force on various kinds of shoreline表3 各类型海湾岸线的人力作用强度指数 |
| 利用方式 | 丁坝突堤 | 港口码头 | 围垦中岸线 | 养殖围堤 | 盐田围堤 | 交通围堤 | 防潮堤 | 自然岸线 |
|---|---|---|---|---|---|---|---|---|
| 指数 | 4 | 4 | 4 | 3 | 3 | 4 | 2 | 1 |
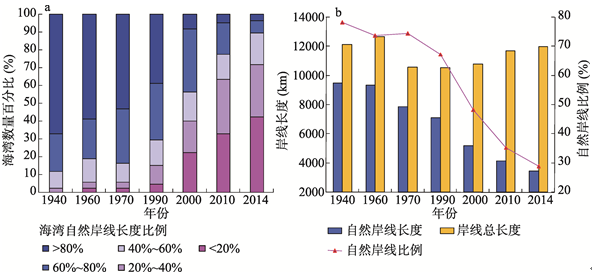
Fig. 1 Changes of natural shoreline ratio of major gulfs in China during the past 70 years图1 近70年中国大陆沿海主要海湾自然岸线比例的变化 |
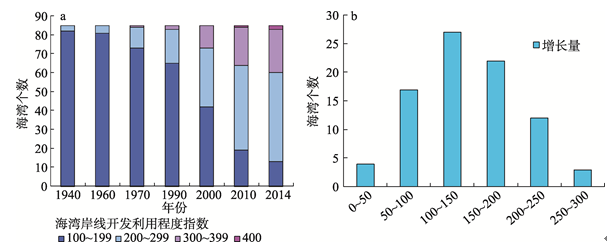
Fig. 2 Changes of shoreline utilization degree of major gulfs in China during the past 70 years图2 近70年中国大陆沿海主要海湾的岸线开发利用程度变化 |
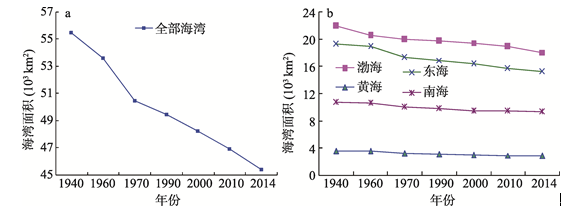
Fig. 3 Area changes of major gulfs in China during the past 70 years图3 近70年中国大陆沿海主要海湾面积变化 |
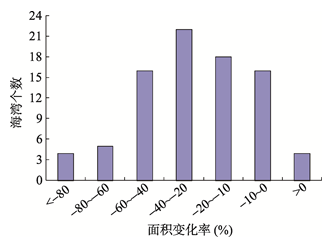
Fig. 4 Frequencies of gulf with different area change rates in China during the past 70 years图4 近70年中国大陆沿海主要海湾的面积变化率分级统计 |
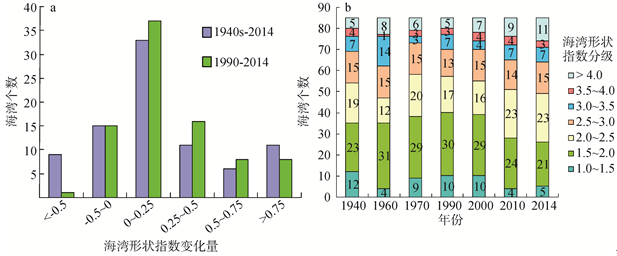
Fig. 5 Statistical characters of gulf shape index in China during the past 70 years图5 近70年中国大陆沿海主要海湾形状指数的统计特征 |
Tab. 4 Changes of gulf shape index in China during the past 70 years表4 近70年中国大陆沿海主要海湾形状指数的变化 |
| 海区 | 1940s | 1960s | 1970s | 1990 | 2000 | 2010 | 2014 | 1940s-2014年变化 | 1990-2014年变化 | |
|---|---|---|---|---|---|---|---|---|---|---|
| 平 均 值 | 黄海 | 1.94 | 2.15 | 1.87 | 1.89 | 1.93 | 2.12 | 2.19 | 0.26 | 0.30 |
| 渤海 | 2.01 | 2.03 | 1.85 | 1.91 | 2.01 | 2.49 | 2.51 | 0.51 | 0.60 | |
| 东海 | 2.62 | 2.72 | 2.52 | 2.55 | 2.56 | 2.71 | 2.78 | 0.16 | 0.24 | |
| 南海 | 3.09 | 3.35 | 2.90 | 2.91 | 2.96 | 2.96 | 3.01 | -0.08 | 0.11 | |
| 所有 | 2.44 | 2.60 | 2.32 | 2.35 | 2.38 | 2.55 | 2.62 | 0.18 | 0.27 | |
| 最 大 值 | 黄海 | 2.95 | 3.40 | 2.98 | 3.13 | 3.13 | 3.37 | 4.24 | 1.84 | 1.77 |
| 渤海 | 2.97 | 3.06 | 2.62 | 2.70 | 3.01 | 4.24 | 4.00 | 1.21 | 1.30 | |
| 东海 | 5.27 | 5.65 | 5.50 | 5.46 | 5.63 | 5.76 | 5.75 | 3.14 | 2.58 | |
| 南海 | 6.31 | 7.24 | 4.81 | 4.84 | 4.89 | 4.89 | 4.90 | 0.82 | 0.89 | |
| 最 小 值 | 黄海 | 1.18 | 1.40 | 1.06 | 1.07 | 1.07 | 1.40 | 1.34 | -0.89 | -0.12 |
| 渤海 | 1.37 | 1.38 | 1.38 | 1.46 | 1.49 | 1.53 | 1.40 | -0.03 | -0.26 | |
| 东海 | 1.59 | 1.72 | 1.66 | 1.64 | 1.61 | 1.65 | 1.63 | -0.81 | -0.11 | |
| 南海 | 1.49 | 1.64 | 1.55 | 1.51 | 1.55 | 1.55 | 1.53 | -1.48 | -1.61 |
注:加黑的数字同时也是所有海湾的最大值或最小值. |
Tab. 5 Characters of gulf-centroid movement in China during the past 70 years表5 近70年中国大陆沿海主要海湾的重心位移特征 |
| 位移距离(km) | 1940s-1990年 | 1990s-2014年 | 1940s-2014年 |
|---|---|---|---|
| < 0.5 | 29 | 53 | 19 |
| 0.5~1 | 21 | 10 | 22 |
| 1~2 | 17 | 17 | 21 |
| 2~3 | 7 | 1 | 10 |
| 3~4 | 9 | 1 | 5 |
| 4~5 | 2 | 2 | 4 |
| > 5 | 0 | 1 | 4 |
| 最大值(km) | 4.57 | 13.14 | 14.30 |
| 最小值(km) | 0.00 | 0.00 | 0.06 |
| 平均值(km) | 1.20 | 0.77 | 1.70 |
| 位移速度(m/a) | 26.68 | 31.98 | 24.27 |
The authors have declared that no competing interests exist.
| [1] |
Editorial Board of China Bay Survey. Survey of China Bays (Vol. 2). Beijing: China Ocean Press, 1997.
[中国海湾志编纂委员会. 中国海湾志(第二分册). 北京: 海洋出版社. 1997.]
|
| [2] |
[
|
| [3] |
|
| [4] |
|
| [5] |
|
| [6] |
|
| [7] |
|
| [8] |
[
|
| [9] |
[
|
| [10] |
[
|
| [11] |
[
|
| [12] |
[
|
| [13] |
[
|
| [14] |
[
|
| [15] |
|
| [16] |
[
|
| [17] |
[
|
/
| 〈 |
|
〉 |