

1 引言
提高田块灌溉用水利用效率和优化作物整体空间格局,是提升粮食生产用水效率的两个主要途径[18]。前者已在节水灌溉技术改进[19-20]、地膜覆盖[21]、氮肥[22-23]和生物炭[24]的适度添加等方面进行探索,研究较为丰富[25⇓-27];后者则相对较少,虽然有大量开展作物格局优化的相关研究,但其如何对区域水资源产生影响的相关研究几乎没有。目前,国内外学者针对作物格局优化的研究主要分为基于适宜性评价和基于历史时空动态变化规律。基于适宜性评价方面,Branco等[28]根据农业发展潜力评价结果,应用网络平衡模型对巴西新增大豆和玉米种植面积总量在相关州进行优化分配,以实现经济利益最大化和温室气体排放最小化的目标。柯新利等[29]基于耕地适宜性评价结果,采用元胞自动机模型对武汉城市圈耕地进行格局优化,以实现保障粮食安全同时释放耕地非农化压力的目的。基于历史时空动态变化方面,王秋香[30]对佛山市耕地利用变化驱动机制进行分析,并引入SLEUTH模型对建设用地发展优先、耕地保护优先以及两者兼顾的3种情景进行耕地格局优化模拟,以求在“吃饭”和“建设”中寻求平衡。
总体来说,现有关于作物格局或粮食生产格局优化的研究多面向粮食增产或综合社会经济效益,尺度多聚焦于市级与省级,全国视角下作物格局优化对区域水资源的影响仍不清楚。此外,已有研究多是基于耕地现有状况,而未考虑作物生产过程中因种类不同带来的差异,少数研究即使考虑作物类型,使用的也多以行政单元为单位而非像元尺度,对格局优化的阐述作用有限。基于上述考虑,本文面向粮食生产保障与水资源可持续利用的协同,在现有耕地上,以保障粮食产量同时减少水资源消耗、降低区域水资源压力为目标,采用像元尺度作物产量、用水量、区域水资源压力等数据,对中国主要作物(大豆、水稻、玉米、小麦)进行格局优化,并从作物用水效率和水资源压力两方面开展水资源效应分析。本文通过采用区分作物种类的差异化评估,充分考虑因作物种类不同而导致的环境需求和影响不同,使研究更具针对性;同时,讨论了不同优化实施尺度(全国统一优化、分农业区优化、分省优化)对结果的影响,为探讨作物格局优化下水资源效应分析提供了较为全面的视角。
2 数据与方法
2.1 研究对象与数据来源
表1 数据来源
Tab. 1
2.2 水资源影响评估体系建立
式中:
作物的总用水量分为灌溉农田灌溉用水量和降雨使用量,以及雨养农田用水量,计算表达式如下:
式中:
式中:
2.3 基于规划目标优化作物的格局方法
CPLEX是一种用于提高效率、快速实现策略的数学优化技术[37],能提供灵活的高性能优化程序,解决线性规划、二次方程规划、二次方程约束规划和混合整数规划问题。本文利用Python语言调用CPLEX优化模型,对全国、农业区和省域三种优化实施尺度下依次进行作物格局优化模拟。考虑到作物种植的地域化特点,局地格局调整更具现实意义,因此本文以作物的分省格局优化结果为主进行分析讨论,并对不同优化实施尺度的模拟结果进行对比。优化过程中,将产量不降低且高效利用耕地作为约束条件,水资源影响最小化作为目标条件。
2.3.1 目标函数的确定
本文以作物生产的水资源消耗和区域水资源压力最小化为优化目标,函数表达式如下:
式中:
2.3.2 约束函数的选取
本文是基于作物产量不降低、高效利用现有耕地的前提下进行的优化,因此约束条件分别为各作物产量不降低和复种合理并最大化;
(1)各作物产量不降低:
式中:
(2)复种合理并最大化:
基于各种植区域内作物的可复种模式[38],采取复种最大化的方式分配作物种植面积。
2.4 优化效应评价指标
2.4.1 水资源利用情况
本文使用总用水量、单位产量总用水量、灌溉耗水和平均基线水压力4个指标分析作物水资源利用情况,并以此描述优化效果。平均基线水压力的计算表达式如下:
式中:
2.4.2 作物种植最小耕地面积
本文的作物格局优化是在有限的耕地上,以粮食产量不降低的同时作物生产水资源影响最小化为原则开展,力求提高复种来减小耕地使用面积。因此在相应复种区域内充分考虑4种作物的复种模式,以计算现有状况作物种植的最小耕地面积(表2)并在后续计算其优化效果。
表2 现状耕地面积计算公式
Tab. 2
| 种植区划[38] | 计算表达式 |
|---|---|
| 单作区 | SUM(所有作物) |
| 北方双熟区1 | Max(冬小麦, 中稻+玉米)+其余作物 |
| 北方双熟区2 | Max(冬小麦, 大豆+玉米)+其余作物 |
| 南方双熟区 | Max(冬小麦, 大豆+早稻+中稻+晚稻+玉米)+其余作物 |
| 南方三熟区1 | Max(冬小麦, 中稻+Max((大豆+玉米+早稻+晚稻)/2), Max(大豆, 玉米, 早稻, 晚稻))+其余作物 |
| 南方三熟区2 | Max(冬小麦, 中稻+Max((大豆+玉米+早稻+晚稻)/2), Max(大豆, 玉米, 早稻, 晚稻))+其余作物 |
3 结果与分析
3.1 优化概况
分省对4种主要作物进行格局优化,优化使得作物普遍从水压力大的区域向水压力小的区域转移,作物平均水压力降低36.38%(表3)。优化后总用水量减少3.63×10¹⁰ m3(降幅为9.60%);灌溉耗水量减少1.56×10¹⁰ m3(降幅为19.01%);平均基线水压力从1.42降至0.90。播种面积变化幅度较小,由优化前9.35×10⁷ hm2降至9.05×10⁷ hm2(降幅为3.29%)。理想情况下,4种作物用地总面积由7.04×10⁷ hm2(优化前后均假设4种作物以最大复种模式种植时所占用的最小耕地面积)降至6.11×10⁷ hm2,降幅13.14%。
表3 优化前后各指标变化情况
Tab. 3
| 用地总面积(hm2) | 播种总面积(hm2) | 总用水量(m3) | 总灌溉耗水量(m3) | 平均基线水压力 | |
|---|---|---|---|---|---|
| 优化前 | 7.04×10⁷ | 9.35×10⁷ | 3.78×10¹¹ | 8.19×10¹⁰ | 1.42 |
| 优化后 | 6.11×10⁷ | 9.05×10⁷ | 3.42×10¹¹ | 6.63×10¹⁰ | 0.90 |
| 优化效果(%) | 13.14 | 3.29 | 9.60 | 19.01 | 36.38 |
3.2 作物格局优化方向
在保证已有产量同时提升水资源效应的前提下,4种作物中,大豆的优化幅度最大,有1.57×10⁶ hm2的缩减空间(图1),占现有大豆播种总面积的24.89%。大豆在东北区北部和黄淮海区南部可适当调减,其缩减空间最大的黑龙江省(6.06×10⁵ hm2)和安徽省(3.60×10⁵ hm2)分别由松嫩平原北部、华北平原南部向三江平原北部、松嫩平原中部和长江中下游平原中部转移(图2)。水稻主要在长江中下游区和华南区进行格局调整,即长江中下游区的江苏、安徽、湖北省向长江两侧聚集,湖南省的洞庭湖平原和沅江流域分布增多,江西省则转移至赣江两侧,华南区多向两广丘陵中部聚拢,水稻布局优化可缩减播种面积6.70×10⁵ hm2(降幅为2.29%)。玉米整体向东北方向转移,主要在东北区和黄淮海区进行调整,优化可缩减播种空间1.60×10⁶ hm2(降幅为4.65%),播种面积优化空间最大的黑龙江省(3.72×10⁵ hm2)和吉林省(2.85×10⁵ hm2)主要向松嫩平原中部和三江平原北部转移。小麦在维持现有产量的前提下,基于区域水压力和作物产量间的权衡,播种面积需增加7.62×10⁵ hm2(增幅为3.25%)。布局调整使得小麦在湖北、安徽、河南、四川省的播种面积较优化前轻微上升(增幅为4.29%),与优化前相比,总用水量下降4.25%,平均单位产量基线水压力降低59.09%,水资源状况得到显著改善。
图1
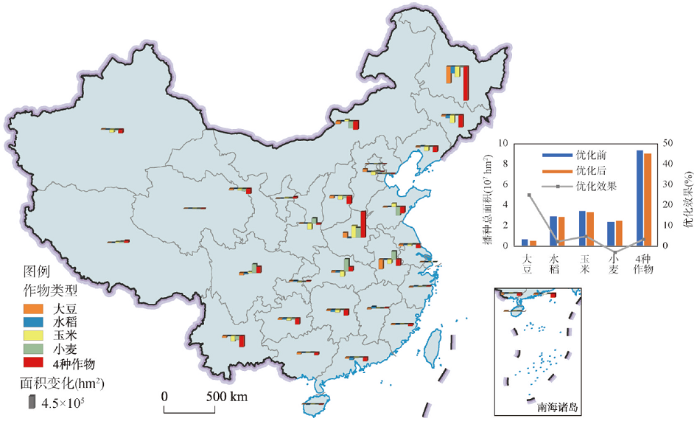
图1
优化后各省份主要作物播种面积变化
注:基于自然资源部标准地图服务网站审图号为GS(2019)1823号标准地图制作,底图边界无修改;港澳台数据暂缺;柱状图向上表示面积增加,向下表示面积减少。
Fig. 1
Changes of sown area in each province after optimization
图2
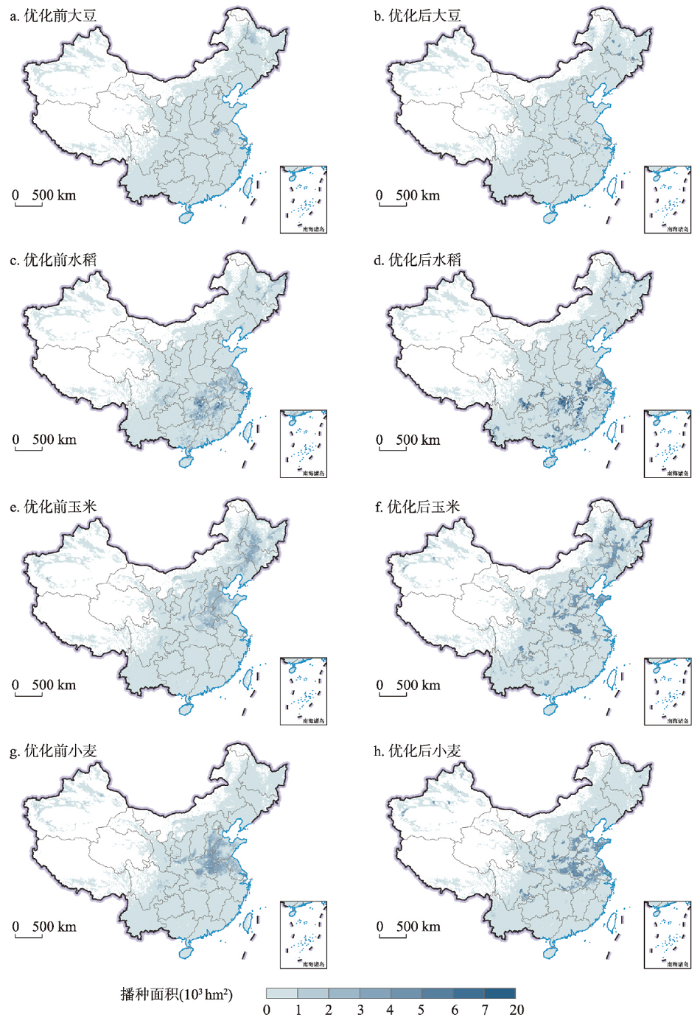
图2
优化前后作物播种面积空间分布
注:基于自然资源部标准地图服务网站审图号为GS(2019)1823号标准地图制作,底图边界无修改;港澳台数据暂缺。
Fig. 2
Distribution of crop sown area before and after optimization
图3
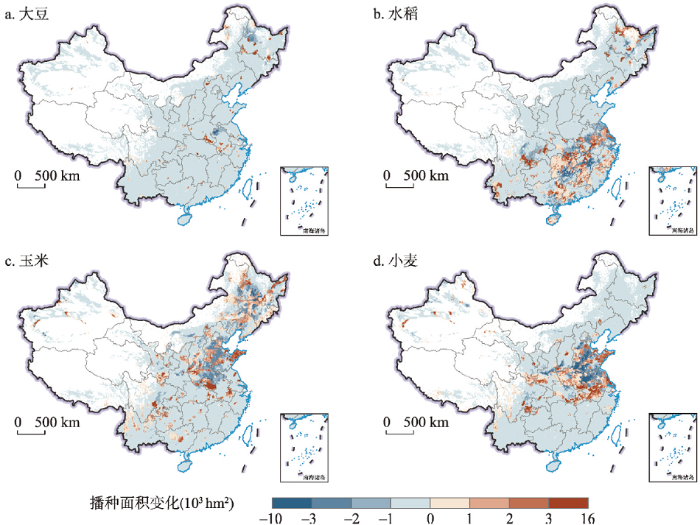
图3
优化后播种面积空间变化
注:基于自然资源部标准地图服务网站审图号为GS(2019)1823号标准地图制作,底图边界无修改;港澳台数据暂缺。
Fig. 3
Spatial variation of sown area after optimization
3.3 作物格局优化的水资源效应分析
3.3.1 作物总用水量影响分析
作物格局优化使得25个省份总用水量减少(图4),6个省份总用水量增加,总用水量净减少3.63×10¹⁰ m3(降幅达9.60%)。25个省份总用水量共减少3.71×10¹⁰ m3,其中黑龙江、安徽和云南三省的总用水量减少最多,可减少1.73×10¹⁰ m3,占总减少量的46.56%。其余6个省份总用水量共增加8.15×10⁸ m3,河南、湖北和重庆三省份的总用水量变化明显,占总增加量的93.46%。4种作物中,格局优化使得水稻总用水量减少最多,为1.75×10¹⁰ m3(占总降幅的48.21%);小麦总用水量不减反增,约增加4.54×10⁸ m3(增幅为0.59%),主要因为本文采用4种作物协同优化,优化过程中存在其他作物与小麦的权衡以保障整体水资源效应最优。
图4
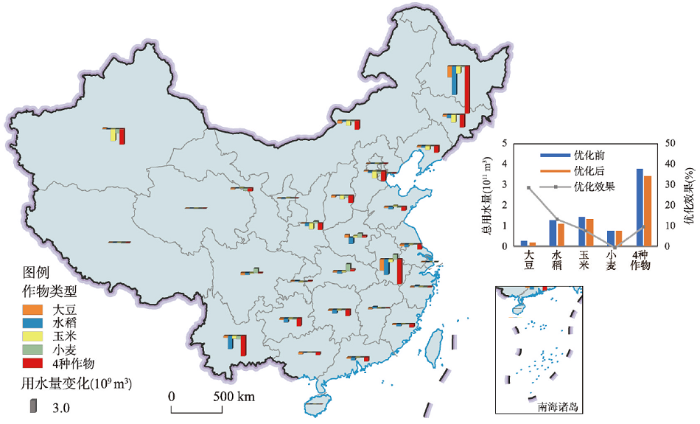
图4
优化后各省份总用水量变化
注:基于自然资源部标准地图服务网站审图号为GS(2019)1823号标准地图制作,底图边界无修改;港澳台数据暂缺;柱状图向上表示用水量增加,向下表示用水量减少。
Fig. 4
Changes of total water consumption in each province after optimization
东北区的总用水量主要集中在三江平原北部(水土资源优良)、松嫩平原中部,松嫩平原北部工业和生活用水量大[33],因此将作物适当迁移可缓解局部区域用水紧张的问题。黄淮海区虽是中国重要的粮仓[39-40],但存在水资源短缺[41]、小麦需水关键期与降水不匹配等多种问题,导致其地下水采补失衡并面临严重的地下水位下降问题[42],优化后作物总用水量向山东半岛(降雨量大,生活、工业用水量小)和黄河流域附近(水压力较小)集中[43],通过格局调整将使作物转移至水资源丰富区域,减少地下水灌溉量,缓解地下水位下降。长江中下游区北部的安徽和江苏等省份,优化后作物总用水量南移,集中在长江流域周边(作物单产用水量低,区域水压力较小)。整体来看,作物在优化后普遍从低密度的广覆盖模式转为多点聚集状态,即向该作物用水效率较高且水资源压力较小的地方聚集。
格局优化将提升作物生产的总体水分利用效率,使作物的平均单位产量总用水量从49.46 m3/GJ降至44.72 m3/GJ。若将作物单位产量总用水量分成6个等级(图5),大豆在布局调整的过程中有27.22%产量的用水量从≥ 75 m3/GJ向45~75 m3/GJ的地块转移,总用水量大幅减少。14.47%水稻的用水量从≥ 45 m3/GJ向0~45 m3/GJ的地块转移,玉米则有7.65%的产量从30 m3/GJ以上的地块向0~30 m3/GJ地块转移。小麦用水量在0~15 m3/GJ的地块有3.64%的提升,但有7.47%的产量向≥ 45 m3/GJ的地块转移,因此小麦整体的总用水量呈小幅增加状况。总体来说,大豆单位产量总用水量最高,为131.81 m3/GJ,优化后降至93.73 m3/GJ,但仍为其余作物两倍之多。
图5
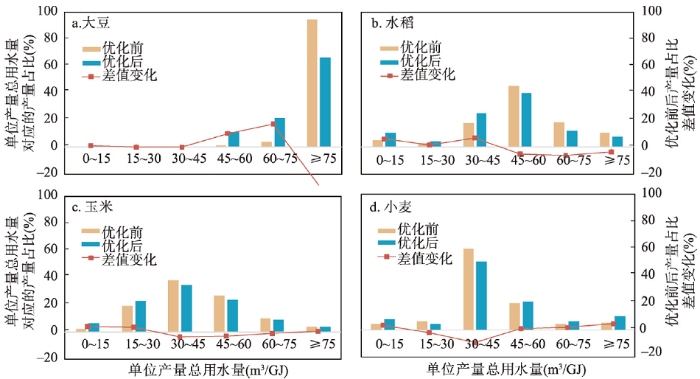
图5
优化前后作物单位产量总用水量分级统计
Fig. 5
Grading statistics of total water consumption per unit yield of crops before and after optimization
3.3.2 作物灌溉耗水量影响分析
作物格局优化使得灌溉耗水量在25个省份有所减少,减量为1.65×10¹⁰ m3(图6),其中黑龙江、新疆、内蒙古和安徽四省的灌溉耗水总量减少最多,为9.73×10⁹ m3,占减少总量的58.98%。其余6个省份优化后灌溉耗水总量有所增加,约为9.54×10⁸ m3,主要分布在四川、甘肃和山东三省,占88.10%;其中甘肃和山东省总体属于较为缺水地区,优化后灌溉耗水量在数值上虽有小幅增加,但作物更多分布于区域水压力较低的地块(灌溉耗水量较优化前分别增加13.64%与1.19%;基线水压力分别降低35.98%和58.46%),综合来看优化仍具有积极意义。
图6
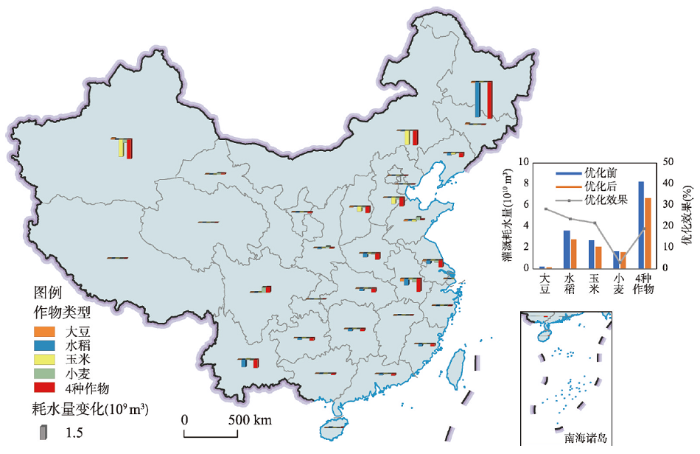
图6
优化后各省份灌溉耗水量变化
注:基于自然资源部标准地图服务网站审图号为GS(2019)1823号标准地图制作,底图边界无修改;港澳台数据暂缺;柱状图向上表示耗水量增加,向下表示耗水量减少。
Fig. 6
Changes of irrigation water consumption in each province after optimization
总体来看,播种面积分布广且灌溉耗水量大的区域,格局优化带来的耗水减量也最大(图7)。大豆在播种最广的安徽和黑龙江境内优化效果最显著,可减少灌溉耗水4.47×10⁸ m3,占大豆优化后减少总量的49.89%。水稻在灌溉耗水量消耗最大的黑龙江省减量突出,占水稻灌溉耗水减少总量的47.42%,此外,云南、安徽、河南、江苏省北部水稻的灌溉耗水减少效果也较为明显。玉米的灌溉耗水在内蒙古和新疆减少最多(两省水稻单位产量所需灌溉耗水量多且播种区域较为广阔,改善空间大),可减少3.61×10⁹ m3,占玉米灌溉耗水减少总量的60.75%;山东、河北、河南三省玉米呈现灌溉耗水增减共存的布局变动,但综合来看,灌溉耗水在各省内仍呈减少趋势。优化使得小麦在分布集中的新疆、安徽、江苏和河北省内灌溉耗水净减少量较大,存在1.19×10⁹ m3的减量空间。
图7
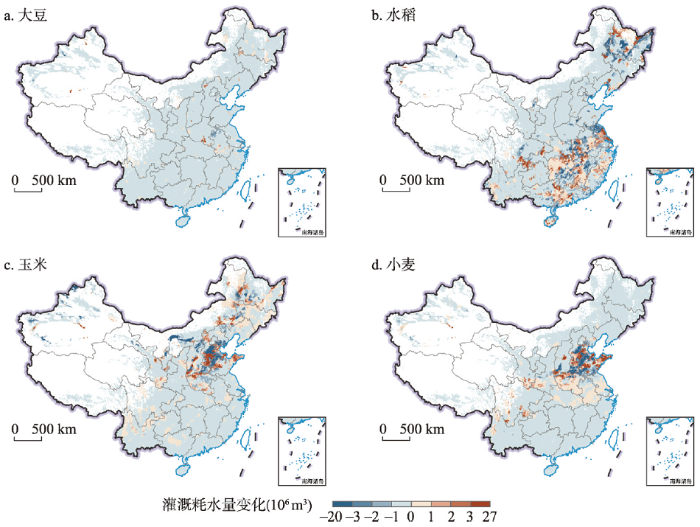
图7
优化后灌溉耗水量空间变化
注:基于自然资源部标准地图服务网站审图号为GS(2019)1823号标准地图制作,底图边界无修改;港澳台数据暂缺。
Fig. 7
Spatial variation of irrigation water consumption after optimization
3.3.3 区域水压力影响分析
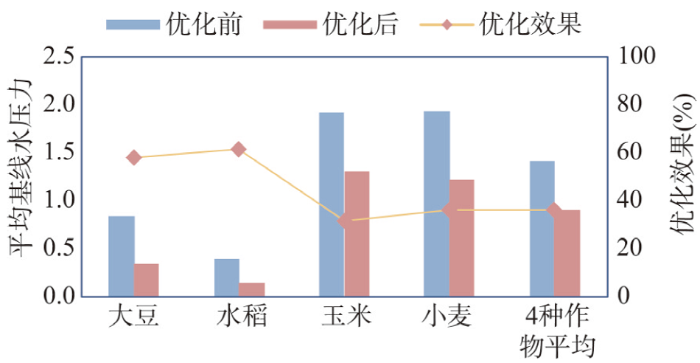
作物优化能够显著缓解作物播种区域的水压力情况。布局调整使得4种作物种植区域内的平均单位产量基线水压力从1.42降至0.90(图8),优化前后每种作物分布区域的基线水压力值降低均在30%以上,在一定程度上说明作物通过优化从相对缺水的地块移向水资源相对充足的地块。
图8
4 讨论
4.1 优化后作物分布格局的合理性
本文对作物优化主要是在区域内部进行微调,优化后的大体格局与现有粮食生产格局基本一致[44]。优化将缩减作物在内蒙古高原、华北平原和四川盆地北部的分布,而使其向东北平原、长江中下游平原和四川盆地南部聚集。其中,大豆优化后主要分布在东北区黑龙江省的松花江、嫩江、黑龙江流域附近,以及长江中下游区北部的河南、安徽和江苏省境内[45]。水稻则主要分布在东北区黑龙江省北部,四川盆地南部、东南丘陵和长江中下游平原境内,这与《中国的粮食安全》[46]中“加强建设东北稻谷优势产业带”、“打造长江经济带双季稻生产核心区”相吻合。玉米优化后主要分布在东北平原、华北平原、四川盆地南部及周边区域,与《全国优势农产品区域布局规划(2008—2015)》[47]中“着力建设北方、黄淮海和西南3个优势区”基本一致。小麦优化后主要分布在华北平原、长江中下游平原、黄土高原南部和四川盆地南部,与《中国的粮食安全》[46]中“形成黄淮海平原小麦、打造长江经济带优质专用小麦生产核心区、发展西南小麦种植”相契合。
4.2 不同尺度作物格局优化下水资源效应的对比分析
为明确不同优化实施尺度对水资源效应的影响差异,研究分别开展了全国、农业区和省域的3种实施尺度作物格局优化模拟。发现全国范围统一进行的作物格局优化中,4种作物的平均单位产量基线水压力都有明显降低(表4),且均优于其余两级的优化效果;一定程度上可以说明以全国为优化单元的作物布局能够更为有效的缓解水压力问题,使作物从需水量压力较高的地块转向水资源丰富的地块。从总用水量来看,玉米在全国的优化模拟中减少最多,而大豆、水稻和小麦则是在农业分区优化中更胜一筹。从灌溉耗水量看,全国尺度优化的灌溉耗水量数值小于农业分区和分省的优化模拟结果。综合来看,以全国为优化单元的作物格局在区域水资源压力和作物用水效率方面均是最优选择,但其优化结果存在作物调整调度大的问题,也未考虑各地区已形成的作物种植习惯,因此可行性较差。分省优化的效果虽然略差,但作物调整规模较小,与实际种植习惯相符,易于实现。农业分区优化模拟的优化效果和可实现性则位于上述两种优化之间。后续可将格局调整与已有的饮食习惯和生产习惯等加以考量[48],深入研究不同优化方案的水资源效应和可行性。
表4 全国、农业区、省域优化结果对比
Tab. 4
| 优化前 | 全国优化 | 农业分区优化 | 分省优化 | |
|---|---|---|---|---|
| 播种总面积(hm2) | 9.35×10⁷ | 1.09×10⁸ | 8.88×10⁷ | 9.05×10⁷ |
| 播种面积大豆(hm2) | 6.29×10⁶ | 4.06×10⁶ | 3.27×10⁶ | 4.73×10⁶ |
| 播种面积水稻(hm2) | 2.93×10⁷ | 2.86×10⁷ | 2.83×10⁷ | 2.86×10⁷ |
| 播种面积玉米(hm2) | 3.45×10⁷ | 3.96×10⁷ | 3.31×10⁷ | 3.29×10⁷ |
| 播种面积小麦(hm2) | 2.35×10⁷ | 3.67×10⁷ | 2.41×10⁷ | 2.43×10⁷ |
| 总用水量(m3) | 3.78×10¹¹ | 3.20×10¹¹ | 3.13×10¹¹ | 3.42×10¹¹ |
| 总用水量大豆(m3) | 2.77×10¹⁰ | 1.96×10¹⁰ | 1.49×10¹⁰ | 1.97×10¹⁰ |
| 总用水量水稻(m3) | 1.30×10¹¹ | 1.12×10¹¹ | 1.07×10¹¹ | 1.12×10¹¹ |
| 总用水量玉米(m3) | 1.44×10¹¹ | 9.57×10¹⁰ | 1.19×10¹¹ | 1.33×10¹¹ |
| 总用水量小麦(m3) | 7.66×10¹⁰ | 9.27×10¹⁰ | 7.19×10¹⁰ | 7.71×10¹⁰ |
| 灌溉耗水总量(m3) | 8.19×10¹⁰ | 4.40×10¹⁰ | 6.18×10¹⁰ | 6.63×10¹⁰ |
| 灌溉耗水量大豆(m3) | 2.35×10⁹ | 1.02×10⁹ | 1.06×10⁹ | 1.69×10¹⁰ |
| 灌溉耗水量水稻(m3) | 3.61×10¹⁰ | 2.39×10¹⁰ | 2.89×10¹⁰ | 2.76×10¹⁰ |
| 灌溉耗水量玉米(m3) | 2.70×10¹⁰ | 8.20×10⁹ | 1.75×10¹⁰ | 2.12×10¹⁰ |
| 灌溉耗水量小麦(m3) | 1.64×10¹⁰ | 1.09×10¹⁰ | 1.44×10¹⁰ | 1.59×10¹⁰ |
| 单产平均基线水压力 | 1.42 | 0.33 | 0.91 | 0.90 |
| 单产基线水压力大豆 | 0.84 | 0.07 | 0.49 | 0.35 |
| 单产基线水压力水稻 | 0.40 | 0.08 | 0.13 | 0.15 |
| 单产基线水压力玉米 | 1.92 | 0.18 | 1.34 | 1.31 |
| 单产基线水压力小麦 | 1.93 | 1.00 | 1.19 | 1.22 |
| 用地总面积(hm2) | 7.04×10⁷ | 6.06×10⁷ | 6.04×10⁷ | 6.11×10⁷ |
4.3 格局优化方法的不确定性分析与改进
5 结论
本文基于现有耕地,面向粮食生产保障与水资源可持续利用的协同,以保证粮食产量的同时减少水资源消耗、降低区域水资源压力为目标,基于像元尺度作物产量、用水量、区域水资源压力等数据,开展中国主要作物(大豆、水稻、玉米、小麦)格局优化,并从作物用水效率和水资源压力两方面分析其水资源效应,研究发现:
(1)通过合理的作物布局调整可在保障粮食产量的同时,降低水资源消耗和水资源压力,并减少播种面积和耕地使用面积。优化可减少总用水量约3.63×10¹⁰ m3(降幅为9.60%);降低灌溉耗水量约1.56×10¹⁰ m3(降幅为19.01%);平均基线水压力可从1.42降至0.90。缩减播种面积3.08×10⁶ hm2(降幅为3.29%);最小耕地使用面积可由7.04×10⁷ hm2降至6.11×10⁷ hm2,平均复种指数提高0.15。
(2)不同作物的优化方向并不一致,大豆在东北区北部和黄淮海区南部应调减,水稻主要在长江中下游区和华南区中部进行格局调整,玉米整体向东北方向转移,主要在东北区和黄淮海区进行调整,而小麦主要在黄淮海区与长江中下游区北部进行调整;
(3)作物协同优化下,小麦灌溉耗水可降低3.08%为5.05×10⁸ m3,大豆、水稻、玉米3种作物的减少幅度均在20%~30%,分别减少6.63×10⁸ m3、8.52×10⁹ m3、5.88×10⁹ m3;
(4)不同省份优化后的水资源效应有所不同,黑龙江、新疆、内蒙古、安徽四省(区)作物格局优化对灌溉耗水的减少量贡献最大,共减少9.73×10⁹ m3,占灌溉耗水减少总量的58.98%;四川、甘肃和山东则主要体现为作物向水资源压力更小的区域转移,但灌溉耗水量有小幅增加。
参考文献
Study on the matching pattern of water and potential arable land resources in China
DOI:10.31497/zrzyxb.20171204
[本文引用: 2]

Most previous studies have focused on the matching pattern of actual arable land and water resources in China. However, due to the lack of valid data about potential arable land resources, the matching pattern of potential arable land and water resources has seldom been investigated. In this paper, based on the potential arable land resources retrieved from remote sensing data, the matching degree of potential arable land resources with water resources in China was evaluated by using two indexes, i.e., water resource per unit area and Gini coefficient. First of all, according to the filter conditions suitable for crop cultivation, the spatial distribution of potential arable land area in China was retrieved from three indexes including DEM, slope and soil type. Then, the water resource per unit area of potential arable land in China were calculated, and the spatial matching degree of the raw water and soil resources in China was evaluated. Finally, we drew the Lorenz curve of water and land resources, calculated the Gini coefficient, and evaluated the overall matching pattern of water resource with potential arable land resource in China. The results showed that: 1) The potential arable land varied greatly in China that the area of potential arable land in northern China was much larger than that in southwestern China and east coastal regions. This indicated that in the future the potential arable land would be mainly located in the northern region. 2) There was a serious mismatching between the water resource and potential arable land resource in China. 3) The matching degree of water resource with potential arable land resource was extremely poor. About 80% of water resource served less than 23% of potential arable land in China. The Gini coefficient of water resource with arable land resource which was 0.712 in the whole country, was much higher than that of agricultural water use with farmland resources, which was 0.566. The matching degree of agricultural water and farmland resource was better than that of potential arable land and water resource, which was the result of human activities. This indicated that the Gini coefficient, calculated by the potential arable land without considering the water resource restriction, was much more suitable for expressing the matching degree of water and land resources. This study can provide scientific basis for us to take effective measures to adapt to the background matching pattern.
中国水土资源本底匹配状况研究
DOI:10.31497/zrzyxb.20171204
[本文引用: 2]
论文以中国水资源二级区为基本单元,利用单位面积水资源量法和基尼系数法,以二级区水资源总量和潜在可开垦耕地面积为数据基础,评价中国水土资源本底匹配状况,为中国水土资源优化配置提供科学依据。首先根据适宜农作物耕种的高程、坡度和土壤类型条件,得到中国潜在可开垦耕地分布;然后,计算单位潜在可开垦耕地面积水资源量,评价中国水土资源本底匹配分布状况;最后,绘制水土资源洛伦兹曲线,计算基尼系数,对中国水土资源本底匹配总体状况进行评价。研究结果表明: 1)中国北部区域潜在可开垦耕地较多,西南部和南部沿海区域分布较少,未来具有较大耕地开发潜力的区域主要分布在北方; 2)中国本底水资源和潜在可开垦耕地资源空间分布存在严重错位; 3)较之已有研究成果中依据水资源量和耕地面积计算的基尼系数0.566,论文以本底水资源和潜在耕地为基础数据计算的基尼系数0.712要大很多,表征中国本底水土资源不匹配程度要严重得多,中国80%的水资源服务不到23%的潜在可开垦耕地。
Peak grain forecasts for the US High Plains amid withering waters
Sustainable irrigation based on co-regulation of soil water supply and atmospheric evaporative demand
Irrigation is an important adaptation to reduce crop yield loss due to water stress from both soil water deficit (low soil moisture) and atmospheric aridity (high vapor pressure deficit, VPD). Traditionally, irrigation has primarily focused on soil water deficit. Observational evidence demonstrates that stomatal conductance is co-regulated by soil moisture and VPD from water supply and demand aspects. Here we use a validated hydraulically-driven ecosystem model to reproduce the co-regulation pattern. Specifically, we propose a plant-centric irrigation scheme considering water supply-demand dynamics (SDD), and compare it with soil-moisture-based irrigation scheme (management allowable depletion, MAD) for continuous maize cropping systems in Nebraska, United States. We find that, under current climate conditions, the plant-centric SDD irrigation scheme combining soil moisture and VPD, could significantly reduce irrigation water use (-24.0%) while maintaining crop yields, and increase economic profits (+11.2%) and irrigation water productivity (+25.2%) compared with MAD, thus SDD could significantly improve water sustainability.© 2021. The Author(s).
Water-food-energy nexus: Progress, challenges and prospect
DOI:10.11821/dlxb202107002
[本文引用: 1]
The water-food-energy nexus (WFE) plays a key role in achieving sustainable development. In this study, we systematically analyzed the concept of the WFE nexus and review its recent progress. We found that the academic communities have not reached a unanimous understanding of the concept of the WFE nexus and research framework. The evaluation methodology of the WFE nexus presents a transition from the traditional sectoral research paradigm to the human-environment system paradigm that considers the intersection of natural science and social science. These methods can also be grouped into three categories: an evaluation based on a critical process, an evaluation based on the whole system, and a comprehensive evaluation that involves coupling the internal and external elements of the WFE nexus. A bibliometric analysis shows that the number of research papers concerning the WFE nexus increased exponentially during 2000 to 2019, and the increase was particularly significant after 2015. Environmental science, food science, and nutrition science are the three main disciplines in WFE nexus research. More important, we need to strengthen the application of geography thinking, that is, comprehensive and systematic thinking, to study the WFE nexus in the future. Based on the literature review, we found that existing research lacked a quantitative understanding of the mutual feedback among the WFE nexus and its evolution. Therefore, we suggest the following five priority areas for future research: establishing a multi-source database of the WFE nexus, revealing the mutual feedback mechanism of the WFE nexus, developing a coupling model of the WFE nexus, establishing a decision-making platform for the WFE nexus, and promoting the collaboration of multiple sectors related to the WFE nexus. This will help to achieve a synergetic sustainable development of the WFE nexus through system governance and scientific management.
水—粮食—能源纽带关系研究进展与展望
DOI:10.11821/dlxb202107002
[本文引用: 1]
水—粮食—能源纽带关系是实现社会经济可持续发展的重要支撑与关键途径。本文系统梳理了纽带关系的概念内涵,回顾了纽带关系的近今进展,发现当前学界对纽带关系的概念内涵和研究框架尚未达成较为一致的认识。在评估方法上,可归纳为基于关键过程视角的评估、基于系统整体视角的评估以及耦合纽带系统内外部要素的综合评估,呈现出由传统部门研究范式到自然科学和社会科学交叉的人地系统耦合研究范式的转变。文献计量分析表明,2000—2019年纽带关系研究发文量呈指数增长,且2015年之后增加尤为显著。在学科分布上,环境科学、食品科学和营养学是研究纽带关系的主要学科,未来应加强地理学的综合性和系统性思维在纽带关系研究中的应用。通过文献回顾发现,当前研究对纽带系统的互馈关系及其演化特征缺乏定量化理解,建议未来应重点关注以下五个前沿议题,即建立纽带关系多源信息数据库、揭示纽带关系耦合系统互馈机理、发展纽带关系耦合系统过程模型、搭建纽带关系耦合系统决策平台以及促进纽带关系多部门协同合作,旨在通过系统治理和科学管控,实现纽带关系系统协同可持续发展。
Situation of land-water resources and analysis of sustainable food security in China
DOI:10.11849/zrzyxb.2002.03.002
[本文引用: 1]
The early stage of the21st century will be the important time that China will witness rapid promotion of industrialization and urbanization and move towards higher degree.It is also a crucial period that China integrates into the world economy and enters the steady and continuous stage of social and economic development.However,such factors as trending towards constant growth of population,the speeding process of industrialization and urbanization,the formation of integration pattern of global trade,the transition of civil system and institution will make human-land conflict more intense,market competition unprecedented severe in China,which,undoubt-edly,have tremendous effect on the resource base of China's agricultural production and the sup-ply-demand balance of agricultural products,so,China's food security will be faced with chal-lenge.Based on the situation analysis of the water-land resources and its influence on food secu-rity in China,this paper puts forward that the shortage of water-land quantity and deficient matching between their distribution will affect directly on Chinese food security,and the quantity of food shortage will reach760×10 8 kg.However,the realization of the objectives of Chinese food security must rest on sustainable development of China's agriculture and rural economy in the21st century,so the primary strategy ensuring China's sustainable food security is to select the developing orientation and model with industrialization,ecologicalization,internationalization and localization as character in order to establish a domestic sustainable agriculture and rural eco-nomic system,and lay stress on optimizing the institutional environment,consummating the guar-anteeing system and breaking through the structural constraints to further reform and innovation.
中国水土资源态势与可持续食物安全
Analysis of the matching patterns of land and water resources in Northeast China
DOI:10.11821/xb200608007
[本文引用: 1]
<p>Northeast China is an important base to the national food security. There are more problems in achieving optimal allocation of land and water resources as well as sustainable utilization. At present water resources shortage and land degradation are the two most important factors restricting agricultural sustainable development in Northeast China. Improving the matching degree of land and water resources and guaranteeing supplement level of irrigated water resources have becoming long-term goals to promote the high-efficient utilization of agricultural resources and upgrade the comprehensive productivity of food. The matching coefficient of land and water resources (R<sub>i</sub>), which is an indicator to reflect the proportion of water supply and cultivated land resources in spatio-temporal scale in a specific zone. The purpose of using this indicator is to investigate the balance between water supply and land resources in temporal and spatial distributions and their corresponding matching degree. Based on the dynamic analysis of gross land and water resources and their matching degree in Northeast China, this paper establishes a matching model of agricultural water and land resources. Simulation analyses indicate that the matching degree of land and water resources in Northeast China is not as good as expected, and there are distinct differences among this region. Northeast China, which possesses 16.68% of the total cultivated land in the whole country, only takes up 4.01% of the total water resources. In average, the per capita cultivated land in Northeast China is 0.309 hm<sup>2</sup>, three times that of the whole country. However, the per capita water resource in Northeast China is 1042 m<sup>3</sup>, which is only 47.7% of the whole country. The matching coefficient is 1.153, which is lower than the whole country (1.441). According to different values of Ri, the matching degree of water and land resources in Northeast China is classified into 5 grades: excellent (0.73 < R<sub>i</sub> ≤ 11.73), better (0.23 < R<sub>i</sub> ≤ 0.73), moderate (0.16 < R<sub>i</sub> ≤ 0.23), worse (0.13 ≤ R<sub>i</sub> ≤ 0.16) and worst (0 < R<sub>i</sub> < 0.13). Accordingly, the basic approach of enhancing the matching degree of land and water resources is to construct water conservancy projects in Northeast China. Attention should be paid to large-scale water transportation projects like "North to South Water Transfer Project", supplemented by midium- and small-scale water conservancy projects. Moreover, development of high-efficiency, water-saving modern agriculture with well-trench irrigation system should be strengthened as well.</p>
中国东北地区农业水土资源匹配格局
The change of the main regions for China's foodgrain production and its implications
The study showed that the main regions for China's foodgrain production have shifted from the South to the North. In the early 1970s, China's foodgrain production areas mainly clustered in the reaches of Yangtze River and Pearl River. Since 2000, the situation has changed. The main foodgrain product area mainly clustered in the reaches of Songhuajiang River, Liaohe Rivers and Huaihe River. These changes are mainly attributed to the reasons of: 1) increased cultivated land area in the reaches of Songhuajiang River and Liaohe Rivers; 2) increased yield of per unit cultivated land in the reaches of Huaihe River, which is induced by increasing irrigated area and application of chemical fertilizer. These changes have resulted in an increased expansion of cultivated land on a large scale and over exploitation of ground water as well as over application of chemicals, consequently imposing a great pressure upon ecological environment. It is suggested that provinces in the southern regions should increase the capacity of foodgrain production and realize grain self-support in order to decrease its foodgrain dependence on the North. There is still a great room on foodgrain production increase in such regions as Jiangxi province, Chongqing municipality, Guizhou province and Yunnan province. Therefore, government should earmark funds to facilitate foodgrain production in the regions mentioned above.
中国粮食生产的区域格局变化及其可能影响
研究发现,全国主要的粮食调出区已由1970年代初的松辽河区、长江区、珠江区和东南诸河区转移、集中到2000年代初的松辽河区和淮河区,传统的“南粮北运"的粮食生产格局已为“北粮南运"所取代。90年代松辽河区成为全国粮食增产中心的主要原因是耕地面积的增加导致粮食播种面积扩大,淮河区则是由于灌溉面积扩大、化肥使用量增加导致其粮食单产大幅度提高。全国粮食生产重心的“北移"加剧了北方天然草地资源的大规模开垦和水资源的过度开采,可能引发严重的生态问题。应对策略是充分挖掘南方地区的粮食生产潜力,提高其满足自身粮食需求的自给能力,从而减轻“北粮南运"带来的北方地区的资源环境压力。
Drought impacts on crop yield: Progress, challenges and prospect
DOI:10.11821/dlxb202111003
[本文引用: 1]
Food security, one of key components of national security, is a top priority for human survival and social development. In this study, we first sought to determine the influencing factors of crop yields and the process of drought impacts on crop yields. We then systematically reviewed the effects of droughts on major global crop yields from four aspects: field control experiments, statistical models, crop growth models, and remote sensing inversion models. Recent progress in crop yield impact assessment reveals that the current research has changed from single-hazard to multi-hazard, from single target to multiple targets, and from statistical models to a comprehensive model. A bibliometric analysis shows that the volume of research on drought impacts on crop yields has increased exponentially, and the related research theme has undergone a transformation from traditional research on crop water stress to comprehensive research on crop drought impacts and adaptation, reflecting the continuous deepening and integration of research perspectives. Agriculture, plant sciences, and environmental sciences are the three main disciplines in research on drought impacts on crop yields. We need to strengthen the application of geographical thinking, that is, systematic thinking concerning multiple factors and multiple scales to study the coupling of crop yields and water resources in the future. Finally, we suggest the following four priority areas for future research in consideration of the problems and challenges of the existing research: establishing a multi-source database of drought impact on crop yield, revealing the key process and mechanism of drought impacts on crop yields, developing a coupled macro and micro process crop growth model, and establishing a comprehensive monitoring platform system for crop yields and food security. This will help ensure sustainable agricultural development and global food security by improving monitoring, early warning, and scientific management of the impacts of droughts on crop yields.
干旱对作物产量影响研究进展与展望
DOI:10.11821/dlxb202111003
[本文引用: 1]
粮食安全关乎人类生存和社会发展,是总体国家安全观的重要组成部分。本文首先梳理了作物产量影响因素及干旱对作物产量的影响过程,进而从基于田间控制实验、统计模型、作物生长机理模型以及遥感反演模型等4个方面系统回顾了干旱对全球主要作物产量影响评估的最新进展,揭示出当前研究呈现出由单灾种向多灾种、由单目标向多目标、由统计模型向综合模型转变的特征。文献计量分析表明,1990—2020年干旱对作物产量影响研究发文量呈指数增长,且研究主题经历了由传统的作物水分胁迫到作物受旱影响与适应综合研究的转变过程,体现出研究视角的不断深化和综合。在学科分布上,农学、植物学和环境科学是研究干旱对作物产量影响的主要学科,建议应加强地理学多要素多尺度的系统性思维在粮食和水资源耦合系统研究中的应用。最后,在分析现有问题和挑战的基础上,将未来应关注的重要议题归纳为以下4个方面,即构建干旱对作物产量影响的多源信息数据库、阐明干旱对作物产量影响的关键过程及机理、发展耦合宏观与微观过程作物生长机理模型和搭建作物产量与粮食安全综合监测平台系统,旨在通过提高干旱对作物产量影响的监测预警和科学管控,实现农业可持续发展和全球粮食安全。
Regional pattern of grain supply and demand in China
DOI:10.11821/dlxb201608007
[本文引用: 1]
Food security has become a worldwide concern. Considering the huge population of China, the need for food security in the country cannot be overemphasized. Grain is an important source of food for the Chinese people. Therefore, it is necessary to understand grain output and deficit situation in China. In this study, with the help of GIS and Geoda analysis methods, we constructed a relationship model of grain output and deficit to understand the structure and spatial distribution. Based on population and grain statistic data from 2008 to 2012, this study took 333 prefectures and districts as objects. The results show that grain supply and demand are currently in a net surplus situation in China. There are 160 cities that could satisfy their grain needs by cultivation of grain, accounting for 48% of all prefecture units. In reference to grain supply-demand spatial distribution, there exists obvious regional differentiation, presenting grain deficit in western China, likewise for southern regions, and grain surplus in eastern and northern regions. In addition, the regularity of scale distribution is proposed. Grain supply-demand exhibits significant spatial correlation and clustering effects at provincial and prefecture levels. And lastly, the net amount of grain surplus gradually increased from 2008 to 2012. High grain-output and high grain-deficit are the dominant transfer types. The high grain-output regions make great contributions to the growing of grain surplus, accounting for 75.24% of the increment.
中国粮食供需的区域格局研究
DOI:10.11821/dlxb201608007
[本文引用: 1]
粮食安全问题在世界范围内一直被高度关注。本文主要以中国333个地级市为基本研究单元,在粮食供需现状分析的基础上,借助GIS和Geoda空间分析工具,从区域的空间差异和时空变化两个角度,建立粮食供需模型,研究中国粮食供需的结构特征和空间分布规律。结果表明:① 2012年中国粮食供需结构为净余粮,仅有约52%的地级市能通过粮食生产保障基本粮食需求。② 粮食供需的空间分布具有区域差异性,基本呈现西缺粮东余粮,南缺粮北余粮的特点;③ 在省域和地级市两种空间单元尺度上,粮食供需有一定的规律,表现出明显相关性,呈集聚状态。④ 2008-2012年,中国的净余粮量增加,高余粮和高缺粮是主要的变化类型,其中高余粮区对余粮量增长的贡献率达到75.24%。
The impact of cropland spatial shift on irrigation water use in China
The impact of cultivated land spatial shift on food crop production in China, 1990-2010
DOI:10.1002/ldr.v29.6 URL [本文引用: 1]
The adjustment of China's grain cropping structure and its effect on the consumption of water and land resources
DOI:10.31497/zrzyxb.20190102
[本文引用: 1]
Estimation of the effect of grain production adjustment on the consumption of water and land resources will help to formulate the strategy for sustainable agricultural development. Since the mid and late 1990s, the proportion of corn in China's grain production has been obviously improved. Taking grain cropping structure without adjustment as the base scenario, and under certain grain output, the actual grain production adjustment in China during 1996-2015 has brought about the savings of water and land resources, accounting for about 4.2% and 3.7% of current demand in grain production respectively. The adjustment of grain production comes from grain demand structure change, which helps to alleviate the consumption pressure of water/land resources in grain production to some extent, though China's dietary transformation requires more agricultural resources. At the regional level, from the effect of structural adjustment on the demand for planting area, the savings in northern regions with relatively abundant arable land resources are significantly higher than those in the south. The area saving effect is higher in the northeast and northwest regions, and the least in southeastern coastal areas. From the effect of structural adjustment on the demand for water resources, the savings in northern regions are generally higher than those in the south, the highest in the northwest region with the highest drought degree, and the water saving effect in the middle and lower reaches of the Yangtze River is minimal. During the period, the output of regional grain crops has been widely affected by the change of cropping proportion, which is the indicator of the planting benefit and implies the change of consumption demand. Feed grain demand has increased more than rice and wheat rations, making the northern region suitable for corn planting become China's main grain production area. In the southern rice region, the demand for rice is relatively limited, and the regional production advantages of wheat, corn and soybeans are also lacking, which causes the relative stagnation of grain production in the south. To this end, in southern China, the recovery of grain production and full utilization of the potential of water/heat resources mainly depend on the consumption demand for rice and farmers' planting benefit. For the northern region, in order to reduce the amount of groundwater irrigation, it is necessary to rationally control the cropping area of rice and wheat and to adjust farming system according to the law of precipitation as far as possible.
中国粮食作物种植结构调整及其水土资源利用效应
DOI:10.31497/zrzyxb.20190102
[本文引用: 1]
粮食种植结构调整会影响农业资源的消耗需求。20世纪90年代中后期以来,玉米在我国粮食生产中的地位明显提升。以粮食种植结构无调整为参照情景,一定产量下,1996-2015年,在国家层面,因粮食种植结构调整对水土资源消耗的节省量约占现期需求量的4%左右。在区域层面,从结构调整对种植面积的减省效应看,耕地资源相对丰富的北方地区明显高于南方地区;从对水资源消耗的减省效应看,北方贫水区也普遍高于南方地区,干旱度最高的西北地区最高。期间区域分品种粮食生产广泛受到作物种植比例变化的影响。研究结果表明,要充分利用好南方水热资源,恢复水稻生产,主要取决于稻米需求及其种植效益,而北方地区则要尽可能按降水规律调整农作制度,合理控制水稻、小麦的种植面积。
Multiregional input-output model for China's farm land and water use
DOI:10.1021/es503637f URL [本文引用: 1]
Tension of agricultural land and water use in China's trade: Tele-connections, hidden drivers and potential solutions
DOI:10.1021/acs.est.0c00256 URL [本文引用: 1]
Optimization of China's maize and soy production can ensure feed sufficiency at lower nitrogen and carbon footprints
DOI:10.1038/s43016-021-00300-1 [本文引用: 1]
Increased food production and reduced water use through optimized crop distribution
DOI:10.1038/s41561-017-0004-5 URL [本文引用: 1]
Improving agricultural water productivity to ensure food security in China under changing environment: From research to practice
DOI:10.1016/j.agwat.2016.05.007 URL [本文引用: 1]
Negative pressure irrigation for greenhouse crops in China: A review
Effects of alternate wetting and soil drying on the grain yield and water use efficiency of indica-japonica hybrid rice and its physiological bases
DOI:10.3864/j.issn.0578-1752.2021.07.014
[本文引用: 1]
【Objective】 This study aimed to understand the yield formation characteristics and water use efficiency (WUE) of indica/japonica hybrid rice (IJHR) cultivar and their physiological bases under alternate wetting and soil drying (AWD) regime.【Method】The field experiment was conducted at Huangtianfan Experimental Farm which belonged to China National Rice Research Institute, Hangzhou, Zhejiang province, Southeast China, in 2018 and 2019. Two newly-bred IJHR cultivars, Yongyou 1540 and Chunyou 927, and two local high-yielding japonica hybrid rice (JHR) cultivars, Changyou 5 and Jiayou 5, were field grown. Two irrigation regimes, conventional irrigation (CI) and AWD, were imposed from 7 days after transplanting to maturity. The goals of this study were to investigate the effects of AWD on the grain yield and WUE of IJHR and its physiological bases. 【Result】Compared with those under CI regime, the grain yields of JHR cultivars were significantly decreased by 12.3%-12.8% under AWD regime, whereas the difference in grain yields of IJHR cultivars was not significant between CI and AWD regimes. Compared with the CI regime, AWD significantly reduced the amount of irrigation water and significantly increased WUE by 5.9%-8.3% and 13.7%-16.8% in JHR and IJHR cultivars, respectively. In comparison with JHR cultivars, IJHR cultivars showed greater tillering capacity, larger sink size and higher grain filling rate, higher leaf area duration and crop growth rate from heading to maturity, higher root oxidation activity, leaf photosynthetic rates, and activities of sucrose synthase and adenosine diphosphate-glucose pyrophosphorylase in grains at the first and second soil drying periods as well as re-watering periods after heading.【Conclusion】IJHR cultivars could obtain higher grain yields and higher WUE than JHR cultivars under AWD regime. Stronger physiological activities of root, including higher root oxidation activity at the first and second soil drying periods as well as re-watering periods after heading, and above ground plants, including higher leaf area duration, crop growth rate from heading to maturity, greater leaf photosynthetic rates, and activities of sucrose synthase and adenosine diphosphate-glucose pyrophosphorylase in grains at the first and second soil drying periods as well as re-watering periods after heading, contributed to their better yield performance and higher WUE of IJHR cultivars under AWD regime.
干湿交替灌溉对籼粳杂交稻产量与水分利用效率的影响及其生理基础
DOI:10.3864/j.issn.0578-1752.2021.07.014
[本文引用: 1]
【目的】探明干湿交替灌溉对籼粳杂交稻产量与水分利用效率的影响及其生理基础。【方法】试验于2017—2018年在中国水稻研究所富阳基地皇天畈试验农场进行。以2个新选育的超高产籼粳杂交稻品种甬优1540和春优927以及2个当地高产粳型杂交稻品种常优5号和嘉优5号为材料,开展大田试验。自移栽后7 d至成熟期设置2种灌溉模式,分别为常规灌溉(CI)和干湿交替灌溉(AWD)。研究AWD对籼粳杂交稻品种产量形成以及水分利用效率的影响及其生理基础。【结果】与CI模式相比,AWD模式显著降低了2个当地高产粳型杂交稻品种的产量,降幅为12.3%—12.8%,但2个籼粳杂交稻品种的产量在2种灌溉模式间没有显著差异;AWD模式显著提高了4个供试水稻品种的水分利用效率,其中当地高产粳型杂交稻品种的增幅为5.9%—8.3%,籼粳杂交稻品种的增幅为13.7%—16.8%。与当地高产粳型杂交稻相比,籼粳杂交稻品种在AWD模式下获得相对较高的产量以及水分利用效率主要得益于其强大的分蘖发生能力、较高的群体颖花量和结实率、齐穗至成熟期较高的光合势与作物生长速率、齐穗后2次土壤落干期与复水期较高的根系氧化力、剑叶净光合速率以及籽粒中较高的蔗糖-淀粉代谢途径关键酶的活性。【结论】与当地高产粳型杂交稻品种相比,籼粳杂交稻品种在AWD模式下可获得更高的产量与水分利用效率;较好的根系性能(齐穗后2次土壤落干期与复水期较高的根系氧化力)和地上部植株较强的生理活性(齐穗至成熟期较高的光合势、作物生长速率、齐穗后2次土壤落干期与复水期较高的剑叶净光合速率以及籽粒中蔗糖-淀粉代谢途径关键酶活性)是其在AWD模式下获得高产与水分高效利用的重要生理基础。
Interaction between soil water and fertilizer utilization on maize under plastic mulching in an arid irrigation region of China
Interaction effects of irrigation and nitrogen on the coordination between crop water productivity and nitrogen use efficiency in wheat production on the North China Plain
Combined effects of irrigation level and fertilization practice on yield, economic benefit and water-nitrogen use efficiency of drip-irrigated greenhouse tomato
Biochar effects on soil properties, water movement and irrigation water use efficiency of cultivated land in Qinghai-Tibet Plateau
Irrigation water use and efficiency assessment coupling crop cultivation, commutation and consumption processes
Hybrid analytical framework for regional agricultural water resource utilization and efficiency evaluation
Interlinkages between human agency, water use efficiency and sustainable food production
Mutual analyses of agriculture land use and transportation networks: The future location of soybean and corn production in Brazil
Interregional farmland layout optimization on the constraint of natural resources and social-economical condition: A case study of Wuhan city circle
基于资源禀赋和经济发展区域差异的耕地优化布局: 以武汉城市圈为例
Progress towards sustainable intensification in China challenged by land-use change
DOI:10.1038/s41893-018-0076-2 [本文引用: 9]
Spatial exploration of multiple cropping efficiency in China based on time series remote sensing data and econometric model
DOI:10.1016/S2095-3119(13)60308-1
[本文引用: 2]
This study explored spatial explicit multiple cropping efficiency (MCE) of China in 2005 by coupling time series remote sensing data with an econometric model - stochastic frontier analysis (SFA). We firstly extracted multiple cropping index (MCI) on the basis of the close relationship between crop phenologies and moderate-resolution imaging spectroradiometer (MODIS) enhanced vegetation index (EVI) value. Then, SFA model was employed to calculate MCE, by considering several indicators of meteorological conditions as inputs of multiple cropping systems and the extracted MCI was the output. The result showed that 46% of the cultivated land in China in 2005 was multiple cropped, including 39% doublecropped land and 7% triple-cropped land. Most of the multiple cropped land was distributed in the south of Great Wall. The total efficiency of multiple cropping in China was 87.61% in 2005. Southwestern China, Ganxin Region, the middle and lower reaches of Yangtze River and Huanghuaihai Plain were the four agricultural zones with the largest rooms for increasing MCI and improving MCE. Fragmental terrain, soil salinization, deficiency of water resources, and loss of labor force were the obstacles for MCE promotion in different zones. The method proposed in this paper is theoretically reliable for MCE extraction, whereas further studies are need to be done to investigate the most proper indicators of meteorological conditions as the inputs of multiple cropping systems.
Comprehensive evaluation of China's water resources carrying capacity
中国水资源承载力综合评价研究
Potentiality evaluation of three-dimensional urban land use based on improved polygon area method: A case study of Shenzhen
DOI:10.11849/zrzyxb.20170055
[本文引用: 1]
Reasonable evaluation of the potentiality of three-dimensional land use can promote the fine management of land use, thus it is of great significance to scientific land management and sustainable urban development. Based on four factors, i.e., social and economic status, land use status, comprehensive development opportunity and eco-environmental restriction, an evaluation system with 13 elements was established and indices were calculated with improved polygon area method to evaluate the potentiality of three-dimensional land use. Multiple-source data, such as statistical yearbook data, census data, land use survey data and building survey data, were used to support the analysis. The method was conducted in Shenzhen to validate the effectiveness of the evaluation. For a more accurate evaluation, Delphi method was used in each of the 11 city clusters to determine the relative importance of different factors on the three-dimensional land use in each region, since the dominant functions of different regions were different. The result showed that: the improved polygon area method could reflect the incomplete substitution relation and emphasize synergistic effect between different factors very well. It could be more pertinent to evaluate the potentiality in a region by using a weight matrix adjusted by the regional difference instead of using a uniform weight. From the perspective of single dimension, regions with the best social and economic status gathered in the central urban area of Shenzhen; regions with high score of land use status were disperse; Qianhai-Houhai area and Longgang Center area were regions with greater comprehensive development opportunity; the eco-environmental restriction of urban built-up area near the basic ecological control line could be more strict and less suitable for three-dimensional land use. Overall, the potentiality of three-dimensional land use in Shenzhen decreased from south to north and from west to east. High potentiality areas accounted for 26.46% of build-up areas (extremely high potentiality areas accounted for 8.65%) and showed overall pattern of dispersion with local clusters. Low potentiality areas accounted for 32.21% of build-up areas and mainly located at the periphery part of urban build-up areas. The central urban area and Qianhai-Houhai area were detected as the highest potential areas. In addition, Longhua-Bantian-Buji area, Longgang Center area, Sha Tau Kok and Baoan Airport New Town were regions with higher potentiality of three-dimensional land use. In a word, the improved polygon area method can estimate the potentiality of three-dimensional land use in Shenzhen very well. Moreover, it can make the practice of three-dimensional land use more scientific and systematic.
基于改进多边形面积法的城市土地立体化利用潜力评价: 以深圳市为例
DOI:10.11849/zrzyxb.20170055
[本文引用: 1]
土地立体化利用潜力评价对于引导土地科学管理与城市可持续发展具有重要意义。论文采用改进多边形面积法,构建基于社会经济现状、土地利用现状、综合发展机会和生态环境约束4个维度要素的土地立体化利用潜力评价指数,并以深圳市为示范区进行验证。结果表明:改进多边形面积法能较好地反映各个维度要素的不完全替代关系并突出多种要素的协同作用效果;结合区域差异以权重矩阵代替单一权重系数,能更有针对性地评价土地立体化利用潜力;深圳市土地立体化利用潜力由南向北、由西向东递减,高潜力区域面积占全市建成区面积的26.46%,且呈现整体分散、局部集聚的特征;识别中心城区和前海-后海片区为极高潜力区域,与深圳市实际发展情况基本一致。
Impacts of drought intensity and drought duration on winter wheat yield in five provinces of North China plain
DOI:10.11821/dlxb201901007
[本文引用: 1]
Based on the MOD09A1 and MOD16A2 datasets with a temporal resolution of 8 days during a period from 2001 to 2016, Drought Severity Index (DSI) was quantified to characterize spatiotemporal distribution of droughts of different drought intensities. The correlation coefficients were quantified between drought-affected cropland area and the climatic winter wheat yield. In addition, relevant impacts of droughts with different drought intensities were investigated on the winter wheat yield during different growing periods. The results show that: (1) drought regimes during 2001-2016 showed a declining trend in terms of drought intensity at annual and inter-annual scales. The most severe drought occurred during 2001-2002 while regional and intermittent droughts could be observed during 2003-2010, and were alleviated during 2011-2016 with persistent wetting tendency thereafter. In terms of annual drought distribution, droughts occurred mainly in spring and autumn, some occurred in summer and few droughts in winter; (2) Generally, in terms of the spatial distribution of droughts, central and northern Hebei, southern Henan, Anhui and Jiangsu, and eastern Shandong provinces were dominated by frequent droughts though droughts were in decreasing trends; (3) analysis results concerning effects of droughts on winter wheat yield show that the incipient drought during the winter period can promote the winter wheat yield, while in the milking stage of the winter wheat, occurrence of droughts may decrease crop yield. The mild drought potential has significant effects on winter wheat yield during the ripening interval, while the moderate drought occurs during flowering, milking and ripening periods can have a significant impact on the winter wheat yield. Meanwhile, droughts with higher degree of intensity will have more significant impacts on winter wheat at its earlier growing season. In addition, water shortage due to drought effects during planting periods will reduce the yield of winter wheat, and severe and extreme droughts in particular. Therefore, it is of great merits in quantification of impacts of droughts with different intensities on winter wheat yield in different growing seasons, and it has important theoretical and practical significance for the planning of irrigation and the increase of soil moisture in the study region.
干旱强度及发生时间对华北平原五省冬小麦产量影响
DOI:10.11821/dlxb201901007
[本文引用: 1]
本文利用2001-2016年时间分辨率为8 d的MOD09A1和MOD16A2的数据集,构建了基于NDVI和ET/PET的干旱指数(DSI),分析华北平原五省不同程度的干旱在时间和空间上的分布情况,探究不同程度的干旱作用于冬小麦不同生长阶段对农作物产量产生的影响。研究表明:① 年际分布上,2001-2002年干旱最为严重,其余年份干旱显著减缓,年内分布上,干旱主要集中发生在春季和秋季,夏季次之,冬季最少;② 空间分布上,河北北部、河南南部、安徽及江苏的中部和北部、山东东部是干旱多发区;③ 干旱对冬小麦产量的影响研究表明,越冬期发生初旱对产量起促进作用,而在乳熟成熟阶段发生初旱则会导致农作物减产;轻旱发生在乳熟期会对冬小麦产量产生显著影响,而中旱发生在开花、乳熟成熟期都会对产量产生显著影响,随干旱程度加重,干旱对作物产量产生显著负作用的生长期越长;此外,在播种时若出现水分短缺也会对冬小麦的产量产生影响,尤其是发生重旱和特旱。研究不同强度干旱发生在不同生长阶段对冬小麦产量的影响,对研究区的灌溉时间规划以及保墒增产具有重要理论与现实意义。
More is more? Forest management allocation at different spatial scales to mitigate conflicts between ecosystem services
DOI:10.1007/s10980-017-0572-1 URL [本文引用: 1]
Mapping crop distribution patterns and changes in China from 2000 to 2015 by fusing remote-Sensing, statistics, and knowledge-based crop phenology
Optimization of land use structure in Huang-Huai-Hai Plain under water resources constraint
水资源约束下的黄淮海平原区土地利用结构优化
Cropland sustainable use impacted by groundwater depletion in China's HHH plains
黄淮海平原地下水危机下的耕地资源可持续利用
Study on spatial and temporal differences and affecting factors of agricultural water resources green efficiency in Huang-Huai-Hai Plain
黄淮海平原农业水资源绿色效率时空差异与影响因素研究
Ecological compensation for winter wheat abandonment in groundwater over-exploited areas in the North China Plain
DOI:10.11821/dlxb201605011
[本文引用: 1]
The North China Plain (NCP) is amongst the global "hotspots" in terms of groundwater over-exploitation, and irrigation for winter wheat is the primary cause. Shrinkage of area sown to winter wheat proves to be a practical strategy to reverse groundwater over-exploitation and to promote groundwater storage. Land retirement policy was introduced by the government to encourage the extension of spring maize single cropping system in groundwater over-exploited areas. In addition, since the 1990s, large areas in the NCP in which winter wheat and summer maize are being replaced by the single cropping system of spring maize, due to the active behaviors of farmers. Not all land parcels grow winter wheat at the moment. Therefore, it is crucial to reveal the targeted land parcels for winter wheat abandonment and to assess reasonable and proper standards for ecological compensation, prior to the implementation of land retirement policy. In this paper, a case study was carried out in Cangxian county of Hebei province. Multi-level logit models were constructed using household survey data, in order to detect the determinants across plot, household and village levels on farmers' cropping system decisions, and the opportunity costs for winter wheat abandonment were calculated using cost-benefit analysis. The aim of this study was to recognize land parcels with winter wheat and to give scientific support on standards for ecological compensation. Results showed that: (1) land quality and irrigation condition at the parcel level are two essential elements influencing farmers' cropping system decisions. Nearly 70% in total area of poor land and more than 90% in total area of unirrigated land has suffered winter wheat abandonment. The targeted land parcels for land retirement policy should be the irrigated ones with land qualities being good, relative good or relative bad. (2) There were no significant differences between the net-profits of spring maize and summer maize under similar farming conditions, and the opportunity cost for land retirement should be equal to the net-profit of winter wheat. (3) When only considering the influence of winter wheat on groundwater resources, the primary purpose of the land retirement policy is to reverse the groundwater table and to induce groundwater recovery and restoration at the preliminary stage, and a high level of 350 yuan/mu was recommended as the subsidies for ecological compensation; at a later stage, the primary purpose of the policy transited to the balance of exploitation and supplement of water resources, and a lower level of 280 yuan/mu was recommended.
华北地下水超采区冬小麦退耕的生态补偿问题探讨
DOI:10.11821/dlxb201605011
[本文引用: 1]
压减冬小麦种植面积是有效减少华北平原地下水用量最为有效的方法。近期,国家和地方政府均出台了土地休耕政策,拟在华北地下水超采区退耕冬小麦,实现“一季休耕、一季雨养”。然而,华北平原已经出现农户主动退耕冬小麦的现象。在此背景下,明确冬小麦退耕的瞄准目标、制订合理适度的补偿标准是土地休耕政策有效实施所面对的核心问题。本文利用农户问卷数据,构建多层次logit模型分析农户种植制度决策的影响因素,并计算冬小麦退耕的机会成本,旨在确定华北平原地下水超采区土地休耕政策的瞄准目标,并为农户补偿标准的制订提供建议。结果表明:① 地块层次的土地质量和灌溉条件是解释农户种植制度差异的关键因素,近70%的四等耕地和90%以上的旱地已退出冬小麦耕作,土地休耕政策应瞄准一、二、三等土地质量的水浇地;② 相似耕作条件的地块种植春、夏玉米的净收益大致相同,土地休耕的机会成本等于种植冬小麦的净收益;③ 仅考虑冬小麦对地下水资源的影响,土地休耕政策初期以地下水回升和地下水环境恢复为主要目标时,建议以350元/亩作为补偿标准参考值,后期目标转为维持地下水资源采补平衡时,可调整至280元/亩左右。
Spatio-temporal distribution characteristics of hourly precipitation in Shandong Province in flood season
山东省汛期小时降水过程时空分布特征
Spatial pattern evolution of grain production and its impact on grain-land matching in China
我国粮食生产格局演变下的粮地匹配
Modeling climatically suitable areas for soybean and their shifts across China
Evolution characteristics and mechanism of major crops production patterns in Guangxi
DOI:10.11821/dlxb202209013
[本文引用: 1]
Crop production structure and layout is a traditional research content of agricultural geography, and the research on the evolution characteristics and mechanism of crop production pattern can provide some reference for the optimal allocation of regional agricultural production elements. In this paper, we use the location Gini coefficient, gravity center movement model and comparative advantage index to reveal the evolution characteristics of the production pattern of four major crops, i.e., grain, sugar, fruits and vegetables, in Guangxi from 1995-2019 and their formation mechanism, and accordingly put forward relevant optimization suggestions. The results showed that grain crops "retreating", and sugar, fruits and vegetables "advancing" constitute the basic situation of the major crops competition. In terms of spatial distribution, the grain and vegetables are relatively scattered, the sugar production has an obvious trend of geographical agglomeration, and the fruit production has moved from relative concentration to dispersion. The scale comparative advantage of major crops dominates the aggregated comparative advantage, and the weak position of grain production is gradually strengthened. Sugar production has the absolute scale and aggregated comparative advantages. Fruits and vegetables have a prominent scale comparative advantage, but the efficiency comparative advantage needs improvement. The combination of forces such as the constraints of resource endowments, the dominance of market supply and demand and comparative efficiency, the inducement of changes of rural social development factors, the guidance or correction of institutional environment, and the circular accumulation of agglomeration economy, all together drive the evolution of crop production patterns. The unique regional situation determines that Guangxi's crop production should coordinate economic, social and ecological functions, and promote the transformation of crop production from scale expansion to comprehensive benefit enhancement by adjusting production structure, optimizing the spatial layout and strengthening industrial agglomeration.
广西主要农作物生产格局演变特征与机制研究
DOI:10.11821/dlxb202209013
[本文引用: 1]
农作物生产结构与布局是农业地理学探讨的传统研究主题,开展农作物生产格局演变特征与机制研究,可为区域农业生产要素的优化配置提供参考依据。论文运用区位基尼系数、重心移动模型、比较优势指数等方法,揭示1995—2019年广西粮食、糖料、水果和蔬菜4类主要农作物生产格局的演变特征,剖析其形成机制,据此提出相关优化建议。结果表明:粮食作物“退”、糖果菜“进”构成主要农作物竞争的基本态势;粮食、蔬菜生产空间分布相对分散,糖料生产地理集聚趋势明显,水果生产由相对集中走向分散;主要农作物综合比较优势受规模比较优势主导,粮食生产劣势明显,糖料生产具有绝对规模比较优势和综合比较优势,水果、蔬菜生产规模比较优势突出但效率比较优势有待提升。资源禀赋的约束、市场供需和比较效益的主导、乡村社会发展要素变化的诱发、制度环境的引导/修正、集聚经济的循环累积等多种力量综合作用推动农作物生产格局的演变。特殊的区情决定了广西农作物生产应统筹经济功能、社会功能和生态功能,通过结构调整、产业集聚、空间优化,推进农作物生产从规模扩张向综合效益提升转型。
Appraising climate change impacts on future water resources and agricultural productivity in agro-urban river basins
Estimation of sustainable grain productivity for arable land under water balance in the Huang-Huai-Hai Plain
DOI:10.11821/dlxb201803011
[本文引用: 1]
China puts forward the national strategy of fallow plan so as to improve the sustainable grain production capacity of arable land and alleviate the continuous decline of the groundwater level in the Huang-Huai-Hai Plain. Aiming at estimation of sustainable grain productivity for ensuring the implementation of this strategy, this paper learns management experience and experimental production from agricultural experiment station and adopts step-by-step correction method in twelve agricultural ecological zones, which are relatively uniform in social and economic conditions based on the sustainable theory and water balance. The results showed that: (1) The total sustainable grain production capacity of arable land under water balance in the Huang-Huai-Hai Plain was 116 million t/year. (2) The yield gap of sustainable grain productivity was -0.67 million t/year, the wheat yield gap was -3.31 million t/year due to limited-water irrigation and the maize yield gap was positive. (3) The loss area of wheat production is mainly distributed in Heilonggang area, Luxi Plain, the Beijing-Tianjin-Tangshan Plain and the eastern Henan Plain, and the potential area is mainly in Xuhuai Plain, the Northern Anhui Plain and Jiaoxi Yellow River Flood Plain. The research was valuable for understanding the sustainable productivity of cultivated land and implementing the reliable spatial pattern of agricultural production in the Huang-Huai-Hai Plain.
水平衡下黄淮海平原区耕地可持续生产能力测算
DOI:10.11821/dlxb201803011
[本文引用: 1]
为缓解黄淮海平原区地下水水位的持续下降,国家提出耕地资源休养生息的战略,而实施耕地资源休养生息的关键,是确保水平衡下的耕地资源可持续生产能力。本文从可持续理论和水平衡的条件出发,将黄淮海划分成12个自然条件、社会经济条件相对均一的农业生态区,采用不同农业生态区代表实验站限水高产的产量和管理经验,以水定产并逐步修正,得到了黄淮海平原区耕地可持续生产能力,并与现实产量对比得到产量差。结果表明:① 水平衡条件下黄淮海平原区耕地的可持续粮食生产能力为1.16亿t/年;② 可持续总产产量差为-67.85万t/年,由于限水灌溉造成的粮食产能损失为小麦331.84万t/年,玉米不存在产能损失;③ 小麦主要压产地区为黑龙港地区、鲁西平原、豫东平原以及京津唐平原,而徐淮低平原、豫东平原以及胶西黄泛平原具有一定的提产潜力。通过测算,进一步认识了黄淮海平原区耕地可持续产能状况,为区域粮食生产的合理布局以及农业限水限产提供可靠依据。
Optimization of irrigation scheduling for maize in an arid oasis based on simulation-optimization model
Global priority areas for ecosystem restoration
DOI:10.1038/s41586-020-2784-9 [本文引用: 1]
