焦利民 , 李泽慧
, 李泽慧
JIAO Limin, LI Zehui
收稿日期: 2016-08-30
修回日期: 2017-03-27
网络出版日期: 2017-08-20
版权声明: 2017 《地理学报》编辑部 本文是开放获取期刊文献,在以下情况下可以自由使用:学术研究、学术交流、科研教学等,但不允许用于商业目的.
基金资助:
作者简介:
作者简介:焦利民(1977-), 男, 河南安阳人, 博士, 教授, 博士生导师, 主要从事空间数据分析与建模、土地利用/覆盖变化与城市扩张方面的研究。E-mail:lmjiao027@163.com
展开
摘要
不同城市要素的集聚现象具有不同的空间模式,定量化研究城市要素集聚模式的差异和联系对于理解城市发展机理、合理制定城市规划具有重要意义。本文以武汉市为例,获取不透水表面、商业服务业网点(POI)、人口、容积率、城市道路等城市要素数据;采用核密度估计法识别城市主次中心,从城市要素的分布形态、集聚程度、集聚模式等来研究城市要素的空间分布格局特征。研究发现,武汉市呈现“一主七副”的多中心结构,各城市要素从城市中心向外呈反S型的圈层递减。采用集聚度指数衡量城市要素的集聚水平,结果显示商业POI、人口密度的集聚程度最大,其次是容积率、道路密度、不透水表面占比。高度集聚的商业POI、人口密度呈现出点状模式与带状模式相结合的分布模式,中度集聚的道路密度、容积率呈现点状模式、环状模式与轴状模式相结合的分布模式,低度集聚的不透水表面密度主要表现为环状模式。城市中心的吸引、立体空间开发等促进了城市要素的向心集聚,交通干线、稀缺景观资源的廊道效应等重塑了城市要素的空间分布形态。
关键词:
Abstract
Different urban elements may exhibit various aggregation patterns. It is of great significance to quantitatively investigate the disparity and connection among various aggregation patterns of urban elements for understanding the mechanism of urban development and supporting urban planning. Taking Wuhan city, Central China, as a case, we collected five types of urban elements, namely, impervious surface, population density, Point of Interest (POI), plot ratio, and road network, to explore their spatial distribution and characteristics of aggregation patterns. We first used Kernel Density Estimation (KDE) method to identify city centers and we found that there is one major center and seven sub-centers in Wuhan. Then we partitioned the study area by gradient analysis, and calculated the densities of urban elements. The density of urban element decreases outward from the centers, which is fitted well using "Inverse S-shaped" function. We used Concentration Degree Index (CDI) to reflect the aggregation degree of urban elements. The results indicate that the degrees of the aggregation of urban elements are: Commercial POI > population > plot ratio > road. Commercial POI and population are highly aggregated in the urban core area, while plot ratio and road are moderately aggregated in the urban core area. The spatial patterns of highly aggregated commercial POI and population are the combination of point pattern and zonal pattern, while the spatial patterns of moderately aggregated road network and plot ratio are the combination of point pattern, ring pattern and axial pattern. As for the lowly aggregated impervious surface, it shows a ring pattern. The attraction effect of city centers and vertical development promote the center-oriented agglomeration of urban elements. At the same time, the transportation lines and corridor effects of the scarce landscape resources reshape the spatial distribution pattern of urban elements.
Keywords:
城市是一个由基础设施、人类活动和社会联系组成的复杂动态系统[1],是人口、经济活动等城市要素集聚的某个空间范围[2]。城市人口、城市经济和城市土地利用等相互影响共同作用形成城市要素系统。研究城市要素系统中各个要素的空间分布和集聚特征是认识城市要素系统的重要途径,有利于更好地认识城市格局及演化,有利于理解城市要素的内生发展规律,为城市土地开发、城市规划等提供理论依据和重要参考。
众多学者研究了城市人口的空间分布与集聚特征,建立了描述城市人口密度分布的模型,如Clark模型、Smeed的负幂指数模型及其相关的修正模型如Tanner-Sherratt的正态密度模型、Newling的二次指数模型、加幂指数模型等[3-6]。探索性空间数据分析(ESDA)用可视化的方式表达人口的空间分布,常被用来揭示空间的集聚或热点模式[7]。有研究采用聚集指数描述了流动人口集聚空间分布特征[8]。在研究城市经济的空间分布与集聚特征方面,产业经济是众多学者关注的焦点。学者们对制造业、生产性服务业的空间分布与集聚特征进行了深入研究。Ellison等提出的EG指数被广泛运用于衡量比较产业集聚程度[9],Ripley K函数常用来研究不同尺度下的产业的集聚空间分布,测定其集聚程度[10-13]。此外,空间基尼系数、赫芬代尔系数、地理联系率等被用来反映产业的集聚程度、集聚水平、集聚一致性[14]。集聚程度的研究是理解集聚现象的一个角度,集聚特征在全面探究产业在空间上的集聚分布规律的基础上揭示集聚现象。目前学者们对各个产业(商业)的集聚特征研究成果较为丰富。基于微观企业数据研究产业空间特征[12],对办公空间的行业[11]、生产服务业行业[15-16]、汽车服务业[17]等的研究揭示了不同类型产业的集聚空间分布特征。国内学者针对零售商业的集聚类型及集聚特征进行讨论,总结了零售业态在不同区位的差异性集聚特征[18],并划分出了斑(点)状、条带(线)状、面状及立体状等集聚类型[19]。还有学者研究了大型商业网点的集聚程度及特征,发现各业态类型网点空间分布差异性较大,具有不同尺度的空间集聚表现[10]。土地作为城市人口和城市经济活动的载体,是城市中最基本的要素。土地利用结构、土地利用强度与土地利用密度反映了城市土地利用。土地利用强度可用容积率、建设密度、建筑层数等来度量。城市内的基础设施和公共服务设施密度反映了城市的土地利用密度。国内相关学者已对不同用地类型的容积率空间变化规律、同一用地类型多尺度容积率的差异的进行探讨[20-23]。对于建设用地的集聚特征,国内相关研究采用分形模型[24]、景观格局指数[25]、斑块聚合度指数[26]等模型或指标进行分析。土地利用密度方面,有学者研究了城市内的道路密度空间分布发现道路密度的空间分布呈现明显的集聚特征和地带性[27]。Jiao于2015年提出城市不透水表面密度随到城市中心距离的增加而呈现出反S型衰减规律[28]。
尽管国内外学者在城市要素集聚方面已开展大量研究,但已有研究多关注单一城市地理要素的分布模式和集聚程度,缺乏对城市人口、经济活动、土地利用等不同要素空间分布和集聚特征的对比分析,且在对地理要素进行集聚程度划分时,缺乏多个要素间可比较的统一集聚程度指标。
本文以典型的多中心城市武汉市为例,选取不透水表面、人口密度、兴趣点(Point Of Interest, POI)、容积率、道路密度等数据来研究城市要素的空间集聚特征,运用核密度估计法定量识别武汉市城市主次中心,结合梯度分析法划定城市圈层并计算各圈层内城市要素密度,定量拟合各圈层城市要素密度分布形态,采用集聚度指数划分各要素集聚强度类型,分析各要素空间分布和集聚特征,探讨各要素空间分布形成的机理,有助于理解城市要素集聚规律并为城市规划提供决策支持。
武汉市是湖北省省会,地处江汉平原东北部,位于29°58′N~31°22′N、113°41′E~115°05′E,是华中重要经济中心及区域交通枢纽。长江最大支流汉水与长江在武汉市区交汇,形成汉口、武昌、汉阳三镇鼎立的独特格局,是典型的多中心城市,现辖江岸区、江汉区、硚口区、汉阳区、武昌区、洪山区、青山区、东西湖区、蔡甸区、江夏区、黄陂区、新洲区、汉南区共13区。
本文采用的数据有不透水表面、人口密度、兴趣点、容积率、道路密度数据。通过解译Landsat遥感影像(2010年)获得研究区不透水表面数据;人口数据为第六次人口普查(2010年)武汉市分街坊人口密度数据;POI数据为2014年网络电子地图数据,共计51.1909万条,POI数据类型划分如表1所示;容积率和道路数据为2013年数据。
表1 POI数据类型划分
Tab. 1 POI data type classification
| ID | 大类 | 子类 | 比例(%) |
|---|---|---|---|
| 1 | 居住用地 | 商务住宅相关,商务住宅住宅区 | 6.74 |
| 2 | 公共用地 | 生活服务(人才市场),政府机构及社会团体,体育休闲,科教文化服务,医疗保健(商业服务业设施用地之外部分)、公共设施 | 10.06 |
| 3 | 商业服务业设施用地 | 餐饮服务,公司企业(公司),购物服务,金融保险,汽车维修、汽车服务,汽车销售,生活服务,住宿服务,商务住宅(楼宇)、体育休闲(度假村、高尔夫、休闲场所、娱乐场所、溜冰场、赛马场)、科教文化服务(传媒机构、驾校、培训机构、科教文化场所中有部分数据)、医疗保健服务(宠物诊所、诊所) | 78.26 |
| 4 | 工业用地 | 公司企业(工厂),公司企业(冶金),公司企业(矿工),商务住宅(产业园) | 0.53 |
| 5 | 交通用地 | 道路附属设施,交通服务设施 | 3.83 |
| 6 | 绿地与广场用地 | 风景名胜用地 | 0.57 |
核密度估计法(Kernel Density Estimation, KDE)是非参数的方法。核密度分析易于实现并能较好地反映地理现象空间分布中的距离衰减效应[29]。其计算公式为:
式中:
梯度分析法包括断面法和圈层法。断面法侧重分析几个设定方向的景观格局变化,圈层法则适于研究城市集聚分布的宏观形态。为探究圈层对各个城市要素的空间梯度影响,选择梯度分析法中的圈层法[31-32]。在形成的圈层结构基础上,分别计算各圈层的各个要素值。按照公式(2)计算商业POI密度、道路密度、不透水表面的圈层密度:
式中:Di表示第i个圈层的要素密度值;Si为第i个圈层的圈层面积扣除水域面积;Pi为第i个圈层的商业POI个数或道路总长度或不透水表面面积。
考虑到容积率、人口密度的空间单元特性,按公式(3)进行圈层密度计算:
式中:Di表示第i个圈层的平均要素值;Sj为第i个圈层所包含的j单元的面积;Dj为j单元的要素值;n为每个圈层中包含的单元总数。
Jiao于2015年以全国28个主要城市为例,观察到不透水表面密度随着到城市中心距离呈现反S型递减规律,并提出了一种反S型方程对这种分布进行拟合,效果很好[28]。该方程也可以用以不同类型城市要素空间分布拟合。本文将运用该反S型方程对武汉市各个城市要素的圈层密度分布进行拟合分析。该方程如下:
式中:f表示城市要素密度;r表示到城市中心的距离;e是欧拉数;α和D是参数,α是控制反S方程曲线的斜率的参数,D表示主要城市区域半径的拟合估计值;C表示城市边缘城市要素的密度。
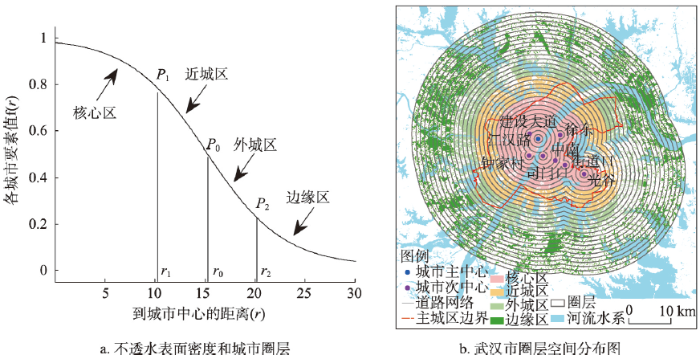
根据城市不透水表面密度的反S曲线可以进行城市圈层划分,r1表示核心区,r1-r0表示近城区,r0-r2表示外城区,r2以外为边缘区(图1)。详细推导和计算过程参考文献[28]:
密度分布曲线的形态直观地反映了集聚要素的集聚形态。曲线斜率越大,表示要素越向中心集聚,要素密度随着距中心距离的增加而快速下降;曲线斜率越小,则表示要素集聚程度较低,呈现密度缓慢下降的蔓延分布特征。
基于上述密度拟合方程,建立集聚度指数(Concentration Degree Index, CDI)描述城市要素集聚水平,定义为城市要素密度分布半径和城市半径的比值。城市半径由不透水表面密度拟合后的参数D值(Dcity)决定,各要素分布半径由各要素拟合后的参数D值(Delements)决定。集聚度指数越小,表示城市要素集聚程度越高,城市要素倾向于高密度集聚。比值越大,表示城市要素集聚程度相对越小,呈现低密度蔓延。表达式为:
式中:Delements表示城市各个要素密度分布曲线定义的集聚区半径;Dcity表示由不透水表面密度分布曲线定义的城市半径。
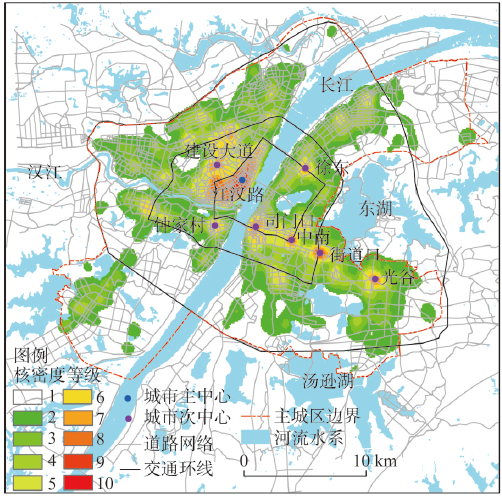
国内外学者对城市中心的识别主要基于就业密度或人口密度数据,运用就业或人口密度峰值、阈值法、参数法和半参数法识别城市中心。在大数据背景下,也有基于位置的社交网络数据进行城市中心识别[33-38]。本文采用核密度估计法,对主城区内全部POI数据进行核密度分析,采用自然分段法(Natural Break)将核密度分析结果划分为10级,选取核密度高值的7~10级作为城市中心候选区域。结合城市规划及武汉市社会经济发展情况最终确定“一主七副”的城市主次中心,1个主中心(江汉路),7个副中心分别为司门口、钟家村、中南路、街道口、光谷、徐东、建设大道(图2)。
图2 武汉市POI核密度分析结果与多级城市中心
Fig. 2 The results of KDE of POI and the city centers in Wuhan city
对识别出的城市中心进行梯度分析(图3)。第一步,确定各次中心与主中心间不透水表面密度最低点位置。用直线连接主中心与次中心,对该直线进行1 km的缓冲分析(图3a)。对主中心以1 km为半径做缓冲分析(覆盖到次中心),将主中心的缓冲区与直线的缓冲区进行相交处理,通过式(2)计算区域每个环状片段的不透水表面密度值(扣除水域面积),求得不透水表面密度最低的位置(图3b)。其中,中南路、街道口、光谷次中心近似处于城市主中心的放射性轴线上,首先确定主中心和最近的副中心中南路的密度最低点,然后确定中南路和街道口副中心之间的密度最低点,最后确定街道口和光谷的密度低点。第二步,依次对主、次中心分别以1 km为递增间隔建立系列缓冲区,将确定的密度低点作为缓冲圈层融合点,对此后的圈层进行融合使之形成一个整体(图3c),最终形成“一主七副”的圈层结构。第三步,将该圈层结构继续进行缓冲半径为1 km的缓冲,最终形成由内到外的30个圈层(图3d)。
选取不透水表面、商业POI、人口密度、容积率、道路密度5类要素,运用公式(2)、(3)计算各个城市要素相应的圈层密度值并进行离差标准化,在Matlab 2014中进行反S方程拟合(表2,图4)。
表2 武汉市城市要素反S方程拟合参数表
Tab. 2 The parameters of fitted inverse S-shaped functions of urban elements in Wuhan city
| 要素类型 | α | c | D | R2 |
|---|---|---|---|---|
| 不透水表面 | 3.92 | 0.0191 | 30.29 | 0.9847 |
| 人口密度 | 2.965 | 0.04039 | 6.306 | 0.9689 |
| 商业POI | 2.5 | 0.0211 | 5.074 | 0.9371 |
| 容积率 | 2.138 | 0.1213 | 8.827 | 0.9322 |
| 道路密度 | 0.8025 | 0.07271 | 8.956 | 0.8292 |
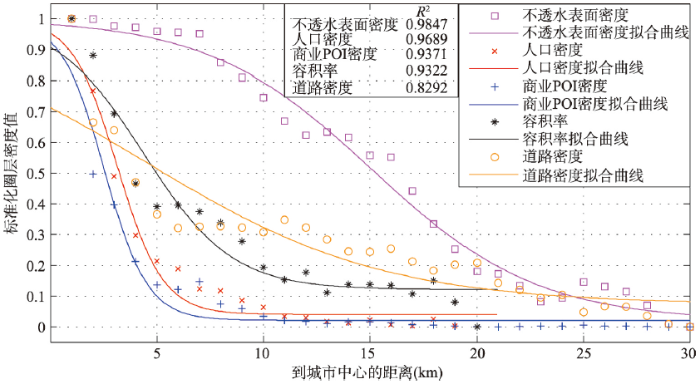
从表2中可以看出,反S方程拟合决定系数R2均较高,除道路密度外其余城市要素的R2值均大于0.9,反S方程能够很好地拟合不透水表面、POI商业服务设施、容积率、人口、道路的空间分布。依据不透水表面密度将武汉市划分为核心区、近城区、外城区、边缘区。依据反S方程中的计算公式有:核心区在0~10.06 km处,10.06~15.14 km处为近城区,15.14~20.23 km处为外城区,20.23 km外为边缘区。
图4 武汉市城市要素反S方程拟合曲线图
Fig. 4 The curves of fitted inverse S-shaped functions of urban elements in Wuhan city
从图4可以看出,城市要素均从城市中心向外呈现反S型递减的趋势,且各个要素的下降形态存在差异。商业POI密度分布曲线斜率最大,人口密度分布曲线斜率次之,二者均呈现出随中心距离的增加而快速下降的形态,直观表现了商业POI向心集聚性最大,其次是人口密度。道路密度分布曲线整体上呈现相对平缓下降的分布形态,反映出其向心集聚较低。容积率、不透水表面密度呈现出先缓慢下降后快速下降的下降形态。容积率、道路密度等要素在城市中心不同距离处出现局部凸起的起伏形态特征,反映出道路密度、容积率在城市中心和次中心之外存在局部集聚现象。
表3 武汉市城市要素集聚程度
Tab. 3 The concentration degrees of urban elements in Wuhan city
| 要素类型 | CDI | 集聚程度 | 集聚区域 |
|---|---|---|---|
| 商业POI | 0.17 | 高度集聚 | 核心区 |
| 人口密度 | 0.21 | 高度集聚 | 核心区 |
| 容积率 | 0.29 | 中度集聚 | 核心区 |
| 道路密度 | 0.30 | 中度集聚 | 核心区 |
| 不透水表面 | 1 | 低度集聚 |
城市要素的集聚程度采用CDI指标表示(公式(8))。高度集聚的城市要素对应较低的CDI值,且城市要素集聚程度越大,其CDI值越小。将CDI值划分为3种类型:高度集聚(CDI < 0.25)、中度集聚(0.25 < CDI < 0.5)、低度集聚(CDI > 0.5)。从表3中可看出,人口密度、商业POI的CDI值均小于0.25,高度集中分布,集聚区域主要分布在城市核心区。相对于不透水表面,容积率和道路密度呈现中度集聚。
进一步采用核密度分析法研究不同集聚程度的要素的空间集聚模式,得到武汉市5个城市要素的核密度分析结果(图5),各要素的空间集聚分布模式表现为:
(1)环状模式:该模式是从城市中心向外呈现圈层递减分布。从图5可看出,不透水表面密度从城市中心向外呈现出圈层递减的分布,在城市主城区不透水表面密度核密度值最高,随着到城市中心距离的增加,不透水表面密度核密度值不断降低。道路密度从城市主中心呈距离递减分布,与不透水表面密度的距离递减分布具有较高的一致性。相对一、二环的道路密度值,三环线的道路密度值最低,三环线外道路密度值逐渐降低。
图5 武汉市5个城市要素的空间分布
Fig. 5 The spatial distribution of five urban elements in Wuhan city
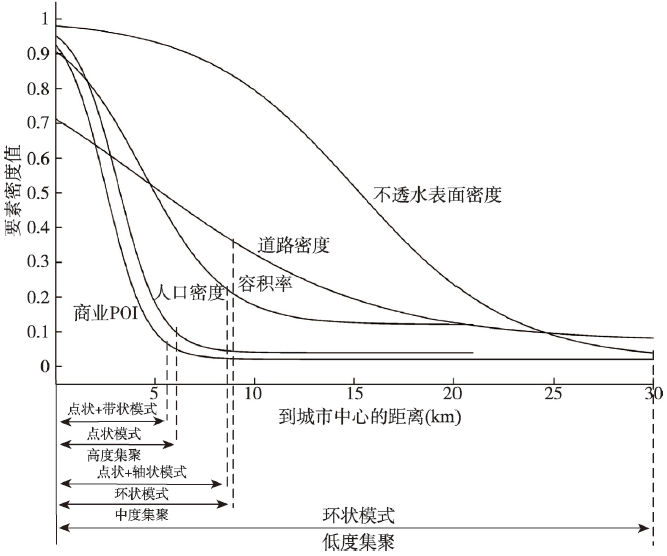
图6 武汉市不同城市要素密度曲线、空间集聚度与模式
Fig. 6 Density curves, concentration degrees and distribution patterns of urban elements in Wuhan city
(2)点状模式:该模式在商业POI、人口密度、容积率、道路密度等城市要素的空间分布中均有发生,主要在城市次中心及城市组团中心点状集聚表现明显。商业POI、人口密度、容积率、道路密度均在江汉路主中心核密度值最高,集聚显著。人口密度在中南、钟家村等城市次中心呈现点状集聚。商业POI在司门口、中南、街道口等城市次中心形成各自的点状集聚,由此也形成了相应的商圈,其点状集聚的分布与城市中心结构相对应。容积率在钟家村、司门口等城市次中心以及部分城市组团区域呈现点状集聚。
(3)轴状/带状模式:该模式主要是依托城市交通干线和城市河流等形成带状或轴状分布。从图5中可以看出,商业POI密度形成了以江汉路主中心为核心,沿东西方向在武珞路的司门口、中南、街道口多个中心的垂江商务带状轴线。容积率的空间分布整体上呈现南北方向的长江左岸二七、江汉路、钟家村、鹦鹉轴状与长江右岸的杨园、司门口、紫阳路轴状分布模式。
从表4和图6中可看到,商业POI、人口密度均高度集聚于城市核心区,集聚模式主要是点状模式和带状模式相结合,中心指向性高。中度集聚的容积率和道路密度主要呈现以点状模式、轴状模式及环状模式相结合的集聚分布模式。低度集聚的不透水表面密度呈现以环状模式为主的分布模式。
城市要素的集聚程度与集聚模式有一定的对应联系。高度集聚的城市要素是点状模式与带状模式相结合的分布模式。该模式是要素向心集聚最为明显的集聚分布,以点状集聚模式为基础,整体上形成带状模式。中度集聚的城市要素是点状模式、环状模式与轴状模式相结合的分布模式。该模式不仅对城市主次中心和次中心依赖明显,对城市的交通干线及景观资源等依赖较大。低度集聚的城市要素其分布模式是环状模式,以蔓延扩散的密度衰减为主。
表4 武汉市不同城市要素空间集聚度与模式
Tab. 4 Concentration degrees and distribution patterns of different urban elements in Wuhan city
| 商业POI | 人口密度 | 容积率 | 道路密度 | 不透水表面密度 | |
|---|---|---|---|---|---|
| 集聚程度 | 高度集聚 | 高度集聚 | 中度集聚 | 中度集聚 | 低度集聚 |
| 集聚模式 | 点状+带状 | 点状 | 点状+轴状+环状 | 环状 | 环状 |
| 中心指向性 | 极高 | 高 | 较高 | 中 | 低 |
(1)城市中心的吸引力作用是城市要素向心集聚的重要基础。城市要素以不同的集聚程度集聚在城市主中心、城市次中心及城市规划组团中心的现象揭示了城市中心对不同的城市要素具有不同程度的吸引力作用。城市主中心的吸引力最大,在江汉路主城市中心的吸引力作用下,城市人口、城市经济与城市土地利用集聚显著发生。商业POI、人口密度、容积率、道路密度等在主中心周边形成核心集聚。城市次中心吸引了一定程度的商业POI、人口、容积率及道路密度的集聚,如商业POI、人口等在中南次中心集聚,道路密度、容积率在司门口次中心、徐东次中心集聚。城市规划组团中心吸引力最低,商业POI、人口在低层级的组团中心区域集聚不明显,但容积率、道路密度有不同程度的集聚发生,如容积率在二七、常青等组团中心集聚,道路密度在冶金、古田等组团中心较高。
(2)城市立体空间开发促进了城市要素的向心集聚。不透水表面密度、道路密度表现了平面土地利用状况。城市人口、城市经济等依托城市建筑的城市要素则反映了城市的立体空间开发状况。随着武汉市的城市建设不断发展,城市中心的基础设施与公共服务设施不断完善,城市人口、商业活动不断涌入中心城区,城市中心的土地利用日益紧张,城市土地平面利用向立体空间开发不断发展。中心城区出现了众多容积率较高的集聚区域,如中山大道与崇仁路交汇处两侧、友谊路两侧区域。
(3)交通干线对城市要素密度形态的重塑促进了带状模式和环状模式形成。轴向城市干道、交通环线重塑了城市要素的集聚形态。交通干线沿线土地的可达性较强,依据阿伦索的地租理论,商业用地、居住用地等按照自己的区位选择与付租能力在道路两侧沿线进行布局[39]。中山大道两侧4个城市要素均明显集聚,武珞路、珞瑜路、建设大道、京汉大道两侧商业POI集聚,中南路、汉阳大道两侧人口密度集聚,鹦鹉大道、解放路、复兴路、常青一路两侧容积率较高。轨道交通1号线、2号线、3号线、4号线、6号线的建设开通也大大推动了轨道沿线的土地立体空间的利用。城市交通环线是城市要素呈现从城市中心向外呈环状递减的重要影响因素,进一步重塑了道路密度、不透水表面密度的环状模式。
(4)稀缺景观资源在城市要素集聚中显现了廊道效应。“江、湖、山、城”是武汉市的自然生态格局,长江和汉江交汇、大小湖泊成为城市独特景观资源。稀缺的景观资源促进了其周边土地利用的“向上发展”。本文中容积率的沿江轴状布局的空间分布模式直观地反映了长江景观带对城市建设发展的影响。
空间集聚是城市要素分布的基本特征。本文针对城市不透水表面、道路、商业、人口、容积率等多种城市要素,采用核密度分析、梯度分析、函数拟合等方法,研究了城市要素集聚的程度和模式,并初步探讨了其形成机理。研究发现,多种城市要素的密度分布总体上符合反S型圈层递减规律。商业、人口呈现高度集聚,容积率、道路密度表现为中度集聚,不透水表面密度的集聚程度最低。要素集聚的空间模式可以划分为点状模式、带状/轴状模式与环状模式,高度集聚的城市要素分布主要表现为点状模式与带状模式,中度集聚的城市要素分布呈现点状、环状与轴状模式相结合,低度集聚的城市要素主要表现为环状模式。城市中心的吸引、立体空间开发等促进了城市要素的向心集聚,交通干线、稀缺景观资源的廊道效应等重塑了城市要素的空间分布形态。
后续研究需要进一步深入,如:除本文涉及的要素以外的其他要素的空间集聚模式,小尺度上要素集聚的空间异质性特征,以及城市要素集聚的时空过程机理等。
The authors have declared that no competing interests exist.
| [1] |
The Death and Life of Great American Cities. |
| [2] |
Urban agglomeration: Theory and evidence [D]. 城市集聚:理论与证据[D] . |
| [3] |
Form follows function: Reformulating urban population density functions. https://doi.org/10.1080/00420989220081041 URL [本文引用: 1] 摘要
In this paper, we argue that the most appropriate form for urban population density models is the inverse power function, contrary to conventional practice, which is largely based upon the negative exponential. We first show that the inverse power function has several theoretical properties which have hitherto gone unremarked in the literature. Our main argument, however, is based on the notion that a density function should describe the extent to which the space available for urban development is filled. To this end, we introduce ideas from urban allometry and fractal geometry to demonstrate that the inverse power model is the only function which embodies the fractal property of self-similarity which we consider to be a basic characteristic of urban form and density. In short, we show that the distance parameter 伪 of the inverse power model is a measure of the extent to which space is filled, and that its value is determined by the basic relation D + 伪 = 2 where is the fractal dimension of the city in question. We then test this model using four data sets which measure the density and morphology of the city of Seoul. Using a variety of estimation methods such as loglinear regression, dimensional approximation and entropy-maximising, we estimate dimension and density parameters for 136 variants of the function and its data sets. From these estimates, 125 are within the values hypothesised and this suggests fairly conclusively that the value of the density parameter 伪 for the inverse power function should be within the range 0鈥1 and probably between 0.2 and 0.5. Many related questions are raised by this analysis which will form the subject of future research.
|
| [4] |
Urban population densities.
|
| [5] |
Regional population density function and spatial patterns of economic growth in China [D].
中国区域人口密度模型及经济增长的空间模式[D] .
|
| [6] |
Modeling the spatial distribution of urban population density and its evolution in Hangzhou. https://doi.org/10.3321/j.issn:1000-0585.2002.05.013 URL Magsci [本文引用: 1] 摘要
<p>基于四次人口普查数据 ,本文探讨了杭州城市人口密度的空间分布及其演化规律。首先提取了不同年份城市人口密度的空间分布数据 ;然后根据人口分布的曲线特征对各种可能出现的数学模型进行拟合、比较 ,发现杭州市的人口分布服从Clark模型的修正形式———加幂指数模型 ;借助模型参数进行城市增长及其空间动力学分析 ,发现反映信息熵的约束参数波动升高、渐次逼近于 1,从而揭示 :改革开放以来 ,随着城市演化过程中自组织能力的加强以及郊区化的发展 ,城市空间复杂性程度增高 ,城市内各功能单元的效用增强 ,城市的空间结构进一步趋向新的有序状态。本文借助前沿科学思想及郊区化理论 ,尝试提出一个分析城市人口时空变化规律的完整范例 ,对城市规划和管理工作也具借鉴意义</p>
杭州市人口密度空间分布及其演化的模型研究 .https://doi.org/10.3321/j.issn:1000-0585.2002.05.013 URL Magsci [本文引用: 1] 摘要
<p>基于四次人口普查数据 ,本文探讨了杭州城市人口密度的空间分布及其演化规律。首先提取了不同年份城市人口密度的空间分布数据 ;然后根据人口分布的曲线特征对各种可能出现的数学模型进行拟合、比较 ,发现杭州市的人口分布服从Clark模型的修正形式———加幂指数模型 ;借助模型参数进行城市增长及其空间动力学分析 ,发现反映信息熵的约束参数波动升高、渐次逼近于 1,从而揭示 :改革开放以来 ,随着城市演化过程中自组织能力的加强以及郊区化的发展 ,城市空间复杂性程度增高 ,城市内各功能单元的效用增强 ,城市的空间结构进一步趋向新的有序状态。本文借助前沿科学思想及郊区化理论 ,尝试提出一个分析城市人口时空变化规律的完整范例 ,对城市规划和管理工作也具借鉴意义</p>
|
| [7] |
Spatial agglomeration and evolution of urban population in China. https://doi.org/10.3321/j.issn:0375-5444.2008.10.004 URL [本文引用: 1] 摘要
城市集聚增长日益显著以及城市间连接性的增强等是20世纪90年代以来中国城市发展的显著特征.通过运用GIS环境下的Moran's Ⅰ等技术方法,探讨了1990-2005年中国城市人口的空间集聚特征及其演变规律,结果表明:尽管总体上城市人口的正空间集聚性不强,但局部空间集聚特征明显,存在较强的规律性,主要表现为"T"字型和沿主要铁路交通线的发展态势,而其演变过程体现了中国城市体系空间结构正处在不断优化之中;三大地带城市人口空间集聚的特征反差明显,东部城市区域基本表现为一体化发展趋势,而中西部城市区域则趋向于极化发展或表现出较差的整体协调能力;进一步来看,城市人口空间集聚的不平衡性,不仅体现于区域之间也体现于区域内部的城市之间,且其作用范围进一步扩大,集聚区位有所变化.总体来看,这一典型转型时期里,中国城市人口的空间集聚特征及其演变,体现出了市场力量、经济发展状况、基础设施建设及国家空间开发政策等的积极作用.
中国城市人口的空间集聚特征与规律分析 .https://doi.org/10.3321/j.issn:0375-5444.2008.10.004 URL [本文引用: 1] 摘要
城市集聚增长日益显著以及城市间连接性的增强等是20世纪90年代以来中国城市发展的显著特征.通过运用GIS环境下的Moran's Ⅰ等技术方法,探讨了1990-2005年中国城市人口的空间集聚特征及其演变规律,结果表明:尽管总体上城市人口的正空间集聚性不强,但局部空间集聚特征明显,存在较强的规律性,主要表现为"T"字型和沿主要铁路交通线的发展态势,而其演变过程体现了中国城市体系空间结构正处在不断优化之中;三大地带城市人口空间集聚的特征反差明显,东部城市区域基本表现为一体化发展趋势,而中西部城市区域则趋向于极化发展或表现出较差的整体协调能力;进一步来看,城市人口空间集聚的不平衡性,不仅体现于区域之间也体现于区域内部的城市之间,且其作用范围进一步扩大,集聚区位有所变化.总体来看,这一典型转型时期里,中国城市人口的空间集聚特征及其演变,体现出了市场力量、经济发展状况、基础设施建设及国家空间开发政策等的积极作用.
|
| [8] |
An analysis on characteristics of floating population distribution in Shanghai by means of accumulation index .基于聚集指数测度的上海市流动人口分布特征分析 . |
| [9] |
Geographic concentration in U.S. manufacturing industries: A Dartboard approach. https://doi.org/10.1086/262098 URL [本文引用: 1] 摘要
This paper discusses the prevalence of Silicon Valley-style localizations of individual manufacturing industries in the United States. Several models in which firms choose locations by throwing darts at a map are used to test whether the degree of localization is greater than would be expected to arise randomly and to motivate a new index of geographic concentration. The proposed index controls for differences in the size distribution of plants and for differences in the size of the geographic areas for which data is available. As a consequence, comparisons of the degree of geographic concentration across industries can be made with more confidence. We reaffirm previous observations in finding that almost all industries are localized, although the degree of localization appears to be slight in about half of the industries in our sample. We explore the nature of agglomerative forces in describing patterns of concentration, the geographic scope of localization, and the extent to which agglomerations involve plants in similar as opposed to identical industries.
|
| [10] |
Locations and their determinants of large-scale commercial sites in Changchun,China. https://doi.org/10.11821/dlxb201506004 URL [本文引用: 2] 摘要
以长春市中心城区大型商业网点调研数据为基础,选取专业店、专卖店、大型商场、大型超市、家居建材商店、综合交易市场六种商业业态类型,运用点模式分析、有序多分类逻辑回归等研究方法,探讨长春市大型商业网点的区位特征,并解释其区位选择的影响因素。研究发现:长春市大型商业网点的空间分布总体呈中心集聚与外围分散并存的态势,但集聚现象更显著,并表现出沿城市综合性中心地、商业中心布局的特征;各业态类型网点空间分布差异性较大,且具有不同尺度的空间集聚表现,专业店、大型商场以小尺度范围的空间集聚为主,集聚程度较低;专卖店和综合交易市场的集聚程度相对较高,且后者区位选择的空间尺度范围较大;大型超市在空间上呈均匀离散分布,家居建材商店仅在小尺度范围内表现出集聚分布;业态类型、土地价格、交通通达性及集聚特征是影响商业网点分布最显著的因素,同类因素对不同业态商业网点分布的影响程度差异性较大。
长春市大型商业网点的区位特征及其影响因素 .https://doi.org/10.11821/dlxb201506004 URL [本文引用: 2] 摘要
以长春市中心城区大型商业网点调研数据为基础,选取专业店、专卖店、大型商场、大型超市、家居建材商店、综合交易市场六种商业业态类型,运用点模式分析、有序多分类逻辑回归等研究方法,探讨长春市大型商业网点的区位特征,并解释其区位选择的影响因素。研究发现:长春市大型商业网点的空间分布总体呈中心集聚与外围分散并存的态势,但集聚现象更显著,并表现出沿城市综合性中心地、商业中心布局的特征;各业态类型网点空间分布差异性较大,且具有不同尺度的空间集聚表现,专业店、大型商场以小尺度范围的空间集聚为主,集聚程度较低;专卖店和综合交易市场的集聚程度相对较高,且后者区位选择的空间尺度范围较大;大型超市在空间上呈均匀离散分布,家居建材商店仅在小尺度范围内表现出集聚分布;业态类型、土地价格、交通通达性及集聚特征是影响商业网点分布最显著的因素,同类因素对不同业态商业网点分布的影响程度差异性较大。
|
| [11] |
Industrial distribution and clusters of urban office space in Beijing. https://doi.org/10.11821/xb201110001 URL [本文引用: 1] 摘要
以北京城区6个行政区内的594个抽样写字楼内公司数量、规模和行业隶属为研究样本和数据,运用缓冲区分析和Ripley'sK(d)函数等空间分析方法,探讨在城市经济转型过程中,逐办渐公替活代动制区造位业选的择办具公有活明动显行的业向分心布性与,空其间就集业聚密特度征与。公即司:密①度从表总现体在来以看天,安北门京为城中市心各,行以业5k特m征、显10著k,m、整1体5呈km现为"半东径高的西缓低冲"区,圈城层市结高构端中功由能内区向就外业逐吸渐纳递能减力的强特的点特;点②,其各分行布业大空体间呈分异现3种集聚模式,即"大分散、小集聚"模式,"大分散、大集聚"模式和"小分散、大集聚"在模式差;异③,其各中行,业社空会间服集务聚业趋和势类批似发,零均售呈业先的增办后公减区的位倒可"选U范"围型最结大构,特金征融,业但集其聚空于间特尺定度存区域,区位可选范围偏小,交通运输仓储和邮政业的交通区位指向显著。
北京城市办公空间的行业分布及集聚特征 .https://doi.org/10.11821/xb201110001 URL [本文引用: 1] 摘要
以北京城区6个行政区内的594个抽样写字楼内公司数量、规模和行业隶属为研究样本和数据,运用缓冲区分析和Ripley'sK(d)函数等空间分析方法,探讨在城市经济转型过程中,逐办渐公替活代动制区造位业选的择办具公有活明动显行的业向分心布性与,空其间就集业聚密特度征与。公即司:密①度从表总现体在来以看天,安北门京为城中市心各,行以业5k特m征、显10著k,m、整1体5呈km现为"半东径高的西缓低冲"区,圈城层市结高构端中功由能内区向就外业逐吸渐纳递能减力的强特的点特;点②,其各分行布业大空体间呈分异现3种集聚模式,即"大分散、小集聚"模式,"大分散、大集聚"模式和"小分散、大集聚"在模式差;异③,其各中行,业社空会间服集务聚业趋和势类批似发,零均售呈业先的增办后公减区的位倒可"选U范"围型最结大构,特金征融,业但集其聚空于间特尺定度存区域,区位可选范围偏小,交通运输仓储和邮政业的交通区位指向显著。
|
| [12] |
The characteristics of industrial agglomeration based on micro-geographic data. 基于微观企业数据的产业空间集聚特征分析: 以杭州市区为例 . |
| [13] |
Evaluating the geographic concentration of industries using distance-based methods. https://doi.org/10.1093/jeg/lbg016 URL [本文引用: 1] 摘要
We propose new methods for evaluating the spatial distribution of firms. To assess whether firms are concentrated or dispersed, economists have tradi-tionally used indices that analyse the heterogeneity of a spatial structure at a single geographic level. We introduce distance-based methods, Besag's L function (derived from Ripley's K function) and Diggle and Chetwynd's D function to describe simultaneously spatial distribution at different geographical scales. Our empirical applications consider the distribution of French manufacturing firms in the Paris area and in France generally. For some geographic levels, results show significant concentration or dispersion of firms according to their sector of activity.
|
| [14] |
Comprehensive assessment on the spatial agglomeration of producer services in Beijing. https://doi.org/10.11821/yj2013010011 URL Magsci [本文引用: 1] 摘要
全球经济服务化趋势增强、生产性服务业成为国际大都市主导产业和增长动力背景下,中国大城市正向服务经济迈进,生产性服务业的空间集聚成为影响城市空间重构和功能提升的重要力量。以北京市为案例区,基于基本单位普查和经济普查的大样本企业数据,运用Theil系数、空间基尼系数、赫芬代尔系数、EG指数、空间自相关模型和地理联系率进行城市生产性服务业空间集聚的综合测度研究。结果表明:①基于就业人数的城市生产性服务业空间差异更为明显且呈现扩大趋势,功能区间发展差异的贡献最大。②街区尺度生产性服务业区域集聚程度和企业集中程度均存在时间波动性和行业异质性,控制企业规模的产业集聚普遍存在,但空间集聚程度普遍较低。③城市生产性服务业就业分布呈现显著的空间关联性,首都功能核心区是高密度区与高密度区邻近的集中区域。④流通、信息、商务和科技服务相对于生产性服务业的空间集聚一致性较高,流通、商务和科技服务之间以及信息与科技服务之间的空间集聚一致性较高。
北京市生产性服务业空间集聚综合测度 .https://doi.org/10.11821/yj2013010011 URL Magsci [本文引用: 1] 摘要
全球经济服务化趋势增强、生产性服务业成为国际大都市主导产业和增长动力背景下,中国大城市正向服务经济迈进,生产性服务业的空间集聚成为影响城市空间重构和功能提升的重要力量。以北京市为案例区,基于基本单位普查和经济普查的大样本企业数据,运用Theil系数、空间基尼系数、赫芬代尔系数、EG指数、空间自相关模型和地理联系率进行城市生产性服务业空间集聚的综合测度研究。结果表明:①基于就业人数的城市生产性服务业空间差异更为明显且呈现扩大趋势,功能区间发展差异的贡献最大。②街区尺度生产性服务业区域集聚程度和企业集中程度均存在时间波动性和行业异质性,控制企业规模的产业集聚普遍存在,但空间集聚程度普遍较低。③城市生产性服务业就业分布呈现显著的空间关联性,首都功能核心区是高密度区与高密度区邻近的集中区域。④流通、信息、商务和科技服务相对于生产性服务业的空间集聚一致性较高,流通、商务和科技服务之间以及信息与科技服务之间的空间集聚一致性较高。
|
| [15] |
Agglomeration of services in American metropolitan areas. https://doi.org/10.1111/j.1468-2257.1989.tb00494.x URL [本文引用: 1] 摘要
The growth of many service industries among American metropolitan areas stem from an eclectic set of forces. These include market penetration effects of increasing importance of services throughout the economy, agglomeration effects in immature and deregulated industries, and institutional and infrastructure constraints. These diverse forces are interpreted as urbanization and localization economies. A cycle of centralization of 27 fast growing service industries is documented for MS As in the period 1977-84. The two agglomeration effects are tested directly, using a power function model that relates employment and establishment growth to MSA size and initial level of employment in a local industry. Localization economies rather than the general advantages of metropolitan size best explain the growth patterns. This result implies that service industrial complexes are rapidly emerging in American metropolitan areas.
|
| [16] |
The spatial distribution of producer services in Shanghai. https://doi.org/10.1177/0042098009102133 URL [本文引用: 1] 摘要
This paper examines the location characteristics of the newly emerged producer services in Shanghai. The research questions are: how does the location of producer services fit into Shanghai's spatial context? What are the factors shaping the spatial distribution pattern? Are the spatial distribution and its determinants similar to those observed in other cities? Analyses of data collected from field reconnaissance, interviews and secondary sources reveal that the spatial distribution of producer services in Shanghai is characterised by concentration and dispersion. The concentration of producer services in an extensive central-city core is similar to that observed in other cities. However, the wide spread of producer services over a fairly big region is unexpected. The paper adds insight to the study of producer services by contending that contextual factors such as an indigenous path of development, state intervention and market institution, determine the location of producer services in Shanghai.
|
| [17] |
The spatial agglomeration characteristics of automotive service industry: A case study of Nanjing. 城市汽车服务业空间集聚特征研究: 以南京市为例 . |
| [18] |
Retail center recognition and spatial aggregating feature analysis of retail formats in Guangzhou based on POI data. https://doi.org/10.11821/dlyj201604009 URL Magsci [本文引用: 1] 摘要
商业中心是城市零售活动的重要载体,优化商业资源在城市内部空间的合理配置,摸清不同零售经营形态的区位选择,显得尤为重要。以面向公众服务的商业机构兴趣点(POI)数据为研究对象,提出一种城市商业中心与零售业态集聚区识别的方法;以广州市为例,分析商业活动的热点地区以及零售业态集聚区的空间分布特征。研究表明:1根据核密度估计法提取的商业中心在等级上表现出由城市中心圈层向外围圈层扩散的趋势,结果符合客观事实。2以街区为单元,商业网点密度符合局域Getis-Ord G*指数统计特征的热点区域主要分布在越秀区和天河区,广州市零售业发展的双核心空间格局已经形成。3不同的零售业态对商业集聚的区位选择具有显著差异性,百货商店、超市、便利店等零售经营形态的空间集聚特征与该业态的市场定位、经营模式及选址策略基本吻合。总体来看,基于POI数据的广州零售业集聚空间分析结果能够反映实体零售企业行为与广州商业经济分布的相关性,有助于提高政府部门商业规划和零售商选址前期研究的客观性和科学性。
基于POI数据的广州零售商业中心热点识别与业态集聚特征分析 .https://doi.org/10.11821/dlyj201604009 URL Magsci [本文引用: 1] 摘要
商业中心是城市零售活动的重要载体,优化商业资源在城市内部空间的合理配置,摸清不同零售经营形态的区位选择,显得尤为重要。以面向公众服务的商业机构兴趣点(POI)数据为研究对象,提出一种城市商业中心与零售业态集聚区识别的方法;以广州市为例,分析商业活动的热点地区以及零售业态集聚区的空间分布特征。研究表明:1根据核密度估计法提取的商业中心在等级上表现出由城市中心圈层向外围圈层扩散的趋势,结果符合客观事实。2以街区为单元,商业网点密度符合局域Getis-Ord G*指数统计特征的热点区域主要分布在越秀区和天河区,广州市零售业发展的双核心空间格局已经形成。3不同的零售业态对商业集聚的区位选择具有显著差异性,百货商店、超市、便利店等零售经营形态的空间集聚特征与该业态的市场定位、经营模式及选址策略基本吻合。总体来看,基于POI数据的广州零售业集聚空间分析结果能够反映实体零售企业行为与广州商业经济分布的相关性,有助于提高政府部门商业规划和零售商选址前期研究的客观性和科学性。
|
| [19] |
Agglomerate types of retail business around urban subway station: Taking Guangzhou as an example. 城市地铁站口零售商业集聚类型划分的探讨: 以广州为例 . |
| [20] |
Spatial variation and its mechanism of Lanzhou's capital density from 1949 to 2005. 1949年以来兰州城市资本密度空间变化及其机制 . |
| [21] |
Research on spatial structure of urban land use intensity of Beijing. https://doi.org/10.3969/j.issn.1001-8158.2009.03.006 URL 摘要
研究目的:剖析北京市城市土地 利用强度的空间结构形态,揭示其特征及影响因素,检验和丰富城市经济学的空间结构理论。研究方法:利用1993—2006年北京市国有土地使用权出让数 据,借助GIS分析工具,定性分析与定量分析相结合。研究结论:总体上北京市城市土利用强度空间结构与西方市场经济国家城市存在一定的一致性,呈现出符合 级差地租理论的特征;但具体看,受多种因素的影响,远比城市空间结构理论模型预测的结果复杂,表现出鲜明的个性特征;除市场力量以外,人口政策、容积率控 制和交通格局的影响最为重要。
北京市城市土地利用强度空间结构研究 .https://doi.org/10.3969/j.issn.1001-8158.2009.03.006 URL 摘要
研究目的:剖析北京市城市土地 利用强度的空间结构形态,揭示其特征及影响因素,检验和丰富城市经济学的空间结构理论。研究方法:利用1993—2006年北京市国有土地使用权出让数 据,借助GIS分析工具,定性分析与定量分析相结合。研究结论:总体上北京市城市土利用强度空间结构与西方市场经济国家城市存在一定的一致性,呈现出符合 级差地租理论的特征;但具体看,受多种因素的影响,远比城市空间结构理论模型预测的结果复杂,表现出鲜明的个性特征;除市场力量以外,人口政策、容积率控 制和交通格局的影响最为重要。
|
| [22] |
The spatial and temporal characteristics of residential floor area ratio in metropolitan at multi-scales based on Internet real estate data: Case study of Guangzhou. https://doi.org/10.11821/dlyj201604014 URL Magsci 摘要
<p>基于网络爬虫技术获取房产时空数据,结合时间序列和空间自相关分析方法,在“小区—街道—区级”多尺度上探索广州市住宅容积率时空模式与演化规律。结果表明:① 近三十年广州市居住空间呈现中心城区集聚开发—向南、北方向近郊区拓展—往南、北、东方向远郊区外扩的演变过程,容积率呈现波动式增长态势。② 随着房地产的快速发展,住宅容积率逐渐呈现显著的空间自相关特征,体现了住宅开发与规划有序性的提高。③ 区级尺度上容积率呈现较强的自相关性,越秀区与天河区为HH集聚区,从化区为LL集聚区。街道尺度上容积率呈现出显著的空间不均衡性,区位交通条件较好的街道成为容积率HH集聚区,而LL集聚区主要分布于生态旅游重镇。</p>
基于互联网房产数据的住宅容积率多尺度时空特征: 以广州市为例 .https://doi.org/10.11821/dlyj201604014 URL Magsci 摘要
<p>基于网络爬虫技术获取房产时空数据,结合时间序列和空间自相关分析方法,在“小区—街道—区级”多尺度上探索广州市住宅容积率时空模式与演化规律。结果表明:① 近三十年广州市居住空间呈现中心城区集聚开发—向南、北方向近郊区拓展—往南、北、东方向远郊区外扩的演变过程,容积率呈现波动式增长态势。② 随着房地产的快速发展,住宅容积率逐渐呈现显著的空间自相关特征,体现了住宅开发与规划有序性的提高。③ 区级尺度上容积率呈现较强的自相关性,越秀区与天河区为HH集聚区,从化区为LL集聚区。街道尺度上容积率呈现出显著的空间不均衡性,区位交通条件较好的街道成为容积率HH集聚区,而LL集聚区主要分布于生态旅游重镇。</p>
|
| [23] |
The spatial change of urban capital density and its mechanism in China: A case study of Lanzhou. https://doi.org/10.1109/CLEOE-EQEC.2009.5194697 URL Magsci [本文引用: 1] 摘要
构建了计划经济时期和转轨期中国城市资本密度空间分布的理论模型,并与市场经济体制的同类模型了对比研究,以兰州市为例,利用高精度卫星影像和大规模实地调查方法获取数据,采用GIS和数理统计方法,利用容积率指标,分区、分行业进行了实证研究。结果表明:市场经济体制、计划经济体制和转轨期中国城市资本密度由中心到外围的空间变化规律并不相同,而后者居于前两者之间,存在向市场经济空间模型靠近的趋势;计划经济体制、转轨期的中国城市土地利用由中心到外围为商务→住宅→工业→农业模式;转轨期容积率比计划经济时期均有不同程度提高,住宅、商务等建筑容积率的空间分布模型更接近市场经济体制下的模型;住宅、商务、工业等建筑容积率依次递减在一定程度上解释了住宅、商务用地的向心分布和工业用地外迁的现象。
中国城市资本密度空间变化与机制: 以兰州市为例 .https://doi.org/10.1109/CLEOE-EQEC.2009.5194697 URL Magsci [本文引用: 1] 摘要
构建了计划经济时期和转轨期中国城市资本密度空间分布的理论模型,并与市场经济体制的同类模型了对比研究,以兰州市为例,利用高精度卫星影像和大规模实地调查方法获取数据,采用GIS和数理统计方法,利用容积率指标,分区、分行业进行了实证研究。结果表明:市场经济体制、计划经济体制和转轨期中国城市资本密度由中心到外围的空间变化规律并不相同,而后者居于前两者之间,存在向市场经济空间模型靠近的趋势;计划经济体制、转轨期的中国城市土地利用由中心到外围为商务→住宅→工业→农业模式;转轨期容积率比计划经济时期均有不同程度提高,住宅、商务等建筑容积率的空间分布模型更接近市场经济体制下的模型;住宅、商务、工业等建筑容积率依次递减在一定程度上解释了住宅、商务用地的向心分布和工业用地外迁的现象。
|
| [24] |
Analyzing the information entropy and fractal dimension of urban land use spatial evolving process from 1900 to 2004 in Changchun City. https://doi.org/10.3969/j.issn.1002-1175.2007.01.011 URL [本文引用: 1] 摘要
The spatial information of urban land use in Changchun city, China in 1900,1930,1954,1976,1990 and 2004 is extracted by integrating SPOT5 images, relief maps and urban planning maps and other spatial data based on remote sensing and GIS. The land use information entropy and fractal dimension and mechanism of urban spatial evolving process is analyzed in Changchun city in the 100 years based information entropy, fractal dimension and spatial variation model. The results show that the land use information entropy increased except for 1990 and urban land types diversifies and its structure became balanced in Changchun in the 100 years. The Spatial variation function of land use information entropy accord with exponential model. The ratio of nugget and sill increases, which indicates its spatial auto-correlation decreased and the homogeneous character became weakened. Commercial land gathers toward the center of the internal circle. By contrary, industry land clusters in the urban fringe. The fractal dimension of urban evolving indicates the character of self-organizing. Social regime, urban roads, urban land price and urban planning are the important factors to the land use information entropy and fractal dimension of urban spatial evolving process.
长春市百年城市土地利用空间结构演变的信息熵与分形机制研究 .https://doi.org/10.3969/j.issn.1002-1175.2007.01.011 URL [本文引用: 1] 摘要
The spatial information of urban land use in Changchun city, China in 1900,1930,1954,1976,1990 and 2004 is extracted by integrating SPOT5 images, relief maps and urban planning maps and other spatial data based on remote sensing and GIS. The land use information entropy and fractal dimension and mechanism of urban spatial evolving process is analyzed in Changchun city in the 100 years based information entropy, fractal dimension and spatial variation model. The results show that the land use information entropy increased except for 1990 and urban land types diversifies and its structure became balanced in Changchun in the 100 years. The Spatial variation function of land use information entropy accord with exponential model. The ratio of nugget and sill increases, which indicates its spatial auto-correlation decreased and the homogeneous character became weakened. Commercial land gathers toward the center of the internal circle. By contrary, industry land clusters in the urban fringe. The fractal dimension of urban evolving indicates the character of self-organizing. Social regime, urban roads, urban land price and urban planning are the important factors to the land use information entropy and fractal dimension of urban spatial evolving process.
|
| [25] |
Spatial concentration characteristics of urban land use along highways in rapidly urbanized region of Shenzhen. 深圳快速城市化地区公路沿线土地利用空间集聚 . |
| [26] |
The evolution pattern and mechanism of public service facilities lands in Changchun. https://doi.org/10.11821/dlxb201512007 URL [本文引用: 1] 摘要
公共服务设施用地是城市功能用地的主要组成部分,公共服务设施用地的集聚与扩散可以更直接地揭示城市空间结构与城市中心地的演变特征。本文以长春市中心城区为研究范围,利用城市用地现状图、地形图等数据资源,借助GIS软件,采用核密度、斑块聚合度指数等方法,分析了长春市2003-2013年公共服务设施用地演变特征与机制。研究发现:公共服务设施用地规模增速低于城市建成区的增速;公共服务设施用地演变特征的圈层差异明显;公共服务设施用地空间结构从"单一化核心+多次级中心"到"多样化核心+多次级中心",空间格局从"大分散、小集中"到"大集中、小分散";城市不同公共服务设施用地类型表现出不同的演变特征;城市公共服务设施用地演变机制为城市功能空间的整体提升、城市功能空间的互动耦合、土地利用的市场竞争、交通设施与网络的完善、城市规划的引导与调控、城市大事件的快速推动。
长春市公共服务设施用地演变格局与机制 .https://doi.org/10.11821/dlxb201512007 URL [本文引用: 1] 摘要
公共服务设施用地是城市功能用地的主要组成部分,公共服务设施用地的集聚与扩散可以更直接地揭示城市空间结构与城市中心地的演变特征。本文以长春市中心城区为研究范围,利用城市用地现状图、地形图等数据资源,借助GIS软件,采用核密度、斑块聚合度指数等方法,分析了长春市2003-2013年公共服务设施用地演变特征与机制。研究发现:公共服务设施用地规模增速低于城市建成区的增速;公共服务设施用地演变特征的圈层差异明显;公共服务设施用地空间结构从"单一化核心+多次级中心"到"多样化核心+多次级中心",空间格局从"大分散、小集中"到"大集中、小分散";城市不同公共服务设施用地类型表现出不同的演变特征;城市公共服务设施用地演变机制为城市功能空间的整体提升、城市功能空间的互动耦合、土地利用的市场竞争、交通设施与网络的完善、城市规划的引导与调控、城市大事件的快速推动。
|
| [27] |
Li YangBing, Feng Yongli. Spatial distribution of road density in Chongqing based on GIS.
以重庆市县域为研究单元,选取2006年重庆市1∶166万基础地理信息数据中的道路网络数据为参考底图,利用ArcGIS的叠加分析和空间分析功能,研究了重庆市县域道路密度的空间分布差异。在道路密度研究的基础上,对各县(片)区的路网密度分布差异从社会经济和地形等方面,进行了相关分析和讨论。结果表明,2006年重庆市各区县道路密度的空间分布具有明显的集聚特征和地带性,重庆西部渝中区、沙坪坝区、九龙坡区等道路网密度较高,东北部的城口、东南部的丰都等区县道路网密度较低,揭示出重庆市道路密度空间分布的不均衡性;部分区县的道路网密度较高,与周边地区的差异相对显著,但尚未连接成面或完全均质化,主要包括西部铜梁片区、东南的丰都等区县;各区县不同等级道路密度空间分异也不尽相同;与地形、经济、人口、城镇用地的相关性研究中发现,重庆市道路密度分布格局与重庆的地势走向和地貌组成的地区分异大体吻合,与各区县GDP发展的空间水平基本耦合,与人口的相关性密切,并且道路网络的不断完善加速了城镇建设用地的外扩。
基于GIS的重庆市道路密度的空间分异 .
以重庆市县域为研究单元,选取2006年重庆市1∶166万基础地理信息数据中的道路网络数据为参考底图,利用ArcGIS的叠加分析和空间分析功能,研究了重庆市县域道路密度的空间分布差异。在道路密度研究的基础上,对各县(片)区的路网密度分布差异从社会经济和地形等方面,进行了相关分析和讨论。结果表明,2006年重庆市各区县道路密度的空间分布具有明显的集聚特征和地带性,重庆西部渝中区、沙坪坝区、九龙坡区等道路网密度较高,东北部的城口、东南部的丰都等区县道路网密度较低,揭示出重庆市道路密度空间分布的不均衡性;部分区县的道路网密度较高,与周边地区的差异相对显著,但尚未连接成面或完全均质化,主要包括西部铜梁片区、东南的丰都等区县;各区县不同等级道路密度空间分异也不尽相同;与地形、经济、人口、城镇用地的相关性研究中发现,重庆市道路密度分布格局与重庆的地势走向和地貌组成的地区分异大体吻合,与各区县GDP发展的空间水平基本耦合,与人口的相关性密切,并且道路网络的不断完善加速了城镇建设用地的外扩。
|
| [28] |
Urban land density function: A new method to characterize urban expansion. https://doi.org/10.1016/j.landurbplan.2015.02.017 URL [本文引用: 2] 摘要
Density analysis lies at the core of studies on urban expansion; however, many methods in urban land density analysis are arbitrary and suffer from the lack of an established foundation. We observed an 鈥淚nverse S-shape Rule鈥 for urban land density that varies outward from an urban center by investigating 28 major cities in China at three time points. We proposed an inverse S-shaped function to formulate urban land density, which fit well for all of the cities in our sample using a nonlinear least squares fitting method. The parameters of the function explicitly describe the basic properties of an urban form. Based on the fitted functions, we derived an established method for the concentric partitioning of urban area and further proposed indicators to measure the urban compactness, urban expansion rate, and degree of urban sprawl. These indicators are practical for characterizing urban form and urban sprawl for either a single city or for multiple cities. A case study on major Chinese cities from 1990 to 2010 reveals that most of the cities expanded rapidly and became less compact and more dispersed during those two decades. However, most of the cities grew faster and showed more sprawl in the second decade compared to the first one. Discussions show that the model is also applicable for non-monocentric cities and possibly can be applied to many other geographical phenomena.
|
| [29] |
Detecting "Hot Spots" of facility POIs based on Kernel Density Estimation and spatial autocorrelation technique. https://doi.org/10.13203/j.whugis20140092 URL Magsci [本文引用: 1] 摘要
城市设施兴趣点(POI)在局部地理空间下往往呈现聚集型分布特征(即热点),表达该特征的核密度法(kernel density estimation)是最常用到的可视化工具。考虑到核密度方法中缺少量化统计分析,提出了一种城市设施POI分布热点探测的新方法。首先基于"距离衰减效应"计算地理单元的属性值;然后采用Getis-Ord <i>G</i><sub><i>i</i></sub><sup>*</sup>统计指数定量分析设施POI点的局部空间相关性特征。与传统基于样方法的空间自相关相比,核密度法由于顾及了地理学第一定律的区位影响,计算获得的地理单元属性值可保留空间的细节信息,热点的空间自相关分析结果可以反映设施服务影响的连续性特征。通过实际金融设施数据的自相关分析实验,表明该方法能有效提取POI基础设施在城市区域中的分布热点范围。
利用核密度与空间自相关进行城市设施兴趣点分布热点探测 .https://doi.org/10.13203/j.whugis20140092 URL Magsci [本文引用: 1] 摘要
城市设施兴趣点(POI)在局部地理空间下往往呈现聚集型分布特征(即热点),表达该特征的核密度法(kernel density estimation)是最常用到的可视化工具。考虑到核密度方法中缺少量化统计分析,提出了一种城市设施POI分布热点探测的新方法。首先基于"距离衰减效应"计算地理单元的属性值;然后采用Getis-Ord <i>G</i><sub><i>i</i></sub><sup>*</sup>统计指数定量分析设施POI点的局部空间相关性特征。与传统基于样方法的空间自相关相比,核密度法由于顾及了地理学第一定律的区位影响,计算获得的地理单元属性值可保留空间的细节信息,热点的空间自相关分析结果可以反映设施服务影响的连续性特征。通过实际金融设施数据的自相关分析实验,表明该方法能有效提取POI基础设施在城市区域中的分布热点范围。
|
| [30] |
The local spatial autocorrelation and the kernel method for identifying black zones:A comparative approach. https://doi.org/10.1016/S0001-4575(02)00107-0 URL PMID: 12971934 [本文引用: 1] 摘要
This article aims to determine the location and the length of road sections characterized by a concentration of accidents (black zones). Two methods are compared: one based on a local decomposition of a global autocorrelation index, the other on kernel estimation. After explanation, both methods are applied and compared in terms of operational results, respective advantages and shortcomings, as well as underlying conceptual elements. The operationality of both methods is illustrated by an application to one Belgian road.
|
| [31] |
Spatial-temporal response of green land fragmentation patterns to urban expansion in Wuhan metropolitan area.
基于武汉都市区1989年、2001年和2013年三期Landsat影像,选取景观格局指标反映绿地破碎化程度;利用梯度分析刻画绿地破碎度的空间格局及其对城市扩张的时空响应。景观格局指标总体特征表明:在城市扩张压力下,都市区绿地面积比例由82%减少为62%,绿地景观破碎度明显上升。梯度分析表明:1989-2013年,各缓冲带上建设用地比例逐年上升,而绿地面积比呈下降趋势;主城区建设用地破碎度下降,高破碎区向三环线外转移;耕地破碎度在各缓冲带上逐年上升,且随着与城市中心距离的增加,耕地破碎度降低;而林地破碎度略微下降,城市扩张对主城区外土地利用景观影响加剧。关联分析表明:城市扩张强度向主城区外推移加速,耕地破碎度变化强的区域向三环线外转移,而林地破碎度变化强度呈显著的时空分异特征;城市扩张在数量、格局及强度方面与绿地破碎化格局显著关联。研究结果可为研究区的城市规划和生态环境保护提供决策依据。
武汉都市区绿地破碎化格局对城市扩张的时空响应 .
基于武汉都市区1989年、2001年和2013年三期Landsat影像,选取景观格局指标反映绿地破碎化程度;利用梯度分析刻画绿地破碎度的空间格局及其对城市扩张的时空响应。景观格局指标总体特征表明:在城市扩张压力下,都市区绿地面积比例由82%减少为62%,绿地景观破碎度明显上升。梯度分析表明:1989-2013年,各缓冲带上建设用地比例逐年上升,而绿地面积比呈下降趋势;主城区建设用地破碎度下降,高破碎区向三环线外转移;耕地破碎度在各缓冲带上逐年上升,且随着与城市中心距离的增加,耕地破碎度降低;而林地破碎度略微下降,城市扩张对主城区外土地利用景观影响加剧。关联分析表明:城市扩张强度向主城区外推移加速,耕地破碎度变化强的区域向三环线外转移,而林地破碎度变化强度呈显著的时空分异特征;城市扩张在数量、格局及强度方面与绿地破碎化格局显著关联。研究结果可为研究区的城市规划和生态环境保护提供决策依据。
|
| [32] |
Characterizing urban expansion of main metropolises in China based on built-up densities in concentric rings. https://doi.org/10.11870/cjlyzyyhj201510014 URL Magsci [本文引用: 1] 摘要
Over the past two decades, metropolises in China witnessed unprecedented growth rates in urban areas. The rapid growth of urban space could lead to a series of problems. The fact that China has the largest population manifests the negative consequences of urban expansion. A rigorous and quantitative comparison of urban growth among metropolitan areas will lend basic support to policy making on regional urban development and will help city planners, economists, environmentalists, etc. This study analyzed the spatiotemporal patterns of urban expansion at different distance from city center in 27 metropolises in China using multi-temporal remotely sensed data. We use three satellite images obtained from the Landsat Thematic Mapper (TM) and Enhanced Thematic Mapper Plus (ETM+) sensor system circa 1990, 2000 and 2010 for each city to develop maps of urban areas. A concentric partitioning method was employed to define urban core area and urban fringe on the basis of built-up density calculated in a series of 1km concentric rings. Urbanization Concentricity Index was proposed to measure the degree to which residential or non-residential development is close to urban core area. Then we calculated and analyzed Urbanization Intensive Index across a series of 1km buffer zones for each city to identify the location-based spatiotemporal patterns of urbanization. UII offers a measure of speed and intensity of urban expansion. The results showed that the spatial structure of these cities was closely related to national policies for regional development, demonstrating obvious regional characteristics. In general, the UCI value of the cities in western and northeastern China is higher in central and eastern China. Most cities exhibited lower UCI value in 2010 compared with 1990, showing a tendency toward dispersion. The highest UII for each city usually occurs around the urban core area and move outward over time. The UII value for second- and third-tier cities became quite small in rings more than 20 km away from city center. The area close to city center witnessed higher UII value in the first decade as compared with the second one. On the contrary, the UII value for the buffer zones away from the city center was much larger in the second decade. Urban form also correlated to the level of economic development to some extent. In the first decade, first-tier cities expanded more intensely and broadly than other cities. Some Second-and third-tier cities experienced significant urban expansion in the second decade, demonstrating a tendency towards decentralization in their development pattern. In 1990, almost all metropolises in China exhibited a trend of comprising one single large central area for the entire landscape. With the expansion of urban land and rapid new nuclei development, some developed cities exhibited a transition of urban space from being mono-centric to multi-nucleated in form, with the emergence of some sub-centers. However, some relatively less developed cities still retained their mono-centric urban space. It can be inferred that urban structure tends to transform from being monocentric to polycentric with the continuous development of economy.
基于圈层建设用地密度分析的中国主要城市扩张的时空特征 .https://doi.org/10.11870/cjlyzyyhj201510014 URL Magsci [本文引用: 1] 摘要
Over the past two decades, metropolises in China witnessed unprecedented growth rates in urban areas. The rapid growth of urban space could lead to a series of problems. The fact that China has the largest population manifests the negative consequences of urban expansion. A rigorous and quantitative comparison of urban growth among metropolitan areas will lend basic support to policy making on regional urban development and will help city planners, economists, environmentalists, etc. This study analyzed the spatiotemporal patterns of urban expansion at different distance from city center in 27 metropolises in China using multi-temporal remotely sensed data. We use three satellite images obtained from the Landsat Thematic Mapper (TM) and Enhanced Thematic Mapper Plus (ETM+) sensor system circa 1990, 2000 and 2010 for each city to develop maps of urban areas. A concentric partitioning method was employed to define urban core area and urban fringe on the basis of built-up density calculated in a series of 1km concentric rings. Urbanization Concentricity Index was proposed to measure the degree to which residential or non-residential development is close to urban core area. Then we calculated and analyzed Urbanization Intensive Index across a series of 1km buffer zones for each city to identify the location-based spatiotemporal patterns of urbanization. UII offers a measure of speed and intensity of urban expansion. The results showed that the spatial structure of these cities was closely related to national policies for regional development, demonstrating obvious regional characteristics. In general, the UCI value of the cities in western and northeastern China is higher in central and eastern China. Most cities exhibited lower UCI value in 2010 compared with 1990, showing a tendency toward dispersion. The highest UII for each city usually occurs around the urban core area and move outward over time. The UII value for second- and third-tier cities became quite small in rings more than 20 km away from city center. The area close to city center witnessed higher UII value in the first decade as compared with the second one. On the contrary, the UII value for the buffer zones away from the city center was much larger in the second decade. Urban form also correlated to the level of economic development to some extent. In the first decade, first-tier cities expanded more intensely and broadly than other cities. Some Second-and third-tier cities experienced significant urban expansion in the second decade, demonstrating a tendency towards decentralization in their development pattern. In 1990, almost all metropolises in China exhibited a trend of comprising one single large central area for the entire landscape. With the expansion of urban land and rapid new nuclei development, some developed cities exhibited a transition of urban space from being mono-centric to multi-nucleated in form, with the emergence of some sub-centers. However, some relatively less developed cities still retained their mono-centric urban space. It can be inferred that urban structure tends to transform from being monocentric to polycentric with the continuous development of economy.
|
| [33] |
The analysis and delimitation of Central Business District using network kernel density estimation. https://doi.org/10.1016/j.jtrangeo.2015.04.008 URL [本文引用: 1] 摘要
Central Business District (CBD) is the core area of urban planning and decision management. The cartographic definition and representation of CBD is of great significance in studying the urban development and its functions. In order to facilitate these processes, the Kernel Density Estimation (KDE) is a very efficient tool as it considers the decay impact of services and allows the enrichment of the information from a very simple input scatter plot to a smooth output density surface. However, most existing methods of density analysis consider geographic events in a homogeneous and isotropic space under Euclidean space representation. Considering the case that the physical movement in the urban environment is usually constrained by a street network, we propose a different method for the delimitation of CBD with network configurations. First, starting from the locations of central activities, a concentration index is presented to visualize the functional urban environment by means of a density surface, which is refined with network distances rather than Euclidean ones. Then considering the specialties of network distance computation problem, an efficient way supported by flow extension simulation is proposed. Taking Shenzhen and Guangzhou, two quite developed cities in China as two case studies, we demonstrate the easy implementation and practicability of our method in delineating CBD.
|
| [34] |
Identification and differentiation of urban centers in phoenix through a multi-criteria kernel-density approach. https://doi.org/10.1177/0160017610365538 URL 摘要
Research concerning geographical centers of economic activity has sought to explain patterns of development and interaction in cities. This article presents a new method of defining intraurban centers within a spatial economic framework as a combination of both employment and establishment kernel-smoothed patterns. The method is applied in Phoenix, a postmodern metropolis that has grown by more than a factor of thirty between 1950 and 2005 and is one of the largest and fastest growing metropolitan areas in the United States. Centers are found to vary considerably in their sectoral composition and are grouped based on their focus of secondary, retail, or high-order emphasis. A conditional logit model is used to show how each center differentiates with regard to establishment size and sector as well as the importance of center characteristics.
|
| [35] |
Duarte C R M, Moix M. Urban structure and polycentrism: Towards a redefinition of the Sub-centre concept. |
| [36] |
The identification of sub-centres in two Italian metropolitan areas: A functional approach. https://doi.org/10.1016/j.cities.2012.04.006 URL 摘要
This work introduces a method aimed at identifying metropolitan sub-centres based on an interaction approach, using commuting flows. In addition, it compares the results with other approaches based on employment and/or density thresholds commonly used in the literature. Although the scientific literature and the policy debate on polycentricity are increasingly devoted to its functional dimension, empirical research aimed at identifying metropolitan sub-centres mainly relies on employment density, which refers to a more morphological approach. After discussing the concept of centre and the contemporary literature on its empirical identification, the proposed methodology is applied to the metropolitan areas of Rome and Milan. Such a method shows a better fit compared to other approaches based on job density. Results are found to be remarkably sensitive to the method applied and are dependent, to some extent, on the different concept of centre that is adopted in the characterisation of metropolitan spatial structures.
|
| [37] |
Identifying the city center using human travel flows generated from location-based social networking data. https://doi.org/10.1177/0265813515617642 URL 摘要
Since cities have become more complex and some large cities are likely to be polycentric, a better understanding of cities requires a clear topology that reveals how city centers are spatially distributed and interacted with. The identification of a city center that aims to find the accurate location of the city center or delineate the city center with a precise boundary becomes vital. This work attempts to achieve this by using a new type of movement data generated from location-based social networks, whereby three different methods are deployed for clustering and compared regarding identification of city centers and delineation of their boundaries. Experiments show that city centers with precise boundaries can be identified by using the proposed approach with location-based social network data. Furthermore, the results show that the three methods for clustering have different advantages and disadvantages during the process of city center identification, and thus seem to be suitable for cities with different urban structures.
|
| [38] |
Does employment density death? Towards a new integrated methodology to identify and characterize sub-centres//52nd Congress of the European Regional Science Association: "Regions in Motion - Breaking the Path", August 21-25, 2012. Bratislava, |
| [39] |
The relationship between different types of traffic route and functional urban land use in Changchun. https://doi.org/10.11821/dlyj201609008 URL Magsci [本文引用: 1] 摘要
利用长春市中心城区2003年、2013年土地利用现状图,运用廊道效应原理与ArcGIS空间分析功能,揭示了交通系统“快速化”背景下长春市各级交通路线对城市功能用地演替的作用效应关系.研究发现:轻轨、主干路、快速路对商服用地的吸聚效应依次增强,快速路沿线商服用地主要用于专业化市场建设,轻轨沿线商服用地用作综合性商场开发;快速路对沿线居住用地吸聚强度大于主干路,轻轨对沿线居住用地具有近距离排斥效应;在市中心区,快速路、主干路、轻轨对工业用地的排斥强度依次增强,但随着由中心至外围的过渡,快速路的排斥效应将转化为吸聚效应.各级交通路线对沿线城市功能用地作用效应的差异性,一定程度上推动了长春市城市地域结构的演变.
长春市各级交通路线对城市功能用地变化的作用效应关系研究 .https://doi.org/10.11821/dlyj201609008 URL Magsci [本文引用: 1] 摘要
利用长春市中心城区2003年、2013年土地利用现状图,运用廊道效应原理与ArcGIS空间分析功能,揭示了交通系统“快速化”背景下长春市各级交通路线对城市功能用地演替的作用效应关系.研究发现:轻轨、主干路、快速路对商服用地的吸聚效应依次增强,快速路沿线商服用地主要用于专业化市场建设,轻轨沿线商服用地用作综合性商场开发;快速路对沿线居住用地吸聚强度大于主干路,轻轨对沿线居住用地具有近距离排斥效应;在市中心区,快速路、主干路、轻轨对工业用地的排斥强度依次增强,但随着由中心至外围的过渡,快速路的排斥效应将转化为吸聚效应.各级交通路线对沿线城市功能用地作用效应的差异性,一定程度上推动了长春市城市地域结构的演变.
|

/
| 〈 |
|
〉 |

