匡文慧 , 杨天荣
, 杨天荣
KUANG Wenhui, YANG Tianrong
收稿日期: 2017-04-25
修回日期: 2017-05-22
网络出版日期: 2017-06-25
版权声明: 2017 《地理学报》编辑部 本文是开放获取期刊文献,在以下情况下可以自由使用:学术研究、学术交流、科研教学等,但不允许用于商业目的.
基金资助:
作者简介:
作者简介:匡文慧(1978-), 男, 内蒙古乌兰察布人, 博士, 副研究员, 中国地理学会会员(S110010055M), 主要从事土地利用/覆被变化、城市生态学研究。E-mail: kuangwh@igsnrr.ac.cn
展开
摘要
河北雄安新区建设对于实施京津冀协同发展战略及有机疏解北京非首都功能、优化区域空间格局,提升京津冀城市群生态系统服务和改善人居环境具有重要意义。本文基于多期遥感图像、土地利用/覆盖变化数据、生态系统服务评估数据以及高精度城市地表信息等专题数据集,从雄安新区建设涉及的京津冀城市群区域背景和规划区覆盖范围两个层面揭示了新区建设的区域地表本底状态,并提出了相应的生态保护与管控建议。结论表明:京津冀城市群正呈现建设用地快速扩张以及由此导致的下垫面不透水地表高密度连绵集聚式态势,城镇用地和城市不透水地表较2000年分别增长了1.27倍和1.43倍,且接近15%的子流域水生态系统健康状况受到不透水地表的严重影响。雄安新区建设涉及的雄县、容城、安新三县以农田、乡镇及农村聚落和水域及湿地生态系统为主,其开发建设应围绕实现疏解北京非首都功能为目标,适度控制人口、产业规模,建设宜居生态健康城市。规划初期,应将其纳入国家海绵城市建设试点范畴,参照国际低影响度开发模式,加强城市绿色基础设施建设。基于当前下垫面特征,前期规划应考虑构建新区与保定、北京和天津城市之间的绿化生态斑块和生态廊道;新区内建设用地不透水地表整体比例应控制在60%之内,核心区不超过70%。新区建设过程中需确立“以水定城”理念,在新区基础设施建设、供排水方面充分考虑雨水收集和循环利用。
关键词:
Abstract
Development of Xiong'an New District (XND) is integral to the implementation of the Beijing-Tianjin-Hebei (BTH) Integration Initiative. It is intended to ease the non-capital functions of Beijing, optimize regional spatial patterns, and enhance ecosystem services and living environment in this urban agglomeration. Applying multi-stage remote sensing (RS) images, land use/cover change (LULC) data, ecosystem services assessment data, and high-precision urban land-cover information, we reveal the regional land-cover characteristics of this new district as well as across the planned area of the entire BTH urban agglomeration. Corresponding ecological protection and management strategies are also proposed. Results indicated that built-up areas were rapidly expanding, leading to a continuous impervious surface at high density. Urban and impervious surface areas (ISAs) grew at rates 1.27 and 1.43 times higher than that in 2000, respectively, seriously affecting about 15% area of the sub-basins. Construction of XND mainly encompasses Xiongxian, Rongcheng, and Anxin counties, areas which predominantly comprise farmland, townships and rural settlements, water, and wetland ecosystems. The development and construction of XND should ease the non-capital functions of Beijing, as well as moderately control population and industrial growth. Thus, this development should be included within the national 'sponge city' construction pilot area in early planning stages, and reference should be made to international low-impact development modes in order to strengthen urban green infrastructural construction. Early stage planning based on the existing characteristics of the underlying surface should consider the construction of green ecological patches and ecological corridors between XND and the cities of Baoding, Beijing, and Tianjin. The proportion of impervious surfaces should not exceed 60%, while that of the core area should not exceed 70%. The development of XND needs to initiate the concept of 'planning a city according to water resource amount' and incorporate rainwater collection and recycling.
Keywords:
全球气候变暖和快速城市化正严重地影响着城市人居环境、生态系统服务乃至人类幸福安康(Human Well-being)。纵观国际千年生态系统评估(MA)、城市化与全球环境变化(UGEC)、“未来地球(Future Earth)”等重大研究计划以及“全球变化与城市生态”等国际重大学术成果,城市生态系统服务的提升和人类福祉的改善已成为全球学者关注的焦点问题[1-3]。
伴随全球快速的城市化进程,中国城市正以史无前例的速度加速扩张,特别是21世纪最初10年城市扩张速率是20世纪90年代的2.16倍[4-5]。城市化导致的自然、半自然生态系统向人工生态系统转变,会严重地影响生态系统结构、过程(包括水、热等过程)及服务功能(包括支持、供给、调节和文化服务),从而导致城市热岛和极端热事件加剧[6-8]、雨洪灾害频发[9]、大气环境污染加剧[10]等问题。为提高环境适应性,以抵御自然灾害风险、实现生态的可持续发展,将基于生态系统的适应性方法(Ecosystem-based approaches to Adaptation, EbA)[11]和“弹性(Resilience)”概念[12]应用于生态学领域,特别是以Holling等[13]提出的“扰沌(Panarchy)和多尺度嵌套适应性循环模型”作为研究城市生态弹性的代表性模型,可为科学解答城市生态系统演化动力机制提供全新的理念和解决方法[14]。
进入21世纪,“城市群”成为中国“新型城镇化”的主体区和经济发展的核心区,其健康持续协调发展对于中国乃至世界社会经济的可持续发展具有重要意义[15-18]。自2015年4月中共中央政治局会议审议通过《京津冀协同发展战略》以来,作为中国第三大城市群的京津冀城市群,其协同发展已上升到国家战略层面。如何高效、准确提取城市群地区及其内部不同尺度地表覆盖信息并实现实时动态监测,以满足城市群整体规划和管理,实现城市群内部城市间的协同发展等应用需求意义重大[19-20]。借助遥感手段,及时、准确地实现城市地表本底特征的动态监测已成为城镇化与其生态环境效应研究的热点内容之一,对于科学规划城镇、合理布局产业结构、完善城镇体系发展战略布局等均具有较强的指导意义[21-24]。
2017年4月1日,中共中央、国务院决定设立河北雄安新区,拟定先行开发起步区面积约100 km2,中期发展区面积约200 km2,远期控制区面积约2000 km2,这也是继深圳经济特区和上海浦东新区之后又一具有全国意义的新区,是千年大计、国家大事。雄安新区建设是以习近平同志为核心的党中央作出的一项重大的历史性战略选择,对于京津冀协同发展和疏解北京非首都功能具有重要的战略意义。在这一国家重大战略提出的关键时刻,加强对新区建设的区域地表本底特征的认识,预估将来建设过程人口、建成区规模,提出土地利用、城市热岛等管控措施,揭示未来可能带来的生态和环境潜在风险,是当前规划和建设非常迫切的任务。本文基于长期积累的系列遥感图像、土地利用/覆盖变化数据、生态系统服务评估以及城镇用地高精度信息等专题数据集,对河北雄安新区生态系统状况进行全面系统分析,并提出针对性的生态管控策略,研究组于2017年4月8日向中共中央提交了“中科院专家关于加强河北雄安新区建设区域生态管控的建议”。在此基础上,从雄安新区建设涉及的京津冀城市群区域背景和规划区覆盖范围两个层面进行递进式论述,详细地对京津冀城市群21世纪以来城市扩张过程及不透水地表时空过程进行分析,刻画城市群地表人工建设用地分布特征,进而对雄安新城建设预期带来的生态风险进行科学预估,本文可为京津冀协同发展和雄安新区建设提供重要的科学参考。
京津冀城市群作为中国继长江三角洲、珠江三角洲的第三大城市群,是国家的政治、文化、国际交流和科技创新中心;土地总面积21.63万km2,包括北京、天津和河北省全域,常住人口1.11亿人,GDP总量达到66474.5亿元。改革开放以来,该区经济及社会高速发展,城镇体系发展失衡,与此同时也给区域生态环境造成了极大影响。2015年4月底,中共中央、国务院通过了《京津冀协同发展战略》,将推动京津冀协同发展定为国家重大战略。2017年4月1日中共中央、国务院提出建设“河北雄安新区”的决定,以疏解北京市非首都核心功能,调整优化城市空间结构为主,促进区域生态环境与社会经济的协调发展。
雄安新区规划范围涉及河北省保定市雄县、容城、安新三县(以下简称雄安三县)及周边部分区域,与京津形成等边三角形格局,距离分别约为110 km。雄安三县行政总面积为1557 km2,地形地貌以低海拔平原、洼地为主;海拔高程范围0~44 m,且平均海拔高程为4 m,其中近70%的土地处于海拔高程0~5 m范围,近25%的面积处于海拔高程5~10 m范围。2015年初,雄安三县户籍总人口113.02万人,其中农业人口72.20万人,占总人口的64%;非农人口总数共40.82万人,占总人口的36%;三县GDP总量为211.06亿元,其中第一产业、第二产业和第三产业增加值分别为28.69亿元、133.75亿元和48.62亿元(表1)。
表1 雄安三县行政区面积与2015年初人口经济规模
Tab. 1 Total area of administration area, population and economy gross of Xiong'an New District in 2015
| 县名称 | 行政区划 面积(km2) | 人口状况(万人) | 经济状况(亿元) | ||||||
|---|---|---|---|---|---|---|---|---|---|
| 户籍 总人口 | 农业 人口 | 非农业 人口 | 地区生产 总值 | 第一产业 增加值 | 第二产业 增加值 | 第三产业 增加值 | |||
| 容城县 | 314 | 27.31 | 13.73 | 13.58 | 57.75 | 9.71 | 34.15 | 13.89 | |
| 安新县 | 729 | 46.30 | 32.35 | 13.95 | 62.56 | 8.85 | 36.04 | 17.67 | |
| 雄县 | 514 | 39.41 | 26.12 | 13.29 | 90.75 | 10.13 | 63.56 | 17.06 | |
| 总计 | 1557 | 113.02 | 72.20 | 40.82 | 211.06 | 28.69 | 133.75 | 48.62 | |
本文主要的数据源包括中国土地利用/覆盖变化数据、生态系统宏观结构数据、数字化地形地貌数据、土壤侵蚀遥感调查数据和植被净初级生产力数据等;并下载获取了美国国家航空航天局(NASA)发布的植被指数数据产品(https://ladsweb.modaps.eosdis.nasa.gov/archive/allData/6/MOD13Q1/)和美国国家海洋和大气管理局(NOAA)发布的夜间灯光数据产品(https://ngdc.noaa.gov/eog/download.html),及来自Google Earth的高分辨率遥感影像。此外,还包括美国地质调查局(USGS)地球资源观测与科学中心(EROS)的子流域边界数据(http://eros.usgs.gov/Find_Data/Products_and_Data_Available/gtopo30/hydro/asia),国家基础地理信息中心(http://ngcc.sbsm.gov.cn/)的行政区划数据,以及其他社会经济、部门统计资料等。
本文所用城镇建设用地信息和生态系统结构信息由2000年、2005年、2010年和2015年中国土地利用/覆盖现状数据集(National Land Use Datasets of China, NLUD-China)提取而来。中国土地利用/覆盖现状数据集是采用每隔5年的Landsat TM/OLI、HJ-1A、ZY-3等卫星影像,按照统一的规范标准人工数字化解译获取,共包括耕地、林地、草地、水域、城乡建设用地及未利用地等6个一级类和25个二级类,且各期数据分类平均精度均在90%以上,满足1∶10万比例尺制图精度要求[5, 25-26]。
2000-2015年间每5年间隔的城市不透水地表分布信息,以城镇建设用地为空间掩码,以植被指数和夜间灯光遥感影像为数据源,采用Lu等[27]提出的人居地不透水地表指数和匡文慧等[28]针对该指数构建的回归校正参数,通过建立区域尺度不透水地表回归模型来实现。并选用2015年不透水地表提取信息为验证对象,采用Google Earth高分影像在随机采样点中的不透水地表解译结果,应用相关系数和均方根误差进行精度评价[29-30]。结果表明,回归模型提取的2015年不透水地表评估信息与高分影像解译的不透水地表信息间相关系数达0.78,均方根误差为0.17,满足区域尺度分析的需求。
本文主要应用植被覆盖状况、农田生产力及土壤侵蚀方面的生态遥感参数。其中,植被覆盖状况采用MODIS卫星获取的250 m MOD13Q1归一化植被指数(Normalized Difference Vegetation Index, NDVI)来表示,对各月份预处理后的数据求取NDVI最大值。农田生产力数据由MODIS遥感数据以及气象数据,采用光能利用率模型VPM模拟而来[31-33]。土壤侵蚀数据依据Landsat系列卫星及其他相关辅助数据,包括数字高程、土壤类型、植被覆盖度等,经过综合分析后采用全数字作业的人机交互判读分析方法获得[34]。
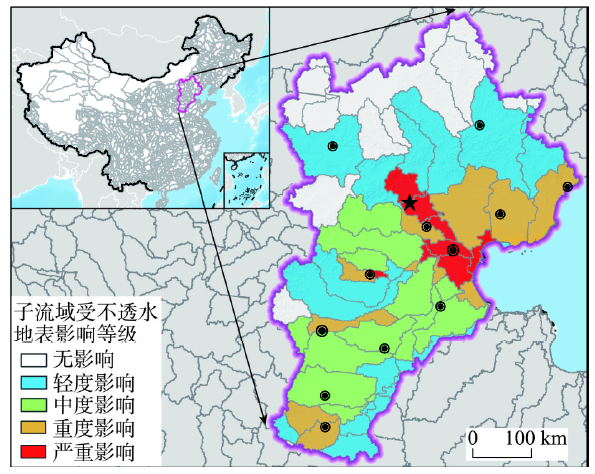
此外,流域内不透水地表面积比例与生态系统潜在健康状况存在显著的相关性,不透水地表面积增加可对河流水生态系统造成严重影响[35-40],本文将其作为城市化对水生态系统影响的评价指标。Bierwagen等[41]研究发现当流域内不透水地表面积比例<1%时,其对流域水生态系统无影响;当流域内不透水地表面积比例为1%~5%,会造成轻微影响;当不透水地表面积比例为5%~10%,造成中度影响;当不透水地表面积比例为10%~25%,造成重度影响;当流域不透水地表面积比例>25%,将产生严重影响。本文采用子流域不透水地表指数模型公式来计算子流域内不透水地表面积比例,并采用上述阈值等级对流域水生态系统的潜在影响进行评估,具体公式详见匡文慧等[28-30]相关研究。
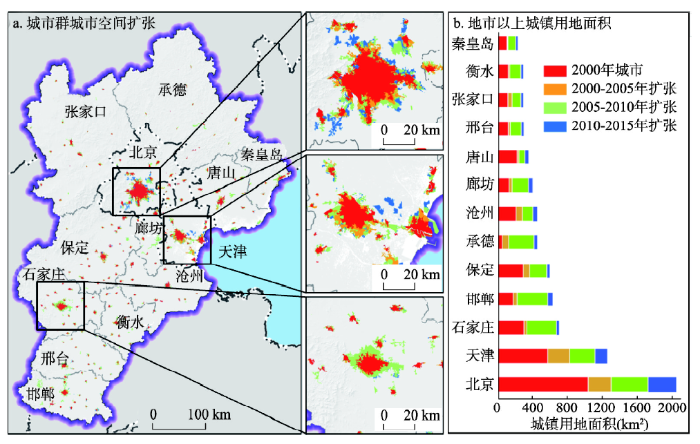
3.1.1 城镇用地扩张时空动态特征 基于2000-2015年间京津冀城市群土地利用/覆盖遥感解译现状数据,提取历年城镇用地现状,结合全区各直辖市、地级市行政区划,获得其阶段性动态变化(图1)。由图1a可知,京津冀城市群在21世纪初15年间城镇扩张时空分异显著,以北京、天津两市为主各城市建成区均急剧扩张,在空间上呈现典型的蔓延式扩张模式。统计表明,进入21世纪以来,全区城镇用地面积自2000年共增加了4500.44 km2,约为2000年总面积的1.27倍,年均增加速度为300.03 km2/a。
图1 2000-2015年京津冀城市群城市扩张动态变化
Fig. 1 Dynamic change of built-up area expansion in Beijing-Tianjin-Hebei urban agglomeration from 2000 to 2015
不同城市在不同阶段扩张面积存在较大差异,以北京、天津、石家庄、唐山、邯郸和廊坊6个城市为主,城市用地扩张面积共占了整个区域的71.76%。其中,北京、天津两直辖市是该区城市扩张面积增加最多的城市;北京市共增加1004.78 km2,年均扩张速率为66.99 km2/a;天津以年均扩张45.53 km2/a的速率共扩张了682.95 km2。此外,河北省邯郸市、石家庄市、唐山市和廊坊市城市用地增长面积也较大,增长面积均在300 km2以上(图1b)。
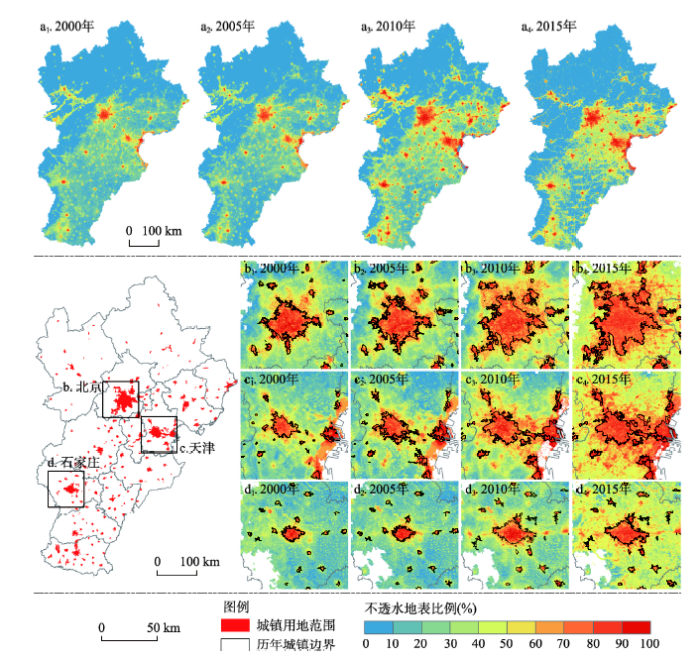
3.1.2 城市不透水地表时空动态特征 21世纪以来,京津冀城市群不透水地表增长随城镇用地的扩张,呈现连绵集聚式增长态势(图2a)。统计表明,15年间全区城市不透水地表共增长了3491.73 km2,是2000年不透水地表总面积的1.43倍,年均扩张速率为232.78 km2/a。其中,北京、天津仍是不透水地表增长贡献最多的两个城市,其总面积分别增长了691.38 km2和581.45 km2,合占全区增长总面积的36.45%;唐山、邯郸、石家庄紧随其后,不透水地表总面积增长超过了300 km2,且三者增长共占全区总面积的27.83%;此外,廊坊、保定、邢台增长也较多;承德最少,仅增长了91.01 km2。到2015年,全区以北京市不透水地表面积最大,接近1500 km2;天津市次之,其面积超过1000 km2;石家庄、唐山、邯郸及保定也接近500 km2。
图2 京津冀城市群及典型城市不透水地表分布
Fig. 2 Distribution of impervious surface area in Beijing-Tianjin-Hebei urban agglomeration and its cities
与城镇用地扩张趋势一致,各城市不透水地表亦呈现阶段性缓慢增长后突然增速、再降速的过程。其中,2000-2005年间,全区不透水地表增长了652.60 km2,且仍以北京、天津为主不透水地表大量增加,而其他城市面积增长较缓;到了2005-2010年,所有城市不透水地表均大幅度增速,该阶段不透水地表扩张速率是前一阶段的3.05倍;而到了2010-2015年间,该速率又突然降低,仅为第二个阶段的42.66%。
京津冀城市群三大城市(北京、天津和石家庄)城镇用地范围在15年间均有较大扩张,且其内部不透水地表也随城市扩张而逐渐向外蔓延,城市内部不透水地表面积比例多高于60%(图2b~2d)。而该区城市建成区以外区域也均以中等、较高密度不透水地表增长为主,辐射周边城乡交错带及近郊区等区域,造成城市及其周边不透水地表的连绵式布局与扩展。
基于全区92个子流域边界,统计2015年各子流域内不透水地表面积比例并进行水环境生态健康影响等级评价,可知全区超过60%的子流域受到不透水地表不同程度的影响,分布在该区东南大部分区域,其总面积比例达78.15%,且以受中、低度影响子流域面积比例最高,占全区的57%以上(图3,表2)。此外,受严重、重度影响的子流域面积约占全区的21.12%,特别是以北京到天津沿线各子流域受不透水地表影响最为严重;而其周边环渤海湾地区连同保定、石家庄及邯郸等地区部分子流域,主要受重度影响;中度影响子流域多分布在受严重影响子流域西南部地区,且分布较为连续;而低度影响子流域则包括北部、中部、南部三部分。
图3 子流域受不透水地表影响等级分布
Fig. 3 Rank distribution of impacts on sub-drainage basins by impervious surface area
表2 子流域受不透水地表影响等级状况统计
Tab. 2 Statistics of impacts on sub-drainage basins by impervious surface area
| 影响等级 | 子流域内不透水地表面积比例(%) | 子流域状况 | |||
|---|---|---|---|---|---|
| 数量(个) | 数量比例(%) | 面积(km2) | 面积比例(%) | ||
| 无影响 | 0.0~1.0 | 36 | 39.13 | 47049.57 | 21.85 |
| 轻度影响 | 1.0~5.0 | 16 | 17.39 | 71577.27 | 33.25 |
| 中度影响 | 5.0~10.0 | 14 | 15.22 | 51203.34 | 23.78 |
| 重度影响 | 10.0~25.0 | 12 | 13.04 | 34548.59 | 16.05 |
| 严重影响 | 25.0~100.0 | 14 | 15.22 | 10920.65 | 5.07 |
| 总计 | 92 | 100.00 | 215299.4 | 100.00 | |
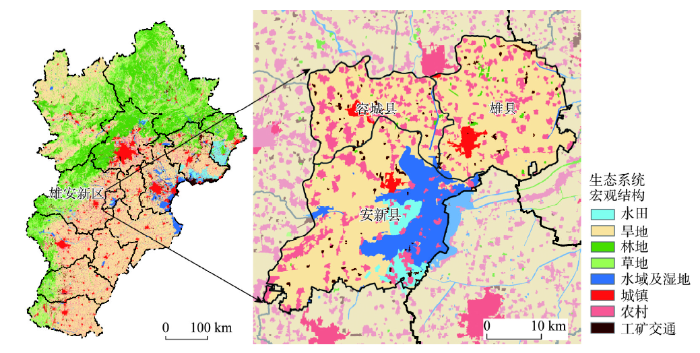
3.2.1 雄安新区涉及三县生态系统宏观结构特征 通过2000-2015年,每隔5年的生态宏观结构变化遥感监测发现,2015年末,雄安三县的农田、乡镇及农村聚落和水域面积相对较大(图4)。其中,农田生态系统面积最大,共1067.79 km2,占区域总面积的69%,且以旱地为主,仅在雄县有51.56 km2水田分布;其次为城镇和乡村聚落生态系统,面积共303.39 km2,占全区的19.49%,特别是乡镇及农村聚落类型占其面积的80%以上;再次为水域与湿地生态系统,面积共175.08 km2,占全区的11%,且以白洋淀淡水湖泊为主(表3)。
图4 2015年京津冀及雄安新区生态系统宏观结构现状
Fig. 4 Ecosystem structure in Beijing-Tianjin-Hebei urban agglomeration and the Xiong'an New District in 2015
表3 2015年雄安三县生态系统类型面积统计表(km2)
Tab. 3 The area of ecosystem classification of the Xiong'an New District in 2015 (km2)
| 县名称 | 农田 | 林地 | 水域及 湿地 | 城镇和乡村聚落 | |||
|---|---|---|---|---|---|---|---|
| 水田 | 旱地 | 城镇建成区 | 乡镇及农村聚落 | 独立工矿 | |||
| 容城县 | 0.00 | 224.72 | 1.59 | 5.70 | 9.22 | 67.29 | 5.22 |
| 雄县 | 51.56 | 391.61 | 1.02 | 163.90 | 7.56 | 99.79 | 10.55 |
| 安新县 | 0.00 | 399.90 | 6.51 | 5.48 | 17.58 | 79.74 | 6.42 |
| 总计 | 51.56 | 1016.23 | 9.12 | 175.08 | 34.37 | 246.82 | 22.20 |
经2000年以来每隔5年的生态宏观结构变化遥感监测与分析,雄安三县近15年来城镇和乡村聚落扩张显著,总计扩张面积达113.89 km2,其中城镇建成区、乡镇和农村聚落和独立工矿用地面积分别扩张了15.11 km2、82.99 km2和15.79 km2。与此同时,雄安三县耕地面积、水域及湿地面积相应的分别减少了65.90 km2和96.80 km2。
由2015年雄安三县非农业人口比例(36%)和城镇建成区面积(34.37 km2)状况可知,雄安三县城镇化水平较低;而根据雄安新区规划涉及三县城镇与乡村建设用地不透水地表遥感监测发现,2015年该区不透水地表总面积为110.45 km2,占雄安三县城镇和乡村聚落用地面积的36%。其中,三县县城所在地建成区内不透水地表的面积为23.98 km2,平均不透水地表面积比例为70%;而由于城市建设用地范围较小,无明显的城市热岛现象。
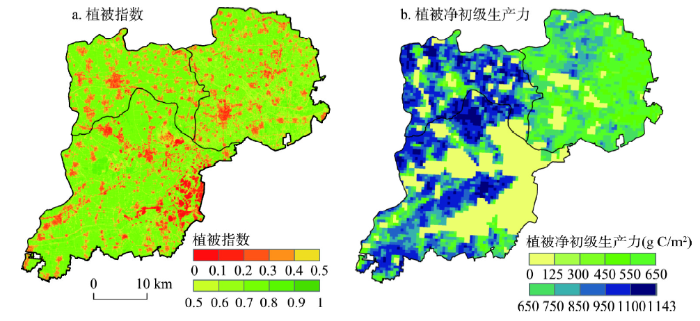
3.2.2 雄安新区涉及三县生态系统服务现状 基于2000-2015年遥感数据产品、模型模拟结果等,对雄安三县生态系统植被覆盖状况、农田生产能力、土壤侵蚀等生态系统因子进行评估。结果表明:雄安三县生态系统植被覆盖状况、农田生产能力及土壤保持等生态系统服务良好。其中,由于各项人为活动对植被的干扰程度增加,导致雄安三县15年间的植被覆盖状况稍有退化,到2015年植被指数基本稳定在0.79(图5a);该区农田生态斑块以高产田为主,约占全区农田总面积的76.4%,农田生态系统较为优质(图5b)。由于植被覆盖状况较好、农田生态系统较为优越,因此有效遏制了该区土壤侵蚀的发生,其土壤侵蚀状况中以微度水蚀和风蚀为主,属于中国土壤侵蚀微弱的区域。
图5 雄安新区涉及三县生态系统植被指数和净初级生产力现状
Fig. 5 The NDVI and NPP of Xiong'an New District in 2015
3.2.3 雄安新区建设未来生态潜在影响分析与预估 基于对雄安新区未来不同开发阶段生态环境潜在影响的综合分析与评价结果,雄安新区建设开发具有优良的生态环境和较强的资源环境承载力。但从地形地势来看,该区属于平原低洼地带(雄安三县平均高程为4 m,70%的面积处于0~5 m);而从生态系统类型来看,除白洋淀淡水湖泊外,该区周边近80 km范围内均以耕地为主,故从城市足迹更大范围的生态源地考虑,其周边缺乏森林等大型生态斑块或生态源地的保障。故对雄安新区未来建设规划需要围绕实现疏解北京非首都功能人口和产业目标,适度控制人口、产业规模,建设人口在500万以内的生态健康城市,不宜发展特大或超大城市。针对上述因素,提出雄安新区建设中对生态环境的潜在影响及其控制策略(表4)。
表4 雄安新区建设生态环境潜在影响与控制策略
Tab. 4 The eco-environment potential impact and protection strategy for Xiong'an New District construction
| 新区建设预期影响与 调控指标 | 近期新区建设 | 中期新区建设 | 远期新区建设 | |
|---|---|---|---|---|
| 预期到2020年 | 预期到2025年 | 预期到2030年 | 预期到2050年 | |
| 城市建成区人口规模 | 50~100万人 | 100~200万人 | 200~500万人 | 500万人以上 |
| 城市建成区用地规模 | 60~120 km2 | 120~240 km2 | 240~600 km2 | 600 km2以上 |
| 城市土地利用与产业调控模式 | 以疏解北京非首都功能承载人口和产业为主,除此以外需适度控制 | 加强边缘区生态隔离带建设,严控连绵集聚蔓延式增长 | ||
| 地面硬化不透水地表控制 | 建成区硬化不透水地表占比控制在60% 以内 | 建成区硬化不透水地表面积占比控制在50%~60%,城市绿化率高于40% | ||
| 土地利用 | 以占用耕地和乡镇农村居民点为主,构建城区与白洋淀湖泊生态保护隔离带 | 加强与保定、北京和天津城市之间绿化生态斑块和生态廊道管控、防止沿交通轴线连续成片发展 | ||
| 城市热岛 | 城市热岛空间范围扩展,但通过城市生态结构管控,热岛强度应控制在1℃ | 城市热岛空间范围继续扩展,通过科学规划,热岛强度应控制在1~1.5℃ | ||
| 生态潜在影响与控制策略 | 地势低洼,易受暴雨洪水的影响;建筑、人口、产业等集聚会降低生态系统水源涵养等服务功能 | 城市硬化不透水地表连绵式扩展,加之地势较低,会增加洪水等灾害的风险性。必须考虑生态斑块和廊道镶嵌式的生态城市规划设计 | ||
| 环境潜在影响与控制策略 | 地势低洼平坦,高楼等建筑会影响局地大气扩散能力,会加剧灰霾等污染,除点源污染外,城市不透水地表会造成城市面源污染,影响白洋淀淡水水质。必须严格制定产业准入制度,高标准处理“三废” | 所在子流域不透水地表面积比例超过15%~25%比例,严重影响流域生态系统健康状况,甚至对白洋淀水质产生严重影响。必须制定城市绿色发展路线图,指导“一张蓝图绘到底”的生态城市建设 | ||
其中,在雄安新区规划初期,应将其纳入国家海绵城市建设试点范畴,实施国际上的低影响度开发模式,加强城市绿色基础设施建设;各类规划从区域整体考虑,构建新区与保定、北京和天津城市之间的绿化生态斑块和生态廊道,防止城市边缘区和交通沿线不透水下垫面集聚连绵式发展;建议新区开发除考虑绿化率指标外,建成区内不透水地表面积整体比例应不超过60%,核心区不超过70%。
而根据国际惯例,城市所在子流域不透水地表大于25%会对地表水环境和生态系统健康带来严重影响,甚至毁坏整个生态系统。新区开发预期会导致约数百平方公里的地面硬化,引发不透水地表(包括建筑、道路、广场等)面积增加,加之不利的地形地势条件,会导致地表雨洪发生频率增加,引发暴雨洪水灾害;同时,面临高强度城市热岛,以及大气扩散能力减弱等问题。此外,通过对比中国和美国典型城市不透水地表下垫面,发现当城市内特定区域不透水地表面积超过70%,城市热岛会呈现指数上升;城市所在子流域内不透水地表面积比例超过25%,受城市面源污染等影响,河流污染物氮氨、COD等指标会显著升高[28]。因此,必须防止大规模连片城市建设导致的城市热环境损害,以及对白洋淀淡水湖泊水质的不利影响。对于雄安新区的城市内部而言,必须在规划设计中充分考虑防控低洼地带带来的暴雨洪灾,盛行风向风场强度弱带来的大气扩散差,以及城市热岛加剧等问题。
最后,尽管雄安新区拥有华北平原最大的淡水湖——白洋淀水资源保障,但是从水资源状况方面统筹考虑,新区地处海河流域的大清河子流域,雄安三县水资源总量为24620.74万m3,人均为217 m3/人;同时,依据水利部门资料,安新县、雄县和容城县的地下水资源分别为轻度、中度超采和严重超采。因此,雄安三县支撑新区开发的地表水资源和地下水资源相对欠缺。故雄安新区的开发需确定“以水定城”的规划理念,充分考虑水资源承载力状况,并尽可能采取“海绵城市”建设思路及国际上推行的“低影响度开发”模式,在新区基础设施建设、供排水方面充分考虑雨水收集和循环利用,提高新区水资源、水生态和水环境的综合利用与保护水平。
基于当前京津冀城市群协同发展战略,综合分析其自然和社会经济发展状况,提出建设雄安新区以有机疏解北京非首都功能,对于促进该区社会经济可持续发展、提升城市生态系统服务功能十分必要。依据Holling等[13]提出的“多尺度嵌套适应循环”和“弹性”理论,城市生态系统动态演化过程,应该包括4个不同阶段:发展或开发阶段(Growth or Exploitation)、存储或积累阶段(Conservation or Accumulation)、崩溃和释放阶段(Collapse and Release)以及再组织和更新阶段(Reorganization and Renewal)。由上述理论,北京、天津以及石家庄、保定等城市均处于上述发展的不同阶段,当前雄安新区建设也是城市群发展到特定阶段的必然选择。Carpenter等[40]指出一个具有弹性的系统应至少包括3方面的属性特征,即系统能够吸收外界干扰并仍保持相同状态的能力,系统的自组织能力以及系统学习和提高适应能力的程度。雄安新区作为国家“千年大计”的目标,通过国家政策的干预,对城市生态系统实现再组织和更新发展,提高生态系统的自组织和适应性能力具有重要意义。
21世纪以来,京津冀城市群城镇建设用地与城市不透水地表呈现高速扩张的趋势,城镇用地面积自2000年共增加了4500.44 km2,城市不透水地表增长了3491.73 km2,评估约占15%的子流域,其内部不透水地表面积比例大于25%,对于流域水生态系统健康状况产生严重影响。京津冀城市群整体下垫面问题,特别是不透水地表高密度连绵集聚式分布特征是导致城市群生态环境问题严峻的核心因素,这一问题应该得到足够重视和高度关注。雄安新区建设选址近临白洋淀淡水湖,尽管具有一定的资源环境优势,但从地形地貌特征、生态系统类型状况及城市雨洪调节、热岛调节、净化空气等功能方面综合考虑,其开发建设需加强生态管控与保护措施。
基于高分辨率遥感和生态模型获得地理生态专题信息[42],从京津冀城市群区域背景和规划区覆盖范围两个尺度,充分认识河北雄安新区建设的区域生态系统过程、格局以及服务现状,预估未来城市发展可能带来的生态和环境潜在风险,提出预期不同发展阶段生态保护和管控策略,对于雄安新区前期规划与建设具有重要的应用价值。
The authors have declared that no competing interests exist.
| [1] |
Global change and the ecology of cities .https://doi.org/10.1126/science.1150195 URL PMID: 18258902 [本文引用: 1] 摘要
Urban areas are hot spots that drive environmental change at multiple scales. Material demands of production and human consumption alter land use and cover, biodiversity, and hydrosystems locally to regionally, and urban waste discharge affects local to global biogeochemical cycles and climate. For urbanites, however, global environmental changes are swamped by dramatic changes in the local environment. Urban ecology integrates natural and social sciences to study these radically altered local environments and their regional and global effects. Cities themselves present both the problems and solutions to sustainability challenges of an increasingly urbanized world.
|
| [2] |
Ecological resilience and resilient cities .https://doi.org/10.1080/09613218.2014.850600 URL 摘要
The urban realm is changing rapidly and becoming increasingly interconnected across continents, and across contrasting types of land covers, while at the same time facing new environmental threats and experiencing new demographic and social pressures. The urban component of the global ecosystem can be made more sustainable by incorporating the ecological understanding of resilience into the discourse. Sustainability is seen as a social, normative goal, which can be promoted using the mechanisms of ecological resilience. Ecological resilience differs from engineering resilience. Ecological resilience emphasizes the capacity of a site to adjust to external shocks and changes in controlling interactions, while engineering resilience emphasizes its ability to return to a state that existed before perturbation. Ecological resilience is particularly appropriate to urban systems, given the extent and open-ended nature of the changes and challenges they face. Adaptive processes are explored as contributions to the achievement of a successful adaptive cycle in urban socio-ecological systems. Key tools for incorporating the ecological thinking about resilience into the social discourse include landscape or patch ecology, the novel idea of the metacity, an assessment of ecological and design models, and the use of designs as experiments.
|
| [3] |
Improvements in ecosystem services from investments in natural capital .https://doi.org/10.1126/science.aaf2295 URL PMID: 27313045 [本文引用: 1] 摘要
In response to ecosystem degradation from rapid economic development, China began investing heavily in protecting and restoring natural capital starting in 2000. We report on China's first national ecosystem assessment (2000-2010), designed to quantify and help manage change in ecosystem services, including food production, carbon sequestration, soil retention, sandstorm prevention, water retention, flood mitigation, and provision of habitat for biodiversity. Overall, ecosystem services improved from 2000 to 2010, apart from habitat provision. China's national conservation policies contributed significantly to the increases in those ecosystem services.
|
| [4] |
A comparative analysis of megacity expansions in China and the U.S.: Patterns, rates and driving forces .https://doi.org/10.1016/j.landurbplan.2014.08.015 URL [本文引用: 1] 摘要
Research on physical characteristics and land-cover dynamic changes of megacities over time provides valuable insights for effectively regulating urban planning and management. This study conducts a comparative analysis of 30-year urban expansion patterns and rates among three metropolises in China (Beijing, Shanghai, and Guangzhou) and another three in the USA (New York, Los Angeles, and Chicago) based on time-series impervious surface area (ISA) data extracted from multitemporal Landsat images using the linear spectral mixture analysis approach. This research indicates significantly different urbanization patterns and rates between the Chinese and American megacities. The ISA expansion area in Chinese megacities was five times higher than that in American megacities during the past three decades. The Chinese megacities expand outward from the urban core to the periphery in a concentric ring structure, whereas the American megacities increase ISA mainly within the inner cities with patch-filling patterns. The Chinese megacities are in the development stage where population and economic conditions significantly influence urban expansion patterns and rates, but the American megacities are in the developed stage where population and economic conditions are not important forces driving the ISA expansion. The ISA intensity in the American megacities decreases constantly and smoothly, but ISA intensity in Chinese megacities decays abruptly within certain distances, depending on different cities and years. The most obvious urban expansions were between 8 and 20km in Beijing in the 1980s, between 14 and 50km in Shanghai in the 2000s, and between 8 and 18km in Guangzhou in the 1990s.
|
| [5] |
The rapid and massive urban and industrial land expansions in China between 1990 and 2010: A CLUD-based analysis of their trajectories, patterns, and drivers .https://doi.org/10.1016/j.landurbplan.2015.10.001 URL [本文引用: 2] 摘要
The past two decades saw rapid and massive urbanization and industrialization in China. Despite much research has been reportedly done at local and regional scales, little has been reported on the trajectories, patterns, and drivers of these two intertwining processes at the national level. This is mainly due to the fact that until recently, high resolution spatial data of land use and land cover change were not available at national level. The research reported in this paper aimed to fill this knowledge gap. Employing the China Land Use/Cover Dataset (CLUD), a national land use/cover change database our research team developed over the past decade, we analyzed the two intertwining processes at a 5 year interval from 1990 to 2010 to identify their trajectories, spatiotemporal patterns, and driving forces. Among out key findings are that (1) the nation's urban and industrial land areas increased from 4.8502×0210 4 02km 2 in 1990 to 9.0802×0210 4 02km 2 in 2010; (2) compared to those in the 1990s, the expansion rates of urban land and industrial land in the 2000s were respectively 2.15 and 5.79 times higher; (3) the expansion rates varied significantly across regions, revealing a distinctive spatial pattern with coastal regions being the fastest and the northeastern the slowest; (4) national development strategies and regional land-use policies had prominent impacts on land expansions; while (5) socioeconomic factors along with local and regional land-use policies explained the regional variations.
|
| [6] |
Quantifying the heat flux regulation of metropolitan land use/land cover components by coupling remote sensing modeling with in situ measurement .https://doi.org/10.1002/2014JD022249 URL [本文引用: 1] 摘要
<span style='color:#333333;background-color:#F9F9F9;'>Quantifying the effects of urban land use/land cover with regard to surface radiation and heat flux regulation is important to ecological planning and heat stress mitigation. To retrieve the spatial pattern of heat fluxes in the Beijing metropolitan area, China, a remote sensing-based energy balance model was calibrated with synchronously measured energy fluxes including net radiation, latent heat flux (LE), and sensible heat flux (H<span style='color:#333333;background-color:#F9F9F9;'>). Our model calibration approach avoided the uncertainties due to subjective judgments in previous empirical parameterization methods. The land surface temperature (LST),<span class='Apple-converted-space'> H<span style='color:#333333;background-color:#F9F9F9;'>, and Bowen ratio ( <span style='color:#333333;background-color:#F9F9F9;'>) of Beijing were found to increase along the outskirt-suburban-urban gradient, with strong spatial variation. LST and<span class='Apple-converted-space'> H<span style='color:#333333;background-color:#F9F9F9;'><span class='Apple-converted-space'> were negatively correlated with vegetation fraction cover (VFC). For example, the modern high-rise residential areas with relatively higher VFC had lower<span class='Apple-converted-space'> H<span style='color:#333333;background-color:#F9F9F9;'><span class='Apple-converted-space'> and<span class='Apple-converted-space'> <span style='color:#333333;background-color:#F9F9F9;'><span class='Apple-converted-space'> than the traditional low-rise residential areas. Our findings that indicate thermal dissipation through vegetation transpiration might play an important role in urban heat regulation. Notably, the thermal dissipating strength of vegetation (calculated as LE/VFC) declined exponentially with increased VFC. For the purpose of heat stress regulation, we recommend upgrading the traditional low-rise residential areas to modern high-rise residential areas and focusing urban greenery projects in areas whose VFC鈥< 0.1, where the heat regulating service by urban vegetation could be twice as effective as in other places.
|
| [7] |
Future population exposure to US heat extremes .https://doi.org/10.1038/nclimate2631 URL 摘要
Extreme heat events are likely to become more frequent in the coming decades owing to climate change. Exposure to extreme heat depends not only on changing climate, but also on changes in the size and spatial distribution of the human population. Here we provide a new projection of population exposure to extreme heat for the continental United States that takes into account both of these factors. Using projections from a suite of regional climate models driven by global climate models and forced with the SRES A2 scenario and a spatially explicit population projection consistent with the socioeconomic assumptions of that scenario, we project changes in exposure into the latter half of the twenty-first century. We find that US population exposure to extreme heat increases four- to sixfold over observed levels in the late twentieth century, and that changes in population are as important as changes in climate in driving this outcome. Aggregate population growth, as well as redistribution of the population across larger US regions, strongly affects outcomes whereas smaller-scale spatial patterns of population change have smaller effects. The relative importance of population and climate as drivers of exposure varies across regions of the country.
|
| [8] |
The contribution of outdoor air pollution sources to premature mortality on a global scale .https://doi.org/10.1038/nature15371 URL PMID: 26381985 [本文引用: 1] 摘要
Assessment of the global burden of disease is based on epidemiological cohort studies that connect premature mortality to a wide range of causes, including the long-term health impacts of ozone and fine particulate matter with a diameter smaller than 2.5 micrometres (PM2.5). It has proved difficult to quantify premature mortality related to air pollution, notably in regions where air quality is not monitored, and also because the toxicity of particles from various sources may vary. Here we use a global atmospheric chemistry model to investigate the link between premature mortality and seven emission source categories in urban and rural environments. In accord with the global burden of disease for 2010 (ref. 5), we calculate that outdoor air pollution, mostly by PM2.5, leads to 3.3 (95 per cent confidence interval 1.61-4.81) million premature deaths per year worldwide, predominantly in Asia. We primarily assume that all particles are equally toxic, but also include a sensitivity study that accounts for differential toxicity. We find that emissions from residential energy use such as heating and cooking, prevalent in India and China, have the largest impact on premature mortality globally, being even more dominant if carbonaceous particles are assumed to be most toxic. Whereas in much of the USA and in a few other countries emissions from traffic and power generation are important, in eastern USA, Europe, Russia and East Asia agricultural emissions make the largest relative contribution to PM2.5, with the estimate of overall health impact depending on assumptions regarding particle toxicity. Model projections based on a business-as-usual emission scenario indicate that the contribution of outdoor air pollution to premature mortality could double by 2050.
|
| [9] |
Cities and flooding: A guide to integrated urban flood risk management for the 21st century .https://doi.org/10.1111/jors.12006_6 URL [本文引用: 1] 摘要
The guide serves as a primer for decision and policy makers, technical specialists, central, regional and local government officials, and concerned stakeholders in the community sector, civil society and non-governmental organizations, and the private sector. The Guide embodies the state-of-the art on integrated urban flood risk management. The Guide starts with a summary for policy makers which outlines and describes the key areas which policy makers need to be knowledgeable about to create policy directions and an integrated strategic approach for urban flood risk management. The core of the Guide consists of seven chapters, organized as: understanding flood hazard; understanding flood impacts; integrated flood risk management (structural measures and non-structural measures); evaluating alternative flood risk management options: tools for decision makers; implementing integrated flood risk management; and conclusion. Each chapter starts with a full contents list and a summary of the chapter for quick reference.
|
| [10] |
Climate change and urban resilience .https://doi.org/10.1016/j.cosust.2010.12.014 URL Magsci [本文引用: 1] 摘要
Research highlights? Cities must become resilient to a wider range of shocks and stresses. ? Climate resilience must be bundled with efforts to promote urban development. ? Promotion of resilience raises equity concerns both within and across cities. ? Cities must identify ways to meet the costs associated with resilience efforts. ? Harnessing urban innovation potential is necessary in order to foster resilience.
|
| [11] |
Harnessing nature to help people adapt to climate change .https://doi.org/10.1038/nclimate1463 URL Magsci [本文引用: 1] 摘要
Adapting to climate change is among the biggest challenges humanity faces in the next century. An overwhelming focus of adaptation strategies to reduce climate change-related hazards has been on hard-engineering structures such as sea walls, irrigation infrastructure and dams. Closer attention to a broader spectrum of adaptation options is urgently needed. In particular, ecosystem-based adaptation approaches provide flexible, cost-effective and broadly applicable alternatives for buffering the impacts of climate change, while overcoming many drawbacks of hard infrastructure. As such, they are a critical tool at adaptation planners' disposal for tackling the threats that climate change poses to peoples' lives and livelihoods.
|
| [12] |
Resilience and stability of ecological systems .https://doi.org/10.1146/annurev.es.04.110173.000245 URL [本文引用: 1] 摘要
ABSTRACT THIS REVIEW EXPLORES BOTH ECOLOGICAL THEORY AND THE BEHAVIOR OF NATURAL SYSTEMS TO SEE IF DIFFERENT PERSPECTIVES OF THEIR BEHAVIOR CAN YIELD DIFFERENT INSIGHTS THAT ARE USEFUL FOR BOTH THEORY AND PRACTICE. THE RESILIENCE AND STABILITY VIEWPOINTS OF THE BEHAVIOR OF ECOLOGICAL SYSTEMS CAN YIELD VERY DIFFERENT APPROACHES TO THE MANAGEMENT OF RESOURCES. THE STABILITY VIEW EMPHASIZES THE EQUILIBRIUM, THE MAINTENANCE OF A PREDICTABLE WORLD, AND THE HARVESTING OF NATURE'S EXCESS PRODUCTION WITH AS LITTLE FLUCTUATION AS POSSIBLE. THE RESILIENCE VIEW EMPHASIZES DOMAINS OF ATTRACTION AND THE NEED FOR PERSISTENCE. BUT EXTINCTION IS NOT PURELY A RANDOM EVENT: IT RESULTS FROM THE INTERACTION OF RANDOM EVENTS WITH THOSE DETERMINISTIC FORCES THAT DEFINE THE SHAPE, SIZE AND CHARACTERISTICS OF THE DOMAIN OF ATTRACTION. THE VERY APPROACH, THEREFORE, THAT ASSURES A STABLE MAXIMUM SUSTAINED YIELD OF A RENEWABLE RESOURCE, MIGHT SO CHANGE THESE CONDITIONS THAT THE RESILIENCE IS LOST OR IS REDUCED SO THAT A CHANCE AND RARE EVENT THAT PREVIOUSLY COULD BE ABSORBED CAN TRIGGER A SUDDEN DRAMATIC CHANGE AND LOSS OF STRUCTURAL INTEGRITY OF THE SYSTEM. A MANAGEMENT APPROACH BASED ON RESILIENCE, ON THE OTHER HAND, WOULD EMPHASIZE THE NEED TO KEEP OPTIONS OPEN, THE NEED TO VIEW EVENTS IN A REGIONAL RATHER THAN A LOCAL CONTEXT, AND THE NEED TO EMPHASIZE HETEROGENEITY. THE RESILIENCE FRAMEWORK DOES NOT REQUIRE A PRECISE CAPACITY TO PREDICT THE FUTURE BUT ONLY A QUALITATIVE CAPACITY TO DEVISE SYSTEMS THAT CAN ABSORB AND ACCOMMODATE FUTURE EVENTS IN WHATEVER UNEXPECTED FORM THEY MAY TAKE.
|
| [13] |
|
| [14] |
Defining urban resilience: A review .https://doi.org/10.1016/j.landurbplan.2015.11.011 URL [本文引用: 1] 摘要
Fostering resilience in the face of environmental, socioeconomic, and political uncertainty and risk has captured the attention of academics and decision makers across disciplines, sectors, and scales. Resilience has become an important goal for cities, particularly in the face of climate change. Urban areas house the majority of the world's population, and, in addition to functioning as nodes of resource consumption and as sites for innovation, have become laboratories for resilience, both in theory and in practice. This paper reviews the scholarly literature on urban resilience and concludes that the term has not been well defined. Existing definitions are inconsistent and underdeveloped with respect to incorporation of crucial concepts found in both resilience theory and urban theory. Based on this literature review, and aided by bibliometric analysis, the paper identifies six conceptual tensions fundamental to urban resilience: (1) definition of rban ; (2) understanding of system equilibrium; (3) positive vs. neutral (or negative) conceptualizations of resilience; (4) mechanisms for system change; (5) adaptation versus general adaptability; and (6) timescale of action. To advance this burgeoning field, more conceptual clarity is needed. This paper, therefore, proposes a new definition of urban resilience. This definition takes explicit positions on these tensions, but remains inclusive and flexible enough to enable uptake by, and collaboration among, varying disciplines. The paper concludes with a discussion of how the definition might serve as a boundary object, with the acknowledgement that applying resilience in different contexts requires answering: Resilience for whom and to what? When? Where? And why?
|
| [15] |
The regional developing strategy, tendency and the development of Jing-Jin-Ji .https://doi.org/10.3969/j.issn.1002-3054.2008.06.001 URL [本文引用: 1] 摘要
本文通过对中国区域发展的基本态势和区域协调发展内涵的分析,提出各地区之间经济发展水平和 发展实力差距形成的主要原因,除区位、自然资源、历史基础外,近年来经济全球化、信息化发展以及大都市经济区的形成等因素是导致中国区域发展差距扩大的主 要因素,而从区域不平衡到较为平衡是一个长期的发展过程。在此基础上,对京津冀地区在中国对外开放大格局中的地位进行了分析,指出以京津为核心的大都市经 济区正在形成。同时,就如何正确看待天津滨海新区的地位、作用提出个人观点。
我国区域发展的战略、态势及京津冀协调发展分析 .https://doi.org/10.3969/j.issn.1002-3054.2008.06.001 URL [本文引用: 1] 摘要
本文通过对中国区域发展的基本态势和区域协调发展内涵的分析,提出各地区之间经济发展水平和 发展实力差距形成的主要原因,除区位、自然资源、历史基础外,近年来经济全球化、信息化发展以及大都市经济区的形成等因素是导致中国区域发展差距扩大的主 要因素,而从区域不平衡到较为平衡是一个长期的发展过程。在此基础上,对京津冀地区在中国对外开放大格局中的地位进行了分析,指出以京津为核心的大都市经 济区正在形成。同时,就如何正确看待天津滨海新区的地位、作用提出个人观点。
|
| [16] |
Research on the model of optimization and reorganization of eco-spatial structure in urban agglomeration region and its application: A case study of the urban agglomeration in Central Plains Region .https://doi.org/10.11820/dlkxjz.2010.03.016 URL Magsci 摘要
城市群生态空间结构优化将会促进城市群经济社会环境可持续发展。在深入分析城市群生态空间结构与城市群经济社会发展之间的空间相互作用、互利共生和协同进化等优化依据基础上,构建了城市群生态空间结构优化组合模式。作者阐述并分析了中原城市群建设过程中生态空间结构紊乱原因、空间结构演变趋势和生态空间结构优化模式。最后提出中原城市群生态空间结构优化对策建议:因地制宜,构建完善高效的"斑块—廊道—基质"城市群生态网络系统;促进城市群区域各城市合理分工,不断形成产业簇群;构建城市群发展引导机制,使城市群区域的城乡建设转向更加适宜人们居住的生态环境友好型地区。
城市群生态空间结构优化组合模式及对策: 以中原城市群为例 .https://doi.org/10.11820/dlkxjz.2010.03.016 URL Magsci 摘要
城市群生态空间结构优化将会促进城市群经济社会环境可持续发展。在深入分析城市群生态空间结构与城市群经济社会发展之间的空间相互作用、互利共生和协同进化等优化依据基础上,构建了城市群生态空间结构优化组合模式。作者阐述并分析了中原城市群建设过程中生态空间结构紊乱原因、空间结构演变趋势和生态空间结构优化模式。最后提出中原城市群生态空间结构优化对策建议:因地制宜,构建完善高效的"斑块—廊道—基质"城市群生态网络系统;促进城市群区域各城市合理分工,不断形成产业簇群;构建城市群发展引导机制,使城市群区域的城乡建设转向更加适宜人们居住的生态环境友好型地区。
|
| [17] |
Study on urban agglomeration: Progress and prospects .https://doi.org/10.11821/yj2011050001 URL 摘要
城市群是指以中心城市为核心向周围辐射构成的多个城市的集合体。城市群的形成是经济发展和产业布局的客观反映,并已成为发达国家城市化的主体形态。进入21世纪,中国加入世界贸易组织,沿海城市群成为国家外向性经济、出口贸易和"世界工厂"的主要地区,以城市群为主体推进中国城市化进程成为中国特色城市化道路的重要选择。本文重点就城市群概念、城市群国外研究、中国城市群的早期研究、中国城市群作为国家战略的研究进行了综述,对中国城市群研究进行了展望。本文认为:中国城市群形成机制较西方发达国家和地区要复杂得多,相关研究也需要结合中国国情进行理论和方法的创新。
城市群研究进展与展望 .https://doi.org/10.11821/yj2011050001 URL 摘要
城市群是指以中心城市为核心向周围辐射构成的多个城市的集合体。城市群的形成是经济发展和产业布局的客观反映,并已成为发达国家城市化的主体形态。进入21世纪,中国加入世界贸易组织,沿海城市群成为国家外向性经济、出口贸易和"世界工厂"的主要地区,以城市群为主体推进中国城市化进程成为中国特色城市化道路的重要选择。本文重点就城市群概念、城市群国外研究、中国城市群的早期研究、中国城市群作为国家战略的研究进行了综述,对中国城市群研究进行了展望。本文认为:中国城市群形成机制较西方发达国家和地区要复杂得多,相关研究也需要结合中国国情进行理论和方法的创新。
|
| [18] |
Progress and the future direction of research into urban agglomeration in China .中国城市群研究取得的重要进展与未来发展方向 . |
| [19] |
Theoretical analysis of interactive coupled effects between urbanization and eco-environment in mega-urban agglomerations .https://doi.org/10.11821/dlxb201604001 URL [本文引用: 1] 摘要
特大城市群地区是国家经济发展的战略核心区和国家新型城镇化的主体区,担当着世界经济重心转移承载地的历史重任,但在发展过程中面临着日益严重的资源与生态环境的胁迫压力.开展特大城市群地区城镇化与生态环境交互耦合效应的研究,是未来10年地球系统科学研究的前沿领域和高优先研究主题.本文系统解析了特大城市群地区城镇化与生态环境交互耦合效应的基本理论框架.首先从理论上分析了特大城市群系统各自然要素和人文要素交互作用的非线性耦合关系及耦合特征,科学辨识近远程主控要素作用下城市群系统内外部各要素相互作用的胁迫强度、近远程耦合机理与规律,总结特大城市群地区城镇化与生态环境交互耦合圈理论,进一步构建多要素—多尺度—多情景—多模块—多智能体集成的时空耦合动力学模型,研发特大城市群地区可持续发展优化智能调控决策支持系统;其次从方法上将特大城市群地区视为一个开放的复杂巨系统,在建立同一标准化共享数据库的基础上,采用多要素—多目标—多模型—多情景环境下的城镇化与生态环境交互耦合集成技术方法、大数据支持下的城镇化与生态环境交互耦合技术方法,构建多尺度—多技术—多智能体集成的城镇化与生态环境交互耦合技术框架,按照分析时空演变特征—寻求主控要素—辨识耦合关系—揭示胁迫机制—发现耦合规律—筛选调控变量—求解临界阈值—进行调控试验—完成情景模拟—提出优化方案—完成情景模拟—提出优化方案—实现国家目标这样一条技术路径,提出解决问题的整体优化方案.本文旨在为特大城市群地区由问题集中区转为可持续发展区提供理论指导和方法支撑.
特大城市群地区城镇化与生态环境交互耦合效应解析的理论框架及技术路径 .https://doi.org/10.11821/dlxb201604001 URL [本文引用: 1] 摘要
特大城市群地区是国家经济发展的战略核心区和国家新型城镇化的主体区,担当着世界经济重心转移承载地的历史重任,但在发展过程中面临着日益严重的资源与生态环境的胁迫压力.开展特大城市群地区城镇化与生态环境交互耦合效应的研究,是未来10年地球系统科学研究的前沿领域和高优先研究主题.本文系统解析了特大城市群地区城镇化与生态环境交互耦合效应的基本理论框架.首先从理论上分析了特大城市群系统各自然要素和人文要素交互作用的非线性耦合关系及耦合特征,科学辨识近远程主控要素作用下城市群系统内外部各要素相互作用的胁迫强度、近远程耦合机理与规律,总结特大城市群地区城镇化与生态环境交互耦合圈理论,进一步构建多要素—多尺度—多情景—多模块—多智能体集成的时空耦合动力学模型,研发特大城市群地区可持续发展优化智能调控决策支持系统;其次从方法上将特大城市群地区视为一个开放的复杂巨系统,在建立同一标准化共享数据库的基础上,采用多要素—多目标—多模型—多情景环境下的城镇化与生态环境交互耦合集成技术方法、大数据支持下的城镇化与生态环境交互耦合技术方法,构建多尺度—多技术—多智能体集成的城镇化与生态环境交互耦合技术框架,按照分析时空演变特征—寻求主控要素—辨识耦合关系—揭示胁迫机制—发现耦合规律—筛选调控变量—求解临界阈值—进行调控试验—完成情景模拟—提出优化方案—完成情景模拟—提出优化方案—实现国家目标这样一条技术路径,提出解决问题的整体优化方案.本文旨在为特大城市群地区由问题集中区转为可持续发展区提供理论指导和方法支撑.
|
| [20] |
Using impervious surfaces to detect urban expansion in Beijing of China in 2000s .https://doi.org/10.1007/s11769-016-0802-5 URL [本文引用: 1] |
| [21] |
Landscape as a continuum: An examination of the urban landscape structures and dynamics of Indianapolis City, 1991-2000, by using satellite images .https://doi.org/10.1080/01431160802552777 URL [本文引用: 1] 摘要
The majority of the vast literature on remote sensing of urban landscapes has adopted a ‘hard classification’ approach, in which each image pixel is assigned a single land use and land cover category. Owing to the nature of urban landscapes, the confusion between land use and land cover definitions and the constraints of widely applied medium spatial resolution satellite images, high classification accuracy has been difficult to achieve with the conventional ‘hard’ classifiers. The prevalence of the mixed pixel problem in urban landscapes indicates a crucial need for an alternative approach to urban analyses. Identification, description and quantification, rather than classification, may provide a better understanding of the compositions and processes of heterogeneous landscapes such as urban areas. This study applied the Vegetation–Impervious Surface–Soil (V‐I‐S) model for characterizing urban landscapes and analysing their dynamics in Indianapolis, USA, between 1991 and 2000. To extract these landscape components from three dates of Landsat Thematic Mapper/Enhanced Thematic Mapper Plus (TM/ETM+) images in 1991 1995 and 2000, we used the technique of linear spectral mixture analysis (LSMA). These components were further classified into urban thematic classes, and used for analysis of the landscape patterns and dynamics. The results indicate that LSMA provides a suitable technique for detecting and mapping urban materials and V‐I‐S component surfaces in repetitive and consistent ways, and for solving the spectral mixing of medium spatial resolution satellite imagery. The reconciliation between the V‐I‐S model with LSMA for Landsat imagery allowed this continuum landscape model to be an alternative, effective approach to characterizing and quantifying the spatial and temporal changes of the urban landscape compositions in Indianapolis from 1991 to 2000. It is suggested that the model developed in this study offers a more realistic and robust representation of the true nature of urban landscapes, as compared with the conventional method based on ‘hard classification’ of satellite imagery. The general applicability of this continuum model, especially its spectral, spatial and temporal variability, is discussed.
|
| [22] |
Quantifying spatiotemporal patterns of urbanization: The case of the two fastest growing metropolitan regions in the United States .https://doi.org/10.1016/j.ecocom.2010.03.002 URL Magsci 摘要
Urbanization is the most drastic form of land use change affecting biodiversity and ecosystem functioning and services far beyond the limits of cities. To understand the process of urbanization itself as well as its ecological consequences, it is important to quantify the spatiotemporal patterns of urbanization. Based on historical land use data, we characterize the temporal patterns of Phoenix and Las Vegas the two fastest growing metropolitan regions in the United States 鈥 using landscape pattern metrics at multiple spatial resolutions. Our results showed that the two urban landscapes exhibited strikingly similar temporal patterns of urbanization. During the past several decades, urbanization in the two desert cities resulted in an increasingly faster increase in the patch density, edge density, and structural complexity at both levels of urban land use and the entire landscape. That is, as urbanization continued to unfold, both landscapes became increasingly more diverse in land use, more fragmented in structure, and more complex in shape. The high degree of similarity between the two metropolitan regions may be attributable to their resemblance in the natural environment, the form of population growth, and the stage of urban development. While our results corroborated some theoretical predictions in the literature, they also showed spatiotemporal signatures of urbanization that were different from other cities. Resolving these differences can certainly further our understanding of urban dynamics. Finally, this study suggests that a small set of landscape metrics is able to capture the main spatiotemporal signatures of urbanization, and that the general patterns of urbanization do not seem to be significantly affected by changing grain sizes of land use maps when the spatial extent is fixed. This landscape pattern analysis approach is not only effective for quantifying urbanization patterns, but also for evaluating spatial urban models and investigating ecological effects of urbanization.
|
| [23] |
Quatifying spatiotemporal patterns dynamics of impervious surface in Shenzhen .https://doi.org/10.11821/yj2012080017 URL Magsci 摘要
定量监测城市不透水表面扩展过程,是分析城市景观格局动态,深入剖析城市地区空间镶嵌体内部异质性景观相互转化的重要基础。以深圳市为例,通过定量划分城市不透水表面等级体系,计算不透水表面的转移矩阵与景观格局指数,分析不透水表面的时空动态,结果表明:1990~2005年间,高盖度及极高盖度的不透水表面持续增加,中盖度及低盖度不透水表面先增加后减少,而自然地表及极低盖度的不透水表面则为先减少后恢复,反映了城市化进程对城市地表覆被的结构性影响。景观格局变化显示景观多样性程度较高,且经历了低-高-低-高的变化;斑块在1990年以自然地表为主,1995年以后以中盖度等级为主,高盖度等级显著增加。自然地表和中等盖度的不透水表面变化分别主导着前期和中后期的变化过程。城市建设的迅速扩张,将林地、农田、水体及滩涂等自然地表快速地转变为不同功能的建设用地,主导着不透水表面等级分布的梯度性变化。
深圳市不透水表面的遥感监测与时空格局 .https://doi.org/10.11821/yj2012080017 URL Magsci 摘要
定量监测城市不透水表面扩展过程,是分析城市景观格局动态,深入剖析城市地区空间镶嵌体内部异质性景观相互转化的重要基础。以深圳市为例,通过定量划分城市不透水表面等级体系,计算不透水表面的转移矩阵与景观格局指数,分析不透水表面的时空动态,结果表明:1990~2005年间,高盖度及极高盖度的不透水表面持续增加,中盖度及低盖度不透水表面先增加后减少,而自然地表及极低盖度的不透水表面则为先减少后恢复,反映了城市化进程对城市地表覆被的结构性影响。景观格局变化显示景观多样性程度较高,且经历了低-高-低-高的变化;斑块在1990年以自然地表为主,1995年以后以中盖度等级为主,高盖度等级显著增加。自然地表和中等盖度的不透水表面变化分别主导着前期和中后期的变化过程。城市建设的迅速扩张,将林地、农田、水体及滩涂等自然地表快速地转变为不同功能的建设用地,主导着不透水表面等级分布的梯度性变化。
|
| [24] |
|
| [25] |
Study on spatial pattern of land-use change in China during 1995-2000 .https://doi.org/10.3321/j.issn:1006-9267.2002.12.008 URL [本文引用: 1] 摘要
在全球环境变化研究中, 土地利用和土地覆被动态越来越被认为是一个关键而迫切的研究课题. 依据覆盖中国1990年代末期5 a时间间隔的陆地卫星数据资料, 研究了土地利用变化的特征和空间分布规律. 依据土地利用动态度的概念, 在1 km格网土地利用变化数据基础上, 根据区域近期土地利用动态特点与社会、自然环境综合特征, 设计了全国土地利用动态区划图, 揭示了土地利用变化过程的空间格局. 总体上, 传统农作区(包括黄淮海平原、长江三角洲地区和四川盆地等)城镇居民建设用地的扩张侵占了大面积的耕地, 而北方农牧交错带与西北绿洲农业区由于生产条件、经济利益和气候变化等方面的原因, 耕地开垦现象最为突出. 国家退耕还林还草政策的实施效果在局部地区有所体现, 但截至2000年, 尚未对土地覆被变化产生区域性的影响, 此5 a期间森林砍伐现象依然比较严峻. 本项研究, 实现了中国现代土地利用动态区域单元的划分, 揭示了中国现代土地利用变化的时间-空间属性并为其特征分析提供了区域格局框架. 该项研究是地理科学对研究对象的"空间格局"与"时间过程"特征进行集成研究, 揭示研究对象"变化过程的格局", 以及"格局的变化过程"的一次有益的尝试.
中国近期土地利用变化的空间格局分析 .https://doi.org/10.3321/j.issn:1006-9267.2002.12.008 URL [本文引用: 1] 摘要
在全球环境变化研究中, 土地利用和土地覆被动态越来越被认为是一个关键而迫切的研究课题. 依据覆盖中国1990年代末期5 a时间间隔的陆地卫星数据资料, 研究了土地利用变化的特征和空间分布规律. 依据土地利用动态度的概念, 在1 km格网土地利用变化数据基础上, 根据区域近期土地利用动态特点与社会、自然环境综合特征, 设计了全国土地利用动态区划图, 揭示了土地利用变化过程的空间格局. 总体上, 传统农作区(包括黄淮海平原、长江三角洲地区和四川盆地等)城镇居民建设用地的扩张侵占了大面积的耕地, 而北方农牧交错带与西北绿洲农业区由于生产条件、经济利益和气候变化等方面的原因, 耕地开垦现象最为突出. 国家退耕还林还草政策的实施效果在局部地区有所体现, 但截至2000年, 尚未对土地覆被变化产生区域性的影响, 此5 a期间森林砍伐现象依然比较严峻. 本项研究, 实现了中国现代土地利用动态区域单元的划分, 揭示了中国现代土地利用变化的时间-空间属性并为其特征分析提供了区域格局框架. 该项研究是地理科学对研究对象的"空间格局"与"时间过程"特征进行集成研究, 揭示研究对象"变化过程的格局", 以及"格局的变化过程"的一次有益的尝试.
|
| [26] |
Spatial patterns and driving forces of land use change in China during the early 21st century .https://doi.org/10.1007/s11442-010-0483-4 Magsci [本文引用: 1] 摘要
<p>Land use and land cover change as the core of coupled human-environment systems has become a potential field of land change science (LCS) in the study of global environmental change. Based on remotely sensed data of land use change with a spatial resolution of 1 km × 1 km on national scale among every 5 years, this paper designed a new dynamic regionalization according to the comprehensive characteristics of land use change including regional differentiation, physical, economic, and macro-policy factors as well. Spatial pattern of land use change and its driving forces were investigated in China in the early 21st century. To sum up, land use change pattern of this period was characterized by rapid changes in the whole country. Over the agricultural zones, e.g., Huang-Huai-Hai Plain, the southeast coastal areas and Sichuan Basin, a great proportion of fine arable land were engrossed owing to considerable expansion of the built-up and residential areas, resulting in decrease of paddy land area in southern China. The development of oasis agriculture in Northwest China and the reclamation in Northeast China led to a slight increase in arable land area in northern China. Due to the “Grain for Green” policy, forest area was significantly increased in the middle and western developing regions, where the vegetation coverage was substantially enlarged, likewise. This paper argued the main driving forces as the implementation of the strategy on land use and regional development, such as policies of “Western Development”, “Revitalization of Northeast”, coupled with rapidly economic development during this period.</p>
|
| [27] |
Regional mapping of human settlements in southeastern China with multi-sensor remotely sensed data .https://doi.org/10.1016/j.rse.2008.05.009 URL [本文引用: 1] 摘要
Mapping human settlements from remotely sensed data at regional and global scales has attracted increasingly attention but remains a challenge. The thresholding technique is a common approach for settlement mapping based on the DMSP-OLS data. However, this approach often omits the areas with small proportional settlements such as towns and villages and overestimates urban extents, resulting in information loss of spatial patterns. This paper explored an integrated approach based on a combined use of multiple remotely sensed data to map settlements in southeastern China. Human settlements for selected sites were mapped from Landsat ETM+ images with a hybrid approach and they were used as reference data. The DMSP-OLS and Terra MODIS NDVI data were combined to develop a settlement index image. This index image was used to map a pixel-based settlement image with expert rules. A regression model was established to estimate fractional settlements at the regional scale, which the DMSP-OLS and MODIS NDVI data were used as independent variables and the settlement data derived from ETM+ images were used as a dependent variable. This research indicated that a combination of DMSP-OLS and NDVI variables provided a better estimation performance than single DMSP-OLS or NDVI variable, and the integrated approach for settlement mapping at the regional scale was promising. Compared to the results from the traditional thresholding technique, the estimated fractional settlement image in this paper greatly improved the spatial patterns of settlement distribution and accuracy of settlement areas. This paper provided a rapid and accurate approach to estimate fractional settlements from coarse spatial resolution images at the regional scale by combining a limited number of medium spatial resolution images. This research is especially valuable for timely updating settlement databases at regional and global scales with limited time, labor, and cost.
|
| [28] |
Pattern of impervious surface change and its effect on water environment in the Beijing-Tianjin-Tangshan Metropolitan Area .https://doi.org/10.11821/xb201111005 URL [本文引用: 3] 摘要
不透水地表(Impervious Surface Area,ISA)时空格局是城市化与全球环境变化交互影响下的土地利用/覆盖变化—生态系统过程—区域气候变化相互作用机理以及导致的环境效应研究的重要内容。如何快速准确地实现区域尺度不透水地表遥感信息的获取是上述研究面临的重要瓶颈问题。本研究嵌入中国LUCC信息改进了基于MODISNDVI与夜间灯光指数(DMSP-OLS)提取不透水地表信息的方法,反演了2000年与2008年京津唐城市群2期250m不透水地表信息,进而分析其变化的时空格局,结合子流域单元与河流污染物监测数据评价其对海河流域地表水环境的影响。结论表明:受环渤海经济区,天津滨海新区开发等政策的影响,京津唐城市群在21世纪初8年不透水地表沿着城—乡梯度带、城市交通廊道及海岸带高速增长。城乡建设用地不透水地表增长呈现显著的时空差异特征,由于北京市受人口-资源-环境的压力,产业发展不断向周边地区转移,天津与河北唐山、廊坊、秦皇岛三市具有更快的不透水地表增长速度。京津唐城市群城市高密度的不透水地表分布对于海河流域地表水环境产生严重影响,不透水地表的增长加剧了流域河流水质的污染程度。同时也发现,子流域不透水地表面积比例与COD、NH3-N浓度均值呈现显著的线性关系。
京津唐城市群不透水地表增长格局以及水环境效应 .https://doi.org/10.11821/xb201111005 URL [本文引用: 3] 摘要
不透水地表(Impervious Surface Area,ISA)时空格局是城市化与全球环境变化交互影响下的土地利用/覆盖变化—生态系统过程—区域气候变化相互作用机理以及导致的环境效应研究的重要内容。如何快速准确地实现区域尺度不透水地表遥感信息的获取是上述研究面临的重要瓶颈问题。本研究嵌入中国LUCC信息改进了基于MODISNDVI与夜间灯光指数(DMSP-OLS)提取不透水地表信息的方法,反演了2000年与2008年京津唐城市群2期250m不透水地表信息,进而分析其变化的时空格局,结合子流域单元与河流污染物监测数据评价其对海河流域地表水环境的影响。结论表明:受环渤海经济区,天津滨海新区开发等政策的影响,京津唐城市群在21世纪初8年不透水地表沿着城—乡梯度带、城市交通廊道及海岸带高速增长。城乡建设用地不透水地表增长呈现显著的时空差异特征,由于北京市受人口-资源-环境的压力,产业发展不断向周边地区转移,天津与河北唐山、廊坊、秦皇岛三市具有更快的不透水地表增长速度。京津唐城市群城市高密度的不透水地表分布对于海河流域地表水环境产生严重影响,不透水地表的增长加剧了流域河流水质的污染程度。同时也发现,子流域不透水地表面积比例与COD、NH3-N浓度均值呈现显著的线性关系。
|
| [29] |
Remote sensing-based artificial surface cover classification in Asia and spatial pattern analysis .https://doi.org/10.1007/s11430-016-5295-7 URL [本文引用: 1] 摘要
Artificial surfaces, characterized with intensive land-use changes and complex landscape structures, are important indicators of human impacts on terrestrial ecosystems. Without high-resolution land-cover data at continental scale, it is hard to evaluate the impacts of urbanization on regional climate, ecosystem processes and global environment. This study constructed a hierarchical classification system for artificial surfaces, promoted a remote sensing method to retrieve subpixel components of artificial surfaces from 30-m resolution satellite imageries (GlobeLand30) and developed a series of data products of high-precision urban built-up areas including impervious surface and vegetation cover in Asia in 2010. Our assessment, based on multisource data and expert knowledge, showed that the overall accuracy of classification was 90.79%. The mean relative error for the impervious surface components of cities was 0.87. The local error of the extracted information was closely related to the heterogeneity of urban buildings and vegetation in different climate zones. According to our results, the urban built-up area was 18.18 10 4 km 2 , accounting for 0.59% of the total land surface areas in Asia; urban impervious surfaces were 11.65 10 4 km 2 , accounting for 64.09% of the total urban built-up area in Asia. Vegetation and bare soils accounted for 34.56% of the urban built-up areas. There were three gradients: a concentrated distribution, a scattered distribution and an indeterminate distribution from east to west in terms of spatial pattern of urban impervious surfaces. China, India and Japan ranked as the top three countries with the largest impervious surface areas, which respectively accounted for 32.77%, 16.10% and 11.93% of the urban impervious surface area of Asia. We found the proportions of impervious surface and vegetation cover within urban built-up areas were closely related to the economic development degree of the country and regional climate environment. Built-up areas in developed countries had relatively low impervious surface and high public green vegetation cover, with 50 60% urban impervious surfaces in Japan, South Korea and Singapore. In comparison, the proportion of urban impervious surfaces in developing countries is approaching or exceeding 80% in Asia. In general, the composition and spatial patterns of built-up areas reflected population aggregation and economic development level as well as their impacts on the health of the environment in the sub-watershed.
|
| [30] |
Spatiotemporal dynamics of impervious surface areas across China during the early 21st century .https://doi.org/10.1007/s11434-012-5568-2 URL [本文引用: 2] 摘要
China has experienced an unprecedented urbanization and industrialization in the past decades. In this research, we examined the dynamics of construction lands and impervious surface areas (ISA) based on land use/cover change and ISA datasets between 2000 and 2008, which were provided by the national resources and environmental remote sensing information platform. The results indicated that the construction areas and ISA increased by 3468.30 and 2212.24 km 2 /a in this period primarily due to the implementation of national macro-development strategies and fast-growing economy. In 2008, ISA accounted for 0.86% of the total land area in China. Urban land areas increased by 43.46% between 2000 and 2008. The annual growth rate of 1788.22 km 2 /a in this period was 2.18 times that in the 1990s. In particular, urban ISA increased by 53.30% between 2000 and 2008 with an annual growth rate of 1348.85 km 2 /a. During the 8 years, the ISA in China increased rapidly, especially in the Beijing-Tianjin-Tangshan Metropolitan Region, Pearl River Delta, Yangtze River Delta, and the western China region. The increasing ISA may influence potentially water environmental quality in the major basins. In particular, the number of subbasins having ISA of greater than 10% increased considerably, which were primarily distributed in the Haihe River, Yangtze River and Pearl River basins. In 2008, 14.42% of the basin areas were affected by the increased ISA.
|
| [31] |
Modeling gross primary production of temperate deciduous broadleaf forest using satellite images and climate data .https://doi.org/10.1016/j.rse.2004.03.010 URL [本文引用: 1] 摘要
Net ecosystem exchange (NEE) of CO 2 between the atmosphere and forest ecosystems is determined by gross primary production (GPP) of vegetation and ecosystem respiration. CO 2 flux measurements at individual CO 2 eddy flux sites provide valuable information on the seasonal dynamics of GPP. In this paper, we developed and validated the satellite-based Vegetation Photosynthesis Model (VPM), using site-specific CO 2 flux and climate data from a temperate deciduous broadleaf forest at Harvard Forest, Massachusetts, USA. The VPM model is built upon the conceptual partitioning of photosynthetically active vegetation and non-photosynthetic vegetation (NPV) within the leaf and canopy. It estimates GPP, using satellite-derived Enhanced Vegetation Index (EVI), Land Surface Water Index (LSWI), air temperature and photosynthetically active radiation (PAR). Multi-year (1998 2001) data analyses have shown that EVI had a stronger linear relationship with GPP than did the Normalized Difference Vegetation Index (NDVI). Two simulations of the VPM model were conducted, using vegetation indices from the VEGETATION (VGT) sensor onboard the SPOT-4 satellite and the Moderate Resolution Imaging Spectroradiometer (MODIS) sensor onboard the Terra satellite. The predicted GPP values agreed reasonably well with observed GPP of the deciduous broadleaf forest at Harvard Forest, Massachusetts. This study highlighted the biophysical performance of improved vegetation indices in relation to GPP and demonstrated the potential of the VPM model for scaling-up of GPP of deciduous broadleaf forests.
|
| [32] |
Spatial pattern and topographic control of China's agricultural productivity variability .
中国农田生产力变化的空间格局及地形控制作用 .
|
| [33] |
Estimation of gross primary productivity in Chinese terrestrial ecosystems by using VPM Model .https://doi.org/10.3969/j.issn.1001-7410.2014.04.05 URL [本文引用: 1] 摘要
陆地生态系统总初级生产力(Gross Primary Productivity,简称GPP)时空格局及其变化动态的准确监测是区域碳收支研究的核心问题之一,遥感模型正在为区域碳通量监测提供更为实时、准确的模拟数据.基于中分辨率成像光谱仪(MODerate-resolution Imaging Spectroradiometer,简称MODIS)遥感数据和涡度相关碳通量观测数据发展而来的VPM模型经过10年的努力,目前已经在全球涵盖十类生态系统的21个站点上开展模型的校验与验证研究,为区域GPP的准确估算与监测奠定了方法基础.本研究构建了评估GPP区域格局的VPM模型区域模式,以空间分辨率500m、时间步长8天的MODIS卫星影像数据以及相同时空分辨率的温度与光合有效辐射数据为模型输入数据,模拟估算我国2006~2008年GPP及其空间分布格局.VPM模型模拟的中国陆地生态系统GPP年总量平均值为5.0Pg C/a,其中森林、草地、农田和灌丛生态系统分别占34%,17%,37%和12%.本研究模拟的全国GPP总量与多模型模拟的平均结果(5.40 Pg C/a)相当,但不同模型估算的各类生态系统GPP存在较大差异.本研究通过利用遥感数据对VPM模型中的关键参数(最大光能利用率)进行参数空间化,表达同一土地覆被类型内部光能利用率的空间异质性;应用目前我国准确性最为可靠的土地利用与植被数据提取土地覆被数据,首次将农业多熟种植作为单独的植被类型引入模型中,模型参数与输入数据的精度保障了模型模拟结果的可靠性.
中国陆地生态系统总初级生产力VPM遥感模型估算 .https://doi.org/10.3969/j.issn.1001-7410.2014.04.05 URL [本文引用: 1] 摘要
陆地生态系统总初级生产力(Gross Primary Productivity,简称GPP)时空格局及其变化动态的准确监测是区域碳收支研究的核心问题之一,遥感模型正在为区域碳通量监测提供更为实时、准确的模拟数据.基于中分辨率成像光谱仪(MODerate-resolution Imaging Spectroradiometer,简称MODIS)遥感数据和涡度相关碳通量观测数据发展而来的VPM模型经过10年的努力,目前已经在全球涵盖十类生态系统的21个站点上开展模型的校验与验证研究,为区域GPP的准确估算与监测奠定了方法基础.本研究构建了评估GPP区域格局的VPM模型区域模式,以空间分辨率500m、时间步长8天的MODIS卫星影像数据以及相同时空分辨率的温度与光合有效辐射数据为模型输入数据,模拟估算我国2006~2008年GPP及其空间分布格局.VPM模型模拟的中国陆地生态系统GPP年总量平均值为5.0Pg C/a,其中森林、草地、农田和灌丛生态系统分别占34%,17%,37%和12%.本研究模拟的全国GPP总量与多模型模拟的平均结果(5.40 Pg C/a)相当,但不同模型估算的各类生态系统GPP存在较大差异.本研究通过利用遥感数据对VPM模型中的关键参数(最大光能利用率)进行参数空间化,表达同一土地覆被类型内部光能利用率的空间异质性;应用目前我国准确性最为可靠的土地利用与植被数据提取土地覆被数据,首次将农业多熟种植作为单独的植被类型引入模型中,模型参数与输入数据的精度保障了模型模拟结果的可靠性.
|
| [34] |
|
| [35] |
Global distribution and density of constructed impervious surfaces .https://doi.org/10.3390/s7091962 URL PMID: 3841857 [本文引用: 1] 摘要
We present the first global inventory of the spatial distribution and density ofconstructed impervious surface area (ISA). Examples of ISA include roads, parking lots,buildings, driveways, sidewalks and other manmade surfaces. While high spatialresolution is required to observe these features, the new product reports the estimateddensity of ISA on a one-km2 grid based on two coarse resolution indicators of ISA 01040000“ thebrightness of satellite observed nighttime lights and population count. The model wascalibrated using 30-meter resolution ISA of the USA from the U.S. Geological Survey.Nominally the product is for the years 2000-01 since both the nighttime lights andreference data are from those two years. We found that 1.05% of the United States landarea is impervious surface (83,337 km2) and 0.43 % of the world0104000064s land surface (579,703km2) is constructed impervious surface. China has more ISA than any other country(87,182 km2), but has only 67 m2 of ISA per person, compared to 297 m2 per person in theUSA. The distribution of ISA in the world0104000064s primary drainage basins indicates that watersheds damaged by ISA are primarily concentrated in the USA, Europe, Japan, China and India. The authors believe the next step for improving the product is to include reference ISA data from many more areas around the world.
|
| [36] |
Analysis of non-point pollution export from small catchments .https://doi.org/10.2118/7561-PA URL 摘要
A year-long study was conducted in the Occoquan and Four-Mile Run basins of northern Virginia to determine the effect of land use on the quantity and quality of runoff from the receiving area of small catchments. Twenty-one sites were selected ranging from undisturbed forest land to highly urbanized sites. All runoff events at all operable stations were monitored for flow and pollutant load. The results were analyzed using nonparametric statistical methods. Analysis showed that pollutant yield from residential/urban sites increased monotonically as the percentage imperviousness of the catchment receiving area increased for most pollutants. The flushing characteristics of runoff events from different sites were also investigated. It was found that insoluble pollutants exhibited a first flush response while soluble pollutants did not.
|
| [37] |
Linking ecosystem services and landscape patterns to assess urban ecosystem health: A case study in Shenzhen City, China .https://doi.org/10.1016/j.landurbplan.2015.06.007 URL 摘要
Ecosystem health assessment is always one of the key topics of ecosystem management. However, few studies has focused on assessing ecosystem health of landscapes, which are geo-spatial units composed of different kinds of ecosystem mosaics. Healthy ecosystems should sustainably provide a range of ecosystem services to meet human needs, and such a concept often cannot be expressed using the traditional ecosystem health assessment. Using Shenzhen City in China as a case study area, this research aims to assess the ecosystem health of urban landscapes based on ecosystem services. Results showed a distinct deterioration of urban ecosystem health for all of the 30 units assessed in Shenzhen City during 1978–2005. Five levels were classified with respect to health using fixed thresholds. There were 12 towns appearing with the worst level and 4 towns disappearing with the best level in 2005 compared with the status in 1978. Although there was no significant decrease in the level of health during 1978–2000, by 2005 more than 70% of towns belonged to the top two levels, classifying them as unhealthy. Among all the assessing indicators, the indicators of ecosystem organization contributed least to ecosystem health, except in 1986, and ecosystem services were found to be the most contributive indicator during 1978–2005. It was also suggested that land use patterns provided an integrating bridge among regional ecosystem health, economic development, and environmental performances.
|
| [38] |
Controlling Urban Runoff: A Practical Manual for Planning and Designing Urban BMPs .URL 摘要
This manual provides detailed guidance for engineers and site planners on how to plan and design urban best management practices (BMPs) to remove pollutants and protect stream habitat. Describes water quality and habitat impacts in streams that result from uncontrolled watershed development. Contains a simple method for estimating pollutant export from development sites. Presents a series of tools to assist the site designer in selecting the best BMP option for a site. Provides detailed design guidance on seven major urban BMP practices in use in the Washington metropolitan area: extended detention ponds, wet ponds, infiltration basins and trenches, porous pavement, water quality inlets and vegetative practices. Each BMP is reviewed from the standpoint of stormwater management benefits, pollutant removal, physical feasibility, costs, maintenance requirements, and impacts to the environment and adjacent communities. A list of recommended design standards that enhance BMP performance is also presented.
|
| [39] |
The importance of imperviousness .https://doi.org/10.9774/GLEAF.978-1-909493-38-4_2 URL 摘要
In this article a unifying theme is proposed based on a physically defined unit-imperviousness. Imperviousness here is defined as the sum of roads, parking lots, sidewalks, rooftops, and other impermeable surfaces of the urban landscape. This variable can be easily measured at all scales of development, as the percentage of area that is not "green". Imperviousness is a very useful indicator with which to measure the impacts of land development on aquatic systems. Reviewed here is the scientific evidence that relates imperviousness to specific changes in the hydrology, habitat structure, water quality and biodiversity of aquatic systems. This research, conducted in many geographic areas, concentrating on many different variables, and employing widely different methods, has yielded a surprisingly similar conclusion-stream degradation occurs at relatively low levels of imperviousness (10-20%). Most importantly, imperviousness is one of the few variables that can be explicitly quantified, managed and controlled at each stage of land development. The remainder of this paper examines in detail the relationship between imperviousness and stream quality.
|
| [40] |
From metaphor to measurement: Resilience of what to what? https://doi.org/10.1007/s10021-001-0045-9 Magsci [本文引用: 2] 摘要
<a name="Abs1"></a><div class="AbstractPara"> <div class="">Resilience is the magnitude of disturbance that can be tolerated before a socioecological system (SES) moves to a different region of state space controlled by a different set of processes. Resilience has multiple levels of meaning: as a metaphor related to sustainability, as a property of dynamic models, and as a measurable quantity that can be assessed in field studies of SES. The operational indicators of resilience have, however, received little attention in the literature. To assess a system's resilience, one must specify which system configuration and which disturbances are of interest. This paper compares resilience properties in two contrasting SES, lake districts and rangelands, with respect to the following three general features: (a) The ability of an SES to stay in the domain of attraction is related to slowly changing variables, or slowly changing disturbance regimes, which control the boundaries of the domain of attraction or the frequency of events that could push the system across the boundaries. Examples are soil phosphorus content in lake districts woody vegetation cover in rangelands, and property rights systems that affect land use in both lake districts and rangelands. (b) The ability of an SES to self-organize is related to the extent to which reorganization is endogenous rather than forced by external drivers. Self-organization is enhanced by coevolved ecosystem components and the presence of social networks that facilitate innovative problem solving. (c) The adaptive capacity of an SES is related to the existence of mechanisms for the evolution of novelty or learning. Examples include biodiversity at multiple scales and the existence of institutions that facilitate experimentation, discovery, and innovation.
|
| [41] |
National housing and impervious surface scenarios for integrated climate impact assessments . |
| [42] |
An EcoCity model for regulating urban land cover structure and thermal environment: Taking Beijing as an example .https://doi.org/10.1007/s11430-016-9032-9 URL [本文引用: 1] 摘要
Urban land-use/cover changes and their effects on the eco-environment have long been an active research topic in the urbanization field. However, the characteristics of urban inner spatial heterogeneity and its quantitative relationship with thermal environment are still poorly understood, resulting in ineffective application in urban ecological planning and management. Through the integration of patial structure theory in urban geography and urface energy balance in urban climatology, we proposed a new concept of urban surface structure and thermal environment regulation to reveal the mechanism between urban spatial structure and surface thermal environment. We developed the EcoCity model for regulating urban land cover structure and thermal environment, and established the eco-regulation thresholds of urban surface thermal environments. Based on the comprehensive analysis of experimental observation, remotely sensed and meteorological data, we examined the spatial patterns of urban habitation, industrial, infrastructure service, and ecological spaces. We examined the impacts of internal land-cover components (e.g., urban impervious surfaces, greenness, and water) on surface radiation and heat flux. This research indicated that difference of thermal environments among urban functional areas is closely related to the proportions of the land-cover components. The highly dense impervious surface areas in commercial and residential zones significantly increased land surface temperature through increasing sensible heat flux, while greenness and water decrease land surface temperature through increasing latent heat flux. We also found that different functional zones due to various proportions of green spaces have various heat dissipation roles and ecological thresholds. Urban greening projects in highly dense impervious surfaces areas such as commercial, transportation, and residential zones are especially effective in promoting latent heat dissipation efficiency of vegetation, leading to strongly cooling effect of unit vegetation coverage. This research indicates that the EcoCity model provides the fundamentals to understand the coupled mechanism between urban land use structure and surface flux and the analysis of their spatiotemporal characteristics. This model provides a general computational model system for defining urban heat island mitigation, the greening ratio indexes, and their regulating thresholds for different functional zones.
|

/
| 〈 |
|
〉 |