张鲜鹤 , 王欣, 刘时银
ZHANG Xianhe, WANG Xin, LIU Shiyin
通讯作者:
收稿日期: 2016-11-17
修回日期: 2017-01-11
网络出版日期: 2017-03-15
版权声明: 2017 《地理学报》编辑部 本文是开放获取期刊文献,在以下情况下可以自由使用:学术研究、学术交流、科研教学等,但不允许用于商业目的.
基金资助:
作者简介:
作者简介:张鲜鹤(1989-), 河南郑州人, 研究方向为冰川水文与灾害。E-mail: xhzhang_hn@163.com
展开
摘要
主要基于第二次中国冰川编目数据,计算和分析中国西部各个山脉冰川面积随高度分布特征、冰川平衡线高度场的分布规律和积累区比率的分布特征。结果表明:① 各个山脉冰川面积随高度分布呈近似正态分布,冰川最大面积所占总面积的百分比与冰川分布高度差的比值可以作为描述冰川面积随高度分布的形状参数;② 平衡线高度的分布特征受气候和地形影响,由南向北逐渐降低,由东向西逐渐升高;西北和南部高大山脉边缘比较密集,青藏高原内部比较稀疏。③ 冰川积累区比率的分布特征与水汽、地形和物理冰川属性有关。各大山脉外侧和海洋型冰川区积累区比率较小(<0.5),山脉内侧及高原内陆地区和极大陆型冰川区的积累区比率较大(>0.7)。
关键词:
Abstract
According to the Second Chinese Glacier Inventory (SCGI), Distribution of Glacier at Different Altitudes (DGDA), the Equilibrium Line Altitude (ELA) field and the Accumulation Area Ratio (AAR) in different mountains of western China were calculated and discussed systematically. The results show that: (1) The DGDA presents a pattern of normal distribution, the ratio of the percentage that the largest glacier area accounted for the total area to altitude difference of the glacier distribution can be used as the morphological parameters to delineate the character of the DGDA. (2) The ELA, affected by climate and topography, gradually decreases from south to north, and increases from east to west. Additionally, the ELA of the northwest and southern edges of the high mountains is more intensive than that of the Qinghai-Tibet Plateau. (3) The distribution of the AAR is related to the water vapor and topography. The AAR of the mountain exterior side and marine type glacier region is lower than 0.5, while that of the mountain interior side, the Tibetan Plateau inland and maximal continental glacier region is higher than 0.7.
Keywords:
冰川高度结构是指特定地域内冰川的高度特征值及其随海拔高度的分布模式[1]。冰川高度结构特征指标主要包括冰川面积随海拔高度分布(Distribution of Glacier at Different Altitudes, DGDA)、冰川平衡线高度(Equilibrium Line Altitude, ELA)、冰川积累区比率(Accumulation Area Ratio, AAR)。各个高度带冰川分布特征、冰川规模大小、冰川发育特征、冰川水文特征是周围生存环境特征的综合反映[1]。ELA综合反映了一个地区气候、地形诸因素对冰川发育的影响,是冰川的气候—地貌指标,被称作冰川发育的枢纽[2-4];ELA在空间上的分布情况,即为冰川平衡线高度场,平衡线高度场可以直观地反映出平衡线的空间分布特征。AAR一般与气候(物质平衡水平)和冰川类型(冰川形态)关系密切,是冰川物理属性的重要参考指标之一。由于不同海拔的气候和地形等冰川的生存环境因素差异很大,造就了冰川面积随海拔分布的多样性。总之,位于不同海拔高度的冰川的结构特征,因其与局地环境长时间的耦合作用,成为不同海拔复杂环境状态及其变化的最为直接的表征参数。因此,研究冰川高度结构特征的各个指标为冰川变化的研究提供了重要的科学依据,具有重要的意义。
基于第一次中国冰川编目数据对冰川高度结构的研究已有很多成果。冰川学者提出了不同的经验公式来描述DGDA[1],并已先后成功应用于整个天山和西藏南部地区[1, 5],得到了近似正态分布的DGDA形态。近年来,研究者基于概率理论提出的统计学方法,其计算结果与实测值的总的差异程度较小[6-7]。目前已有的平衡线的确定方法大致分为直接测量法和间接估算法两类。直接测量法,又可分为传统方法和遥感法,如国内外学者利用航片、Landsat TM/ETM+和MODIS卫星等光学遥感影像和SAR影像提取出了冰川雪线的位置[8-15]。间接估算的方法应用比较广泛的就是赫斯法(Hess)和中值高度法。冰川学者根据中值高度和平衡线高度之间存在的线性关系[16],计算出了每条小冰川的平衡线值,进而确定了冰川系统平衡线高度平均值[1, 16-17]。也有学者认为冰川中值面积高度可以代替ELA[18-21]。第一次中国冰川编目根据Hess法量测了大约10%较大规模冰川的AAR值,对AAR值的研究发现年净物质平衡和AAR值之间存在良好的线性关系,冰川面积和AAR呈对数方程关系等[22-28]。总之,当前基于第一次冰川编目数据在DGDA、ELA和AAR的研究取得进展,而基于第二次冰川编目数据的中国冰川高度结构特征尚没有全面的认识。
中国西部自北向南依次发育有阿尔泰山、天山、喀喇昆仑山、昆仑山、念青唐古拉山、喜马拉雅山和横断山等14座山系,为冰川形成提供了广阔的积累空间和水热条件,成为中国西部冰川的集中分布区域。研究者基于第二次冰川编目数据,从山脉、流域、省份等角度分析21世纪初期中国冰川面积的分布现状[29-30],但是对于中国西部高度结构特征尚未进行全面描述。本文主要基于DGDA、ELA和AAR等指标,分析中国西部不同山脉冰川的高度结构特征,以求从海拔角度认识中国冰川分布状态。
本文数据主要有第一次中国冰川编目数据、第二次中国冰川编目数据和数字高程模型(Digital Elevation Model, DEM)等。第一次冰川编目数据主要是用冰川平衡线高度值和中值面积高度值来分析平衡线高度和中值面积高度间的关系。在第一次冰川编目数据中,共有5340条冰川数据有实测平衡线高度值,约占全国冰川条数的10%。第二次冰川编目数据(http://westdc.westgis.ac.cn)和数字高程模型(SRTMDEM,http://srtm.csi.cgiar.org,V4,分辨率3 arcsec),主要用来计算DGDA、ELA和AAR。本文涉及的主要方法包括DGDA、ELA和AAR的计算等。
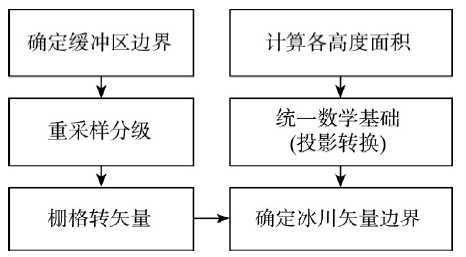
本文利用软件ArcGIS 10.0计算获取DGDA。首先用第二次冰川编目数据建立冰川边界缓冲区,裁剪SRTM;然后进行重采样分级,将重采样后的栅格数据转化为矢量数据,与冰川边界进行相交运算;最后进行投影转换,计算属性分带出来的面积(图1)。
图1 不同高度带内冰川面积计算流程
Fig.1 Flowchart of calculation process of glacier area in different altitude zones
假定冰川处于稳定状态时,冰川学者发现冰川平衡线高度和中值面积高度之间存在良好的线性关系[16, 18-19]。为了获得每条冰川的平衡线高度值,本文也尝试用中值面积高度来计算平衡线高度。即以四级流域为基础,将全国冰川划分为91个研究区,共拟合出91个冰川平衡线高度与中值面积高度(冰川面积占总面积50%所在的高度)线性方程。各流域冰川平衡线高度与其中值面积高度间的线性方程显著性水平都小于0.1,绝大多数(98%)小于0.01,说明冰川平衡线高度与其中值面积高度呈现显著的线性关系。另一方面,对于同一条冰川,可假定同一条冰川的冰川平衡线高度与中值面积高度是按照不变的线性关系变化。也就说,基于20世纪60年代以来完成的第一次冰川编目数据建立的不同流域冰川平衡线高度和中值面积高度的线性关系,仍然可适用于当前冰川。基于此,将第二次冰川编目中每一条冰川的中值面积高度值代入对应流域的线性方程中,计算当前每一条冰川的平衡线高度值。
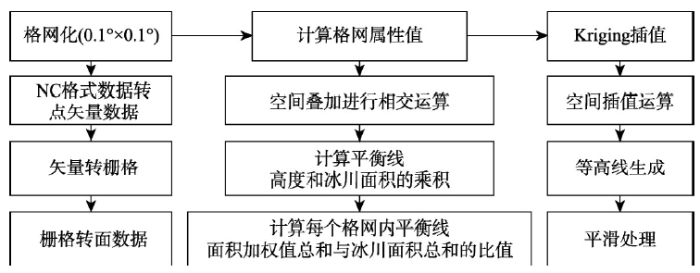
参照空间分辨率为0.1°×0.1°的中国区域高时空分辨率地面气象要素驱动数据集(http://westdc.westgis.ac.cn/)将中国西部冰川区按照0.1°×0.1°窗口进行网格化,其中有冰川分布的格网共4581个。按照面积加权方法计算每一个网格冰川平衡线高度的平均值,运用克里金(Kriging)空间插值方法获取中国西部冰川平衡线高度分布场(图2)。
图2 冰川平衡线高度场的绘制流程图
Fig.2 Flowchart of drawing glacier equilibrium line altitude field
积累区比率是假定冰川处于稳定状态时,冰川积累区的面积占据整个冰川面积的某个固定比例[1]。即:
式中:Sc为冰川积累区面积;S为冰川总面积。
依据AAR的定义,用每一条冰川平衡线高度、最高海拔高度和每50 m高度所对应的冰川面积数据,计算出积累区面积,与冰川的总面积的比值,即为该冰川AAR值。最后基于中国西部冰川区建立的0.1°×0.1°格网,按照冰川面积加权方法计算每一个网格冰川积累区比率的平均值。
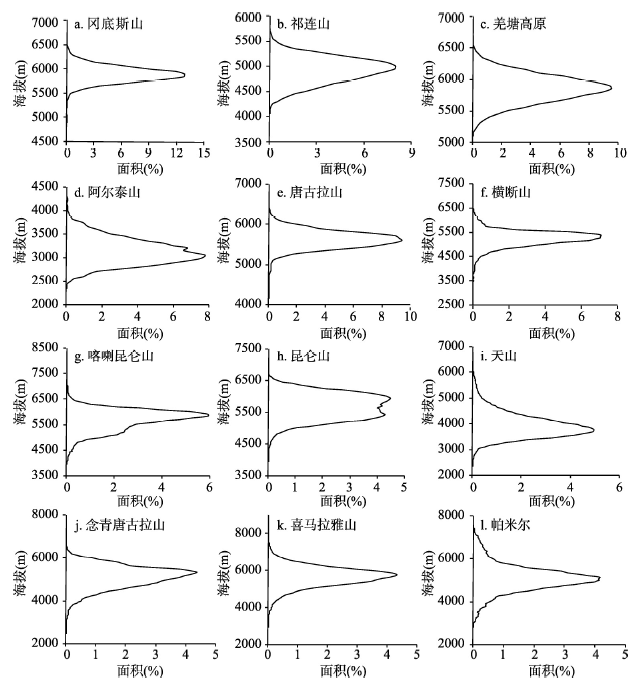
中国西部14座山脉的DGDA均呈近似的正态分布,但不同山脉表现出不同的形态。各个山脉DGDA的形态特征,可用形状参数来表示。形状参数定义为最大面积高度的冰川面积所占山脉总冰川面积的百分比与对应山脉冰川分布的高度差的比值。即:
式中:Sp为形状参数;P为最大面积高度的冰川面积所占山脉总冰川面积的百分比;∆H为对应山脉冰川分布的高度差,1000为高度差单位换算系数。由表1和图3可见,形状参数大(>0.05)的冰川,面积随高度分布呈现瘦高型,主要分布在冈底斯山、祁连山和羌塘高原等山脉;形状参数小(<0.01)的冰川,面积随高度分布呈现扁平型,主要分布在喀喇昆仑山、昆仑山、天山、念青唐古拉山、喜马拉雅山和帕米尔等山脉;形状参数在0.02~0.04之间的冰川,面积随高度分布形态介于瘦高和扁平之间,主要分布在阿尔泰山、唐古拉山和横断山等山脉。
图3 中国西部主要山脉不同海拔高度的冰川面积分布
Fig. 3 Area distribution of glacier at different altitudes in main mountains in western China
表1 各山脉冰川高度特征值统计
Tab.1 The statistics of glacier altitudes in different mountain ranges
| 山脉 | 面积(km2) | 平衡线高度(m) | 最低海拔(m) | 最高海拔(m) | 最大面积比值 | 冰川作用差(m) | 形状参数 |
|---|---|---|---|---|---|---|---|
| 阿尔泰山 | 187.75 | 2978 | 2363 | 4309 | 0.08 | 1946 | 0.04 |
| 天山 | 7179.77 | 4085 | 2640 | 7083 | 0.05 | 4443 | 0.01 |
| 冈底斯山 | 1296.33 | 5837 | 4901 | 7027 | 0.13 | 2126 | 0.06 |
| 横断山 | 1395.06 | 5132 | 2979 | 7143 | 0.07 | 4164 | 0.02 |
| 喀喇昆仑山 | 5988.67 | 5598 | 3973 | 8532 | 0.06 | 4559 | 0.01 |
| 昆仑山 | 11819.2 | 5582 | 3955 | 7130 | 0.04 | 3175 | 0.01 |
| 念青唐古拉山 | 9559.2 | 5004 | 2459 | 7092 | 0.04 | 4633 | 0.01 |
| 帕米尔 | 2159.62 | 4895 | 2818 | 7575 | 0.04 | 4757 | 0.01 |
| 祁连山 | 1597.81 | 4820 | 4018 | 5765 | 0.08 | 1747 | 0.05 |
| 羌塘高原 | 1917.74 | 5799 | 5134 | 6748 | 0.10 | 1614 | 0.06 |
| 唐古拉山 | 1843.91 | 5574 | 4190 | 6572 | 0.09 | 2382 | 0.04 |
| 喜马拉雅山 | 6820.98 | 5527 | 2945 | 8798 | 0.04 | 5853 | 0.01 |
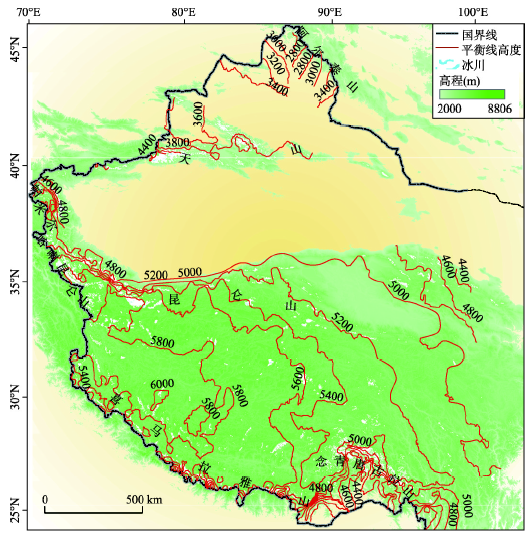
中国冰川平衡线高度分布场如图4所示,中国西部ELA分布的总趋势是南高北低,西高东低。北部的阿尔泰山平衡线高度值较小,高度值介于2600~3400 m之间,平均在2800 m左右,向南逐渐增大,至喜马拉雅山北坡平衡线高度值增大到5800 m左右;西北部的喀喇昆仑山等山脉平衡线高度值较高,在5500 m左右,向东逐渐减小,祁连山减小到4400 m左右。羌塘高原是中国ELA分布的高值区,最高可达6000 m以上,在东南方向,由高原向藏东南减少到4400 m;在西北方向,由高原向帕米尔、天山减少到4000 m左右;在东北方向,由高原向祁连山减少到4200 m左右;在西南方向,由高原向喜马拉雅山减少到5000 m左右。
图4 中国西部冰川平衡线高度分布场
Fig.4 Glacier equilibrium line altitude field in western China
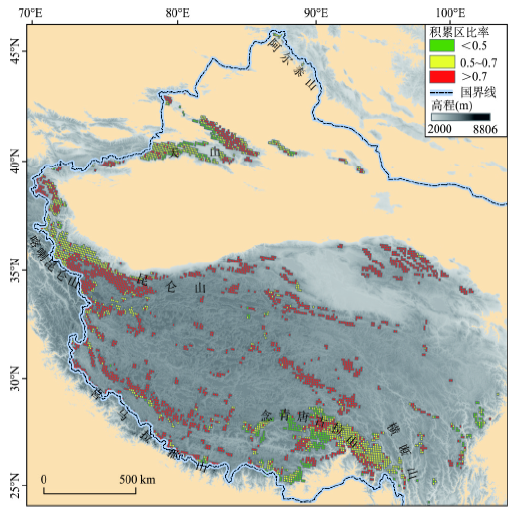
由基于计算的全国所有冰川的AAR值绘制的中国冰川AAR值分布图(图5)可见,中国西部绝大部分冰川区的格网的AAR值都在0.5以上,占总数的91%,其中AAR值>0.7的格网占70%;0.5~0.7的占30%,而AAR值<0.5的格网仅占总数的9%。从AAR的空间分布上来看,最大的青藏高原内陆地区,AAR值都在0.7以上;其次是阿尔泰山、西天山、喀喇昆仑山和昆仑山西段,以及横断山西部和念青唐古拉山东段等山脉,AAR值在0.5~0.7之间;最小的是天山伊犁河谷地区、喜马拉雅山东段、念青唐古拉山西段和横断山东部等山脉,AAR值都在0.5以下。
图5 中国西部冰川积累区比率值分布图
Fig.5 The distribution of the accumulation area ratio in western China
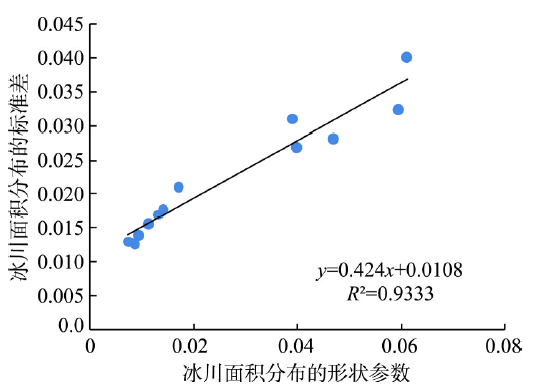
正态分布中的参数标准差能够描述数据分布的离散程度。如不同山脉DGDA无限接近于正态分布,则其标准差能够反映冰川在各个高度带的面积分布(大小)情况,即DGDA的形态特征。因此,山脉DGDA的标准差能在多大程度上指示DGDA的形态与该山脉DGDA在多大程度上接近正态分布对应,在没有确定DGDA是否达到统计意义上的正态分布状态时,需要寻找统计量来描述DGDA的形态。分析发现,本文定义的DGDA形状参数统计量Sp与DGDA的标准差存在显著相关性,显著性水平小于0.01(图6),这说明DGDA的形状接近正态分布,且对于在不同海拔高度上接近正态分布的冰川,形状参数统计量Sp可以定量描述各个山脉间DGDA特征及其差异性。
图6 冰川面积随高度分布的形状参数和标准差的线性关系图
Fig.6 The linear relationship between the shape parameter and the standard deviation of the distribution of glacier at different altitudes
不同山脉DGDA的特征反映山脉各个高度带的地形和气候特征。换言之,地形和气候共同造就了DGDA的差异性。对比各个山脉,DGDA均呈现近似正态分布的特征,即在某一个高度带出现峰值,说明该高度带的气候或者地形最适合冰川的生存和发育。而各个山脉DGDA差异性又比较明显,峰值出现的高度不同,且冰川延展高度范围也不同,进而表现出不同的形态特征。冈底斯山、羌塘高原等冰川类型都属于极大陆型冰川[31],降水稀少,冰川赖以生存的物质条件相对缺乏冰川延展范围较小,且冰川只能在较高的海拔范围内生存,所以形状参数最大(Sp = 0.06),冰川面积分布特征呈现瘦高型,冰川分布相对集中。念青唐古拉山、喜马拉雅山和帕米尔等山脉海拔较高,纬度相对较低,地形复杂(具备为冰川发育提供物质积累的地形基础),冰川类型多样[31],加之降水相对较多,保障了冰川向较低海拔延伸,因此形状参数最小(Sp = 0.01),冰川面积分布特征呈现扁平型,冰川分布相对分散。总之,地形条件、水分和热量等共同决定了不同海拔高度冰川发育数量、规模分布格局。
中国西部冰川区主要受西风环流、西南季风、东南季风以及南亚季风等的影响,各个地区降水和温度差异性明显。西风环流影响区域主要有阿尔泰山、天山、帕米尔、喀喇昆仑山以及昆仑山西段;西南季风和东南季风主要影响喜马拉雅山、念青唐古拉山、横断山等南部地区[32]。这些地区山脉外侧降水丰富,有利于冰川发育。青藏高原地区不仅在高原地区形成了相对独立的气候系统,还对东亚乃至全球的大气环流和气候产生很大影响。冬半年高原位于西风带中,高原上干冷多风;夏半年高原位于副热带高压带中,高原上降水较多[33]。
由于受气候影响的程度和范围不同,中国西部ELA的分布差异性明显。伊犁河流域、阿尔泰山、帕米尔、喀喇昆仑山喜马拉雅山、念青唐古拉山和横断山等地区受西风和季风影响[32],山脉外侧降水相对较多,ELA较低,又因高大山体的遮挡作用,影响水汽的输出,造成了背风坡降水较少,山脉内侧ELA较高,在青藏高原内部,尤其ELA明显偏高。此外,地形也是影响平衡线分布重要因素。阿尔泰山ELA分布与山脉西北东南走向一致,横断山受南北纵贯高山—峡谷地貌形成“阻隔—通道”作用的影响[34],ELA表现出明显的沿纬线方向间断式差异和经线方向连续式延伸的分布特征,昆仑山、念青唐古拉山和喜马拉雅山等山脉ELA呈现的以山峰为中心的多个峰值区,以及ELA分布密集程度和变化梯度表现出的空间差异性等,都是地形影响平衡线分布的结果。
综上所述,中国西部冰川ELA分布特征除受地势和山地绝对和相对海拔的影响,还表现出由帕米尔高原—兴都库什山脉—青藏高原高大地势所诱导的南亚季风、东亚季风、西风、西北利亚寒潮等多时空尺度环流的影响,两者共同作用造就了冰川ELA分布特征时空差异性。
然而,资料显示2006-2007年祁连山七一冰川平衡线高度观测值为4855 m[35],而计算值为4659 m,相差196 m,表明计算值和观测值存在误差。这表明尽管理论上根据中值面积高度计算ELA是可行的,但由于ELA的影响因素复杂、第一次冰川编目中值面积高度值和ELA存在误差等原因,使得通过拟合的线性关系计算的ELA和实测结果存在较大误差,进而影响AAR值的可靠性。本文侧重对ELA、AAR的空间分布趋势的研究,单条冰川计算引起的误差影响有限,但今后仍需加强对冰川ELA的观测,优化ELA的计算方法,以提高对冰川高度结构特征描述的准确性。
中国西部冰川类型多样,根据气候条件和冰川物理属性,可划分为海洋型冰川、亚大陆型和极大陆型冰川3大类[36]。海洋型冰川主要分布于横断山区、喜马拉雅山东段和念青唐古拉山的中东段等,降水丰沛,冰川区年降水量达1000~3000 mm,ELA较低,对气候变暖极为敏感;亚大陆型冰川主要分布于天山、昆仑山东段以及喀喇昆仑山北坡中国境内等,冰川区年降水500~1000 mm;极大陆型分布于青藏高原的西部,包括西昆仑山、羌塘高原、帕米尔东部、唐古拉山西部、祁连山西部和冈底斯山西段,冰川区年降水量200~500 mm[31]。
冰川积累区比率的大小与冰川类型及其补给条件密切相关,而中国西部冰川类型多样性和水汽来源复杂性决定了AAR分布的空间差异性。如天山主要受西风环流影响,伊犁河流域地形又呈喇叭状向西敞开,水汽较容易进入,加上托木尔峰等高大山体的拦截作用,在山区形成降水,丰富的降水使得冰川补给作用增强,导致伊犁河谷地区AAR值相对较低(<0.5);喜马拉雅山东段和念青唐古拉山西段临近雅鲁藏布江大峡谷,为南亚季风进入高原内部的最大水汽通道[37-38],降水相对较多,冰川发育多为海洋型冰川[31],因此,AAR值偏低(<0.5);横断山东部因纵向领谷区的山脉表现较好的阻隔—通道效应,降水由东向西逐渐减小,水汽由南向北输送,致使AAR值东西差异较大(东部偏低<0.5,西部在0.5~0.7之间),南北差异小。羌塘高原、冈底斯山、祁连山、昆仑山、帕米尔等属于大陆型冰川[31],受季风影响不明显,降水较少,AAR值较大(>0.7),其中由于西风水汽翻越喀喇昆仑山和局地环流等因素的影响[38],在喀喇昆仑山、西昆仑山外缘等地AAR值也在0.5~0.7之间。总之,冰川发育类型、降水和地形等条件共同决定了AAR值的分布特征。
DGDA、ELA和AAR都是从海拔角度指示冰川的分布状态,冰川的DGDA和ELA分布决定了AAR的分布,三者共同构成了冰川的高度结构特征。本文主要基于第二次冰川编目数据,分析中国西部冰川高度结构特征,得出如下主要结论:
(1)不同山脉DGDA呈近似正态分布的特征,用冰川最大面积高度所占总面积的百分比与冰川分布的高度差的比值Sp作为冰川的形状参数,Sp值越大,冰川面积分布曲线越瘦高,冰川分布越集中;Sp越小,曲线越扁平,冰川分布越分散。冈底斯山和羌塘高原等形状参数最大(Sp = 0.06),面积随高度分布呈现瘦高型;帕米尔、喜马拉雅山和念青唐古拉山等形状参数最小(Sp = 0.01),面积随高度分布呈现扁平型。
(2)冰川ELA的分布特征主要受气候和地形综合作用的影响,表现出明显的时空差异性,呈现南高北低,西高东低的趋势。高大山脉边缘ELA分布比较密集,变化较快;青藏高原相对比较稀疏,平衡线高度变化平缓;昆仑山、念青唐古拉山、喜马拉雅山等山脉则呈现以山脉主峰为中心的同心圆状分布,由山脉外缘向内部升高;横断山则地形影响,ELA表现出明显的沿纬线方向间断式差异和经线方向连续式延伸的分布特征。
(3)冰川积累区比率的大小与冰川类型及其补给条件密切相关,而中国西部冰川类型多样性和水汽来源复杂性决定了AAR分布的空间差异性。各大山脉外侧和海洋型冰川区AAR值偏低(<0.5),各大山脉内侧和极大陆型冰川区的AAR值偏高(>0.7)。
致谢:感谢郭万钦副研究员提供数据方面的支持;感谢梁继博士提供技术上的支持。
The authors have declared that no competing interests exist.
| [1] |
本书共分10章,包括冰的基本物理性质、成冰作用、冰川的物质平衡等,涉及冰川学的主要方面,吸收国内外冰川学的精华。
本书共分10章,包括冰的基本物理性质、成冰作用、冰川的物质平衡等,涉及冰川学的主要方面,吸收国内外冰川学的精华。
|
| [2] |
Glacier resources and their distributive characteristics in China: A review on Chinese Glacier Inventory .
依据国际冰川编目规范完成的中国冰川目录11卷21册的统计,中国境内共发育冰川46298条,总面积59406km<sup>2</sup>,冰储量约5590km<sup>3</sup>,是中低纬度山地冰川最发育的国家.按山系和水系两种体系分别进行冰川编目,获得了中国西部及其各区域的冰川条数、面积和储量等多项指标的确切数量,发现了中国冰川及其雪线分布的若干新特征,这对于西部山区水资源的开发利用和冰雪灾害的防治等具有重要的科学意义和实用价值.
中国冰川资源及其分布特征: 中国冰川目录编制完成 .
依据国际冰川编目规范完成的中国冰川目录11卷21册的统计,中国境内共发育冰川46298条,总面积59406km<sup>2</sup>,冰储量约5590km<sup>3</sup>,是中低纬度山地冰川最发育的国家.按山系和水系两种体系分别进行冰川编目,获得了中国西部及其各区域的冰川条数、面积和储量等多项指标的确切数量,发现了中国冰川及其雪线分布的若干新特征,这对于西部山区水资源的开发利用和冰雪灾害的防治等具有重要的科学意义和实用价值.
|
| [3] |
Modelling topoclimatic controls on palaeoglacis: Implications for inferring palaeoclimate from geomorphic evidence .https://doi.org/10.1016/j.quascirev.2008.10.016 URL 摘要
Evidence of small glaciers is often used to infer past atmospheric climate through calculation of steady-state ELAs. However, if topographic niches such as shading or windblown-snow augmented mass-balance then ELAs cannot reflect regional climate and determining the significance of these topoclimates is therefore important. The Brecon Beacons, South Wales, contains upland glacial landforms dating to the Younger Dryas (11,000-10,000 yr BP) when local climate was at the threshold for glaciation. This case study categorises topoclimate using three-dimensional modelling of topography and reconstructed palaeoglaciers from two sites containing mapped moraines whose orientation suggest complex patterns of deglaciation. Ablation season solar radiation is modelled over multiple ice-surfaces as shade from surrounding topography and intensity from ice-surface incidence angle. Snowblow and avalanching potential models are also used and the significance of all topoclimate variables assessed against a mass-balance deficit calculated for each glacier given palaeoclimate models for the region. Results demonstrate that both glaciers were likely to be heavily reliant on topoclimate and that previous studies underestimate the significance of solar radiation. Modelled over multiple ice-surfaces reflecting patterns of recession, results indicate that the distribution of topoclimate variables predicts the style of deglaciation at both sites, possibly explaining the complexity of glacial evidence in this environment.
|
| [4] |
Glacier changes in the Tien Shan as determined from topographic and remotely sensed data .https://doi.org/10.1016/j.gloplacha.2006.07.016 URL [本文引用: 1] 摘要
The total reduction of the Tien Shan glacier is 14.2% during the last 60yr. The northern and central Tien Shan have not experienced a significant increase of precipitation during the last 100yr, but they have experienced an increase in summer air temperatures, especially observable since the 1970s, which caused an acceleration of the Tien Shan glaciers recession.
|
| [5] |
Modeling the variation of glacier system: Taking the southern Tibet region as an example .
以西藏南部外流水系冰川系统结构为基础,应用冰川消融与夏季气温的关系、冰川径流变化规律、平衡线的代表性特征及其上升的降温效应,提出冰川系统变化的功能模型.结果表明:在持续升温的情景下,海洋型冰川对径流变化响应迅速,且退缩快、寿命短,而增流率不大,增流期短,在本世纪内径流将全面衰减;大陆型冰川对径流变化响应迟钝,且退缩慢、寿命长,而增流率大,增流期长,下世纪以后径流才将衰退;规模大及高差大的冰川比规模小及高差小的冰川退缩慢,寿命长,而增流率大,增流期长。
冰川系统变化的模型研究: 以西藏南部外流水系为例 .
以西藏南部外流水系冰川系统结构为基础,应用冰川消融与夏季气温的关系、冰川径流变化规律、平衡线的代表性特征及其上升的降温效应,提出冰川系统变化的功能模型.结果表明:在持续升温的情景下,海洋型冰川对径流变化响应迅速,且退缩快、寿命短,而增流率不大,增流期短,在本世纪内径流将全面衰减;大陆型冰川对径流变化响应迟钝,且退缩慢、寿命长,而增流率大,增流期长,下世纪以后径流才将衰退;规模大及高差大的冰川比规模小及高差小的冰川退缩慢,寿命长,而增流率大,增流期长。
|
| [6] |
Research on the calculation of altitude structure of a glacier system: Taking the Tarim Basin as an example .
冰川面积随高度的分布(即高度结构)具有重要的水文学及冰川学意义.在分析中低纬冰川作用区(冰川系统)特征的基础上,着眼于特定冰川系统的全体,依托概率理论,提出计算冰川系统高度结构的统计学公式.与普遍使用的经验公式相比,它具有计算所需参数少,结果不存在系统误差的特点,并且二者计算结果的总差异程度在0.1~0.3之间.用内天山的实测资料验证显示,统计学公式计算的结果与实测值的总的差异程度仅为0.045.
冰川系统高度结构计算研究: 以塔里木盆地水系冰川为例 .
冰川面积随高度的分布(即高度结构)具有重要的水文学及冰川学意义.在分析中低纬冰川作用区(冰川系统)特征的基础上,着眼于特定冰川系统的全体,依托概率理论,提出计算冰川系统高度结构的统计学公式.与普遍使用的经验公式相比,它具有计算所需参数少,结果不存在系统误差的特点,并且二者计算结果的总差异程度在0.1~0.3之间.用内天山的实测资料验证显示,统计学公式计算的结果与实测值的总的差异程度仅为0.045.
|
| [7] |
Study of the elevation-dependent glacierized area in China .https://doi.org/10.7522/j.issn.1000-0240.2014.0063 Magsci [本文引用: 1] 摘要
冰川面积随高程分布规律是冰川系统结构研究中的重要内容. 根据中国第一次冰川编目数据集,将全国冰川划分为27个研究区域,基于SRTM-DEM数据,分别提取了各研究区分段高程所占面积,分析了冰川面积随高程的变化. 结果表明:各研究区冰川面积都随高程呈偏态分布. 依据统计理论,建立了冰川面积随高程分布的二阶高斯分布偏态回归模型,回归模型决定系数均大于0.97,相对误差较小. 根据偏态回归模型,计算出了冰川系统高度特征值,并分析了冰川面积分布的区域性差异. 该模型一方面可以表达冰川面积在中间高程的集中程度;另一方面可以描述冰川面积在两侧分布的差异性,并可以用来分析未来冰川的变化. 偏态分布模型能很好地描述中国冰川面积随高程分布规律,为冰川系统结构的研究和冰川区域分布差异提供参考.
中国冰川面积随高程分布规律研究 .https://doi.org/10.7522/j.issn.1000-0240.2014.0063 Magsci [本文引用: 1] 摘要
冰川面积随高程分布规律是冰川系统结构研究中的重要内容. 根据中国第一次冰川编目数据集,将全国冰川划分为27个研究区域,基于SRTM-DEM数据,分别提取了各研究区分段高程所占面积,分析了冰川面积随高程的变化. 结果表明:各研究区冰川面积都随高程呈偏态分布. 依据统计理论,建立了冰川面积随高程分布的二阶高斯分布偏态回归模型,回归模型决定系数均大于0.97,相对误差较小. 根据偏态回归模型,计算出了冰川系统高度特征值,并分析了冰川面积分布的区域性差异. 该模型一方面可以表达冰川面积在中间高程的集中程度;另一方面可以描述冰川面积在两侧分布的差异性,并可以用来分析未来冰川的变化. 偏态分布模型能很好地描述中国冰川面积随高程分布规律,为冰川系统结构的研究和冰川区域分布差异提供参考.
|
| [8] |
Classification and snow line detection for glacial areas using the polarimetric SAR image .https://doi.org/10.1016/j.rse.2011.03.004 Magsci [本文引用: 1] 摘要
Snow cover and glaciers are sensitive indicators of the environment. The vast spatial coverage of remote sensing data, coupled with the tough conditions in areas of interest has made remote sensing a particularly useful tool in the field of glaciology. Compared to optical images, synthetic aperture radar (SAR) data are hardly influenced by clouds. This is important because glacial areas are usually under cloud cover. The Dongkemadi glacier in the Qinghai-Tibetan plateau was selected as the study area for this paper. We use polarimetric SAR (PolSAR) image for classification on and around the glacier. The contrast between ice and wet snow is remarkable, but it is difficult to distinguish the ice from the ground on SAR images due to similar backscatter characteristics in former research. In our study, we found that this distinction can be achieved by target decomposition. Support Vector Machines (SVMs) are performed to classify the glacier areas using the selected features. The glacial areas are classified into six parts: wet snow, ice, river outwash, soil land, rocky land and others. The PolSAR-Target decomposition-SVMs (PTS) method is proven to be efficient, with an overall classification accuracy of 91.1% and a kappa coefficient of 0.875. Moreover, 86.63% of the bare ice and 96.76% of the wet snow are correctly classified. The classification map acquired using the PTS method also helps to determine the snow line, which is an important concept in glaciology. (C) 2011 Elsevier Inc. All rights reserved.
|
| [9] |
Mass changes of Southern and Northern Inylchek Glacier, Central Tian Shan, Kyrgyzstan, during ~1975 and 2007 derived fromremote sensing data .https://doi.org/10.5194/tc-9-703-2015 URL 摘要
Abstract Glacier melt is an essential source of freshwater for the arid regions surrounding the Tian Shan. However , the knowledge about glacier volume and mass changes over the last decades is limited. In the present study, glacier area, glacier dynamics and mass changes are investigated for the period 65 1975–2007 for Southern Inylchek Glacier (SIG) and Northern Inylchek Glacier (NIG), the largest glacier system in Central Tian Shan separated by the regularly draining Lake Merzbacher. The area of NIG increased by 2.0 ± 0.1 km 2 (65 1.3 %) in the period 65 1975– 2007. In contrast, SIG has shrunk continuously in all investigated periods since 65 1975. Velocities of SIG in the central part of the ablation region reached 65 100–120 m a 611 in 2002/2003, which was slightly higher than the average velocity in 2010/2011. The central part of SIG flows mainly towards Lake Merzbacher rather than towards its terminus. The measured velocities at the distal part of the terminus downstream of Lake Merzbacher were below the uncertainty, indicating very low flow with even stagnant parts. Geodetic glacier mass balances have been calculated using multi-temporal digital elevation models from KH-9 Hexagon (representing the year 1975), SRTM3 (1999), ALOS PRISM (2006) and SPOT-5 high-resolution geometrical (HRG) data (2007). In general, a continuous mass loss for both SIG and NIG could be observed between 65 1975 and 2007. SIG lost mass at a rate of 0.43 ± 0.10 m w.e. a 611 and NIG at a rate of 0.25 ± 0.10 m w.e. a 611 within the period 65 1975–1999. For the period 1999–2007, the highest mass loss of 0.57 ± 0.46 m w.e. a 611 was found for NIG, whilst SIG showed a potential moderate mass loss of 0.28 ± 0.46 m w.e. a 611. Both glaciers showed a small retreat during this period. Between 65 1975 and 1999, we identified a thickening at the front of NIG with a maximum surface elevation increase of about 150 m as a consequence of a surge event. In contrast significant thinning (> 0.5 m a 611) and comparatively high velocities close to the dam of Lake Merzbacher were observed for SIG, indicating that Lake Merzbacher enhances glacier mass loss.
|
| [10] |
MODIS derived equilibrium line altitude estimates for Purogangri ice cap, Tibetan Plateau, and their relation to climatic predictor (2001-2012). Geografiska Annaler: Series A, https://doi.org/10.1111/geoa.12102 URL 摘要
ABSTRACT The variation of the equilibrium line altitude can be used as an indicator for glacier mass balance variability. Snow lines at the end of the ablation period are suitable proxies for the annual equilibrium line altitude on glaciers. We investigate snow lines at Purogangri ice cap on the central Plateau in order to study the interannual variability of glacier mass balance. Datasets of the daily Moderate Resolution Imaging Spectroradiometer snow product MOD10A1 were used to infer transient snow line variability during 2001-2012 and to derive regional-scale, annual equilibrium line altitude. The Moderate Resolution Imaging Spectroradiometer snow albedo embedded within the snow product was compared with high-resolution Landsat imagery. An albedo threshold was established to differentiate between ice and snow and the 13th percentile of the altitudes of snow-covered pixels was chosen to represent the snow line altitude. The second maximum of the snow line altitudes in the ablation period was taken as a proxy for the annual equilibrium line altitude. A linear correlation analysis was carried out (1) between interannual variability of the equilibrium line altitude at Purogangri ice cap and various climate elements derived from the High Asia Reanalysis, and (2) between interannual variability of the equilibrium line altitude and the circulation indices North Atlantic Oscillation and Indian Summer Monsoon. Results suggest that air temperature and meridional wind speed above ground in July, as well as the lower tropospheric zonal wind in June and August play a crucial role in the development of the annual equilibrium line altitude.
|
| [11] |
Rapid decrease of mass balance observed in the Xiao (Lesser) Dongkemadi Glacier, in the central Tibetan Plateau .https://doi.org/10.1002/hyp.6865 URL 摘要
The mass balance of the Xiao (Lesser) Dongkemadi Glacier located in the Tanggula Mountains, of the central Qinghai-Tibetan Plateau has been monitored since 1989. The results show that the mass balance of the glacier has recently shown a deficit trend, and that the glacial terminus was also retreating. Positive mass balance of the glacier was dominant during the period 1989-1993, and the accumulated mass balance reached 970 mm. However, negative mass balance of the glacier has occurred since 1994, except for the large positive mass balance year 1997. The mass balance was - 701 mm in 1998, an extremely negative glacier mass balance year. The equilibrium line altitude showed a significant increasing trend. The mass balance of the glacier has changed from a significantly positive mass balance to a strongly negative mass balance since 1994. Meteorological data suggest that the rapid decrease in the mass balance is related to summer season warming. Copyright 2007 John Wiley & Sons, Ltd.
|
| [12] |
Temporal and spatial changes in Western Himalayan firn line altitudes from 1998 to 2009 .https://doi.org/10.1016/j.gloplacha.2014.03.012 URL Magsci 摘要
Understanding changes in glacier mass balance is important because it is indicative of changes in climate and the hydrologic cycle. The latter also has particular influence on people living near glaciers and/or glacier-fed rivers. The Western Himalayas remain one of the regions where recent changes in glacier mass balance are not well-known. The temporal and spatial changes in firn line altitudes are an indicator of equilibrium line altitudes and thus reflect changes in glacier mass balance. Here, we use Himalayan Landsat TM/ETM+ data in July and August (the late summer melt season) to quantify changes in firn line altitudes from 1998 to 2009. We produced reflectance maps through radiometric calibration and atmospheric correction and use topographic correction to remove or reduce terrain or shadow effects. The real 'surface albedo' is obtained by narrowband-to-broadband (NTB) albedo conversion from the combined solar radiation. The firn line altitude was then extracted by combining the 'surface albedo' with pre-registered digital elevation model. The individual firn line altitude varies by region. The Western Himalayas display the largest range of firn line variability, where the firn line altitudes vary from 4840 m a.s.l. to 5770 m a.s.l. The individual glacier mean firn line altitude from 1998 to 2009 rose from 5072 +/- 77 m a.s.l. to 5640 +/- 74 m a.s.l. in the Western Himalayas. The mean firn line altitude increased from 1998 to 2009. The lowest mean recorded firn line altitude recorded was 5237 +/- 166 m a.s.l. in 1998, whereas the highest was 5397 +/- 135 m a.s.l. in 2000. We also observed a difference between the changes in fine line altitudes of northern and southern slopes of the western Himalayans, as the northern slope glaciers display a greater increase in firn line altitudes than the southern slope glaciers. In the southern slope, changes in firn line altitudes correlate with NCDC-NOAA temperature and precipitation data. This sustained increase of firn line altitudes and associated loss of glacier mass imply a persistent loss of stored freshwater in the Western Himalaya. (C) 2014 Elsevier B.V. All rights reserved.
|
| [13] |
Exploitation of Landsat data for snow zonation mapping in the Hindukush, Karakoram and Himalaya (HKH) region of Pakistan .https://doi.org/10.1080/02626667.2013.799774 URL 摘要
ABSTRACT In the Hindukush, Karakoram and Himalaya (HKH) region of Pakistan, many glaciological variables are still not known due to the remoteness and harsh weather conditions of the area. A remote sensing technique is therefore applied to map the snow zonation in the HKH region. Landsat 7 ETM+ data for the year 2003 are used in this study. Image classification and image processing techniques are applied to map, for the first time, the major snow zones in the HKH region. Six classes are identified: the results show that the area covered by the highest-altitude snow (Snow I), lower-altitude snow (Snow II), bare ice, debris-covered ice, wet snow and shadow is 21 529.42, 22 472.58, 8696.41, 8038.75, 12 159.37 and 7322.30 km2, respectively. The study also indicates that the equilibrium line altitude (ELA) lies between 5000 and 5500 m above sea level, with an accumulation area ratio (AAR) of 0.60.
|
| [14] |
Monitoring glacier zones and snow/firn line changes in the Qinghai-Tibetan Plateau using C-band SAR imagery .https://doi.org/10.1016/j.rse.2013.05.016 URL Magsci 摘要
Small glaciers and ice caps in mountainous areas are often sensitive indicators of local and global climate change. In this paper, typical continental glaciers, the Dongkemadi and its neighbouring glaciers in the central area of the Qinghai-Tibetan Plateau, are monitored using multi-sensor C-band synthetic aperture radar (SAR) imagery. The study includes analysis of the alternating processes of ablation and freezing, the glacier zones detected on SAR images, and the changing snow/firn line across different days, seasons, and years. Experiments show that in late summer the wet snow-/firn-ice boundary, which is termed the late summer wet snow/firn line (WSFL) is easily detected on SAR images and it is relatively stable over multiple days. Also, the detected late summer WSFL, and the recorded yearly equilibrium line which reflects glacier mass balance, are close in a positive mass balance year, but the detected late summer WSFL is lower than the equilibrium line in a negative mass balance year. By combining pit and SAR observations it was found that the firn can be divided into two parts on the glaciers; the thick firn that lies in the neve basin is distinct on SAR images in winter, but the fins surrounding the basin with thickness ranging from 0 to 20 cm is difficult to recognize. The thick firn line (the lower boundary of neve basin) is stable in observations eight years apart. Based on the C-band VV polarization SAR image experiments, field work, and existing records, the spatiotemporal backscatter signature specific to the typical continental glacier is identified. The spatiotemporal backscatter signature helps to understand mass balance proxies and surface melt patterns of the glaciers in SAR images. (c) 2013 Elsevier Inc. All rights reserved.
|
| [15] |
Comparison of modelled-and remote sensing-derived daily snow line altitudes at Ulugh Muztagh, northern Tibetan Plateau .https://doi.org/10.1007/s11629-015-3818-x URL [本文引用: 1] 摘要
The ice cap Ulugh Muztagh in the central Kunlun Shan at the northern fringe of the Tibetan Plateau is a very isolated region with arid cold conditions. No observational, meteorological or glaciological ground truth data is available. Using the Moderate-resolution Imaging Spectroradiometer(MODIS) Level 1 radiance Swath Data(MOD02QKM) with a spatial resolution of 250 m, transient snow lines during the months of July to September in 2001 to 2014 are derived. Results are used to calibrate the physical based Coupled Snowpack and Ice surface energy and Mass balance model(COSIMA). The model runs on a representative detail region of Ulugh Muztagh(UM) on a digital elevation model with the same spatial resolution as the MODIS bands. In the absence of field observations, the model is driven solely by dynamically downscaled global analysis data from the High Asia Refined analysis(HAR). We compare remote sensing derived and modelled mean regional transient snow line altitudes in the course of consecutive summer seasons in 2008 to 2010. The resulting snow line altitude(SLA) and annual equilibrium line altitude(ELA) proxy of both methods coincide very well in their interannual variability in accordance with interannual variability of climatic conditions. Since SLAs of both methods do notconsistently agree on a daily basis a usage of remote sensing derived SLAs for model calibration in the absence of field observation data is only limitedly feasible for daily analysis. ELA approximation using the highest SLA at the end of ablation period may not be applied to UM because the negative winter mass balance(MB) is not reflected in the summer SLA. The study reveals moderate negative MB for UM throughout the modelling period. The mean regional MB of UM accounts for-523卤410 mm w.e. a-1 in the modelling period. Hence UM seems not to belong to the area of the arakorum anomaly' comprising a region of positive mass balances in recent years which has its centre presumably in the Western Kunlun Shan.
|
| [16] |
Mass balance at the steady state equilibrium line altitude and its application .
论证了在稳定状态时的冰川平衡线即零平衡线(<i>ELA</i><sub>0</sub>)处的比净平衡大致等于整个冰川的平均净平衡。提出了<i>ELA</i><sub>0</sub>的直接测定方法、误差范围以及利用冰川中值高度计算<i>ELA</i><sub>0</sub>的公式。认为可以利用<i>ELA</i><sub>0</sub>的特征简化冰川物质平衡的观测及计算,以及利用冰川编目资料大面积估算冰川物质平衡状况的可能性。
冰川零平衡线处的物质平衡及其应用 .
论证了在稳定状态时的冰川平衡线即零平衡线(<i>ELA</i><sub>0</sub>)处的比净平衡大致等于整个冰川的平均净平衡。提出了<i>ELA</i><sub>0</sub>的直接测定方法、误差范围以及利用冰川中值高度计算<i>ELA</i><sub>0</sub>的公式。认为可以利用<i>ELA</i><sub>0</sub>的特征简化冰川物质平衡的观测及计算,以及利用冰川编目资料大面积估算冰川物质平衡状况的可能性。
|
| [17] |
The calculated ELA and its distribution characteristics of the glacier system in the Tarim River Basin .
根据<i>ELA</i><sub>h</sub>与<i>H</i><sub>me</sub>之间存在较好的线性关系, 计算了塔里木河全流域冰川系统所有冰川的平衡线高度<i>ELA</i><sub>hc</sub>. 在此基础上分析流域平衡线分布特征, 探讨极限面积(<i>S</i><sub>lim</sub>)与导出雪线(<i>H</i><sub>cli</sub>)等参数同冰川系统的关系. 结果表明: 冰川系统中, 当冰川规模不低于某极限面积时, 其平衡线高度会趋近到导出雪线高度. 整个流域导出雪线高度分布受热量条件控制, 呈现纬度地带性, 又由于东西水分条件的差异, 经度地带性也较明显.
塔里木河流域冰川系统平衡线的计算及其分布特征 .
根据<i>ELA</i><sub>h</sub>与<i>H</i><sub>me</sub>之间存在较好的线性关系, 计算了塔里木河全流域冰川系统所有冰川的平衡线高度<i>ELA</i><sub>hc</sub>. 在此基础上分析流域平衡线分布特征, 探讨极限面积(<i>S</i><sub>lim</sub>)与导出雪线(<i>H</i><sub>cli</sub>)等参数同冰川系统的关系. 结果表明: 冰川系统中, 当冰川规模不低于某极限面积时, 其平衡线高度会趋近到导出雪线高度. 整个流域导出雪线高度分布受热量条件控制, 呈现纬度地带性, 又由于东西水分条件的差异, 经度地带性也较明显.
|
| [18] |
Estimating equilibrium-line altitude (ELA) from glacier inventory data .https://doi.org/10.3189/172756410790595930 URL [本文引用: 2] 摘要
ABSTRACT A glacier's most fundamental altitude is the equilibrium-line altitude (ELA) because it divides the glacier into ablation and accumulation areas. The best parameterization of the ELA for glacier inventory is the balanced-budget ELA. We discuss direct estimation of balanced-budget ELA from mass-balance data for individual glaciers, and indirect estimation of balanced-budget ELA from simple topographic parameters available from the World Glacier Inventory (WGI), i.e. the area-median and maximum and minimum altitudes. Mass balance and ELA for individual glaciers are usually strongly correlated and we calculate balanced-budget ELA from the regression equation linking the two. We then compare balanced-budget ELA with area-median and mid-range altitudes for the 94 glaciers for which we have all the necessary data. The different ELA estimates agree well enough (卤82 to 卤125 m) to describe geographical variations in ELA and for application of glacier-climate models to glacier inventory data. Mid-range and area-median altitudes are already available for tens of thousands of glaciers in the current WGI and should be evaluated in future inventories.
|
| [19] |
From Doktor Kurowski's Schneegrenze to our modern glacier equilibrium line altitude (ELA) .https://doi.org/10.5194/tc-9-2135-2015 URL [本文引用: 1] 摘要
Translated into modern terminology, Kurowski suggested in 1891 that the equilibrium line altitude (ELA) of a glacier is equal to the mean altitude of the glacier when the whole glacier is in balance between accumulation and ablation. Kurowski's method has been widely misunderstood, partly due to inappropriate use of statistical terminology by later workers, and has been little tested except by Braithwaite and M ller in a 1980 paper (for 32 glaciers). I now compare Kurowski's mean altitude with balanced-budget ELA calculated for 103 modern glaciers with measured surface mass balance data. Kurowski's mean altitude is significantly higher (at 95% level) than balanced-budget ELA for 19 outlet and 42 valley glaciers, but not significantly higher for 34 mountain glaciers. The error in Kurowski mean altitude as a predictor of balanced-budget ELA might be due to generally lower balance gradients in accumulation area compared with ablation areas for many glaciers, as suggested by several workers, but some glaciers have higher gradients, presumably due to precipitation increase with altitude. The relatively close agreement between balanced-budget ELA and mean altitude for mountain glaciers (mean error -8 m with standard deviation 59 m) may reflect smaller altitude ranges for these glaciers such that there is less room for effects of different balance gradients to manifest themselves.
|
| [20] |
Climate regime of Asian glaciers revealed by GAMDAM glacier inventory .https://doi.org/10.5194/tc-9-865-2015 URL 摘要
ABSTRACT Among meteorological elements, precipitation has a large spatial variability and less observation, particularly in high-mountain Asia, although precipitation in mountains is an important parameter for hydrological circulation. We estimated precipitation contributing to glacier mass at the median elevation of glaciers, which is presumed to be at equilibrium-line altitude (ELA) such that mass balance is zero at that elevation, by tuning adjustment parameters of precipitation. We also made comparisons between the median elevation of glaciers, including the effect of drifting snow and avalanche, and eliminated those local effects. Then, we could obtain the median elevation of glaciers depending only on climate to estimate glacier surface precipitation. The calculated precipitation contributing to glacier mass can elucidate that glaciers in arid high-mountain Asia receive less precipitation, while much precipitation makes a greater contribution to glacier mass in the Hindu Kush, the Himalayas, and the Hengduan Shan due to not only direct precipitation amount but also avalanche nourishment. We classified glaciers in high-mountain Asia into summer-accumulation type and winter-accumulation type using the summer-accumulation ratio and confirmed that summer-accumulation-type glaciers have a higher sensitivity than winter-accumulation-type glaciers.
|
| [21] |
The GAMDAM glacier inventory: A quality-controlled inventory of Asian glaciers .https://doi.org/10.5194/tc-9-849-2015 URL [本文引用: 1] 摘要
We present a new glacier inventory for the high mountain Asia named "Glacier Area Mapping for Discharge from the Asian Mountains" (GAMDAM). Glacier outlines were delineated manually using more than 226 Landsat ETM+ scenes from the period 1999-2003, in conjunction with a digital elevation model (DEM) and high-resolution Google Earth imagery. Geolocations are consistent between the Landsat imagery and DEM due to systematic radiometric and geometric corrections made by the United States Geological Survey. We performed repeated delineation tests and rigorous peer review of all scenes used in order to maintain the consistency and quality of the inventory. Our GAMDAM Glacier Inventory (GGI) includes 82776 glaciers covering a total area of 87507 卤 13126 kmin the high mountain Asia. Thus, our inventory represents a greater number (+4%) of glaciers but significantly less surface area (-31%) than a recent global glacier inventory (Randolph Glacier Inventory, RGI). The employed definition of the upper boundaries of glaciers, glacier recession since the 1970s, and misinterpretation of seasonal snow cover are likely causes of discrepancies between the inventories, though it is difficult to evaluate these effects quantitatively. The GGI will help improve the temporal consistency of the RGI, which incorporated glacier outlines from the 1970s for the Tibetan Plateau, and will provide new opportunities to study Asian glaciers.
|
| [22] |
Mass balance of a typical monsoonal temperate glacier in Hengduan Mountains Region .https://doi.org/10.11821/dlxb201509005 Magsci [本文引用: 1] 摘要
<p>玉龙雪山发育着对气候变化响应极为敏感的典型海洋型冰川。基于2008-2013年共5个物质平衡年观测数据,对玉龙雪山规模最大的白水1号冰川物质平衡特征进行分析,为评估横断山区气候和冰川变化之间的关系奠定基础。结果表明:2008-2013年白水1号冰川物质平衡最大值仅为-907 mm w.e.,最小值则达到-1872 mm w.e.。2008年冰川平衡线高度为4972 m,2009-2013年白水1号冰川积累区近乎消失。白水1号冰川积累期主要集中于10月至次年5月,6-9月为强消融期,积累量几乎为零,消融量占全年80%,属冬春季积累型冰川。2008-2009、2011-2012和2012-2013年平均物质平衡梯度为1230 mm w.e. (100 m)<sup>-1</sup>,消融期物质平衡梯度小于年物质平衡梯度,消融期初与消融期末物质平衡梯度小于100 mm w.e.(100 m)<sup>-1</sup>。</p>
横断山区典型海洋型冰川物质平衡研究 .https://doi.org/10.11821/dlxb201509005 Magsci [本文引用: 1] 摘要
<p>玉龙雪山发育着对气候变化响应极为敏感的典型海洋型冰川。基于2008-2013年共5个物质平衡年观测数据,对玉龙雪山规模最大的白水1号冰川物质平衡特征进行分析,为评估横断山区气候和冰川变化之间的关系奠定基础。结果表明:2008-2013年白水1号冰川物质平衡最大值仅为-907 mm w.e.,最小值则达到-1872 mm w.e.。2008年冰川平衡线高度为4972 m,2009-2013年白水1号冰川积累区近乎消失。白水1号冰川积累期主要集中于10月至次年5月,6-9月为强消融期,积累量几乎为零,消融量占全年80%,属冬春季积累型冰川。2008-2009、2011-2012和2012-2013年平均物质平衡梯度为1230 mm w.e. (100 m)<sup>-1</sup>,消融期物质平衡梯度小于年物质平衡梯度,消融期初与消融期末物质平衡梯度小于100 mm w.e.(100 m)<sup>-1</sup>。</p>
|
| [23] |
Determining steady-state accumulation-area ratios of outlet glaciers for application of outlets in climate reconstructions .https://doi.org/10.1016/j.quaint.2012.09.017 URL 摘要
ABSTRACT A steady-state glacier equilibrium-line altitude (ELA) can be determined by the accumulation-area ratio (AAR) method. AAR varies with climate (balance ratio) and glacier type (glacier geometry). The method involves calculating steady-state accumulation area-ratios (AAR0) from mass balance characteristics of glaciers by statistical methods. In order to confirm the application of linear regression to calculate AAR0 in the case of outlet glaciers, a method to reveal the mathematical relationship between annual net balance (bn) and AAR was developed. Analyses carried out on (bn, AAR) data sets for 14 outlet glaciers showed that the best approximation for the (bn, AAR) relationship is linear, with an average squared correlation coefficient of 0.786, but relatively strong non-linearity was detected for several glaciers. A possible explanation lies in the hypsometry of the observed glaciers. Results confirm the application of linear regression to calculation of AAR0s for outlet glaciers. An average AAR0 of 0.58 was estimated as the type-specific AAR0 for outlet glaciers.
|
| [24] |
Evaluation of the accumulation area ratio (AAR) method based on mass balance data for modern glaciers .URL 摘要
Abstract The orographic snowline estimated from glacial landforms is an important index for paleoenvironmental reconstruction. The accumulation area ratio (AAR) method has been applied to glacial landforms to calculate the altitude of the past orographic snowline. The AAR values used in previous studies were, however, not identical, suggesting that the AAR method has not yet been uniformly established. This study seeks to find an AAR value suitable for reconstructing past orographic snowline altitudes. Analyses of data for modern glaciers show a positive correlation between annual mass balances and AAR values. When the mass balances for selected glaciers are zero, the average AAR lies in the range of 59.2卤6.7%, regardless of glacier type and size. Distinct moraines formed in the past indicate a long-term steady state of glaciers. In this case, the average glacier mass balance is considered to be almost zero. Therefore past orographic snowlines can be reconstructed by applying the AAR value of 60% to glacial landforms.
|
| [25] |
Size specific steady-state accumulation-area ratio: an improvement for equilibrium-line estimation of small palaeoglaciers .https://doi.org/10.1016/j.quascirev.2010.06.033 URL 摘要
Characteristic distribution of the steady-state accumulation-area ratio (AAR 0 ) of valley and corrie glaciers was investigated in a global dataset comprised of 46 glaciers. There is a positive relationship between AAR 0 and glacier area with smaller glaciers having lower values of AAR 0 compared with larger glaciers. The relationship between glacier area (S) and steady-state AAR of studied glaciers can be optimally described by a logarithmic regression equation. This relationship is thought to be a globally valid approximation if the size of the glacier is not smaller than 10 611 km 2 . In the case of palaeoglaciers an AAR 0 value of 0.44±0.07 is best applied on glaciers with areas in the range 0.1–1km 2 , 0.54±0.07 for glaciers covering areas between 1 and 4km 2 and 0.64±0.04 for glaciers larger than 4km 2 . This assumes insignificant debris cover for the investigated palaeoglaciers. The proposed size-specific AAR 0 values take into account the geometric/hypsometric properties of (palaeo)glaciers. The results have major importance for palaeoglaciological reconstructions in many regions of former marginal/niche glaciation characterized by small former glaciers.
|
| [26] |
Unsteady state of glaciers (Chhota Shigri and Hamtah) and climate in Lahaul and Spiti region, western Himalayas: A review of recent mass loss .https://doi.org/10.1007/s12665-016-6023-5 URL 摘要
Abstract Available published literatures on glacier mass loss and climate studies like temperature and precipitation are reviewed for Lahaul and Spiti region in northern India, which is a part of the western Himalayas. Chhota Shigri and Hamtah Glaciers are both located in the Lahaul and Spiti region and have the longest record of in situ glaciological mass balance (MB) measurements. We have compiled and compared all the dataset (different methods) related to glacier change with climate in the past few decades. Both the glaciers have experienced a significant mass loss during the study period. Different methods show diverse results for the glaciers studied for the same year; however, all results depicts overall unsteady state of both the glaciers. Data of Indian Meteorological Department (IMD) shows a significant increase in average temperature for the entire country and huge variability in precipitation particularly in the state of Himachal Pradesh. Temperature and precipitation are found to be the two main governing factors controlling the glacier health in this region. Thus, it can be said that the glaciers of Lahaul and Spiti region are losing mass due to changing weather conditions, especially the increasing air temperature. However, long-term MB and climate data will give a better insight into understand and predict the future scenario of glacier health in this region.
|
| [27] |
Four decades of glacier mass balance observations in the Indian Himalaya .https://doi.org/10.1007/s10113-015-0791-4 URL 摘要
Understanding the glacier mass balance is necessary to explain the rate of shrinkage and to infer the impact of climate change. The present study provides an overview of the glacier mass balance records by glaciological, geodetic, hydrological and accumulation-area ratio (AAR) and specific mass balance relationship methods in the Indian Himalaya since 1970s. It suggests that the mass balance measurements by glaciological methods have been conducted for ten glaciers in the western Himalaya, four glaciers in the central Himalaya and one in the eastern Himalaya. Hydrological mass balance has been conducted only on Siachen Glacier from 1987 to 1991. Geodetic method has been attempted for the Lahaul–Spiti region for a short time span during 1999–2011 and Hindu Kush–Karakoram–Himalaya region from 2003 to 2008. We compared in situ specific balance data series with specific mass balance derived from AAR and specific mass balance relationship. The results derived from existing and newly presented regression model based on AAR and specific mass balance relationship induced unrealistic specific mass balance for several glaciers. We also revised AAR0 and ELA0 based on available in situ AAR and specific mass balance data series of Indian Himalayan glaciers. In general, in situ specific and cumulative specific mass balance observed over different regions of the Indian Himalayan glaciers shows mostly negative mass balance years with a few positive ones during 1974–2012. On a regional level, the geodetic studies suggest that on the whole western, the central and the eastern Himalaya experienced vast thinning during the last decade (2000s). Conversely, Karakoram region showed slight mass gain during almost similar period. However, the glaciological, hydrological and geodetic mass balance data appear to exhibit short time series bias. We therefore recommend creation of benchmark glaciers network for future research to determine the impact of climate change on the Himalayan cryosphere.
|
| [28] |
Response of glacier mass balance to climate change in the Tianshan Mountains during the second half of the twentieth century .https://doi.org/10.1007/s00382-016-3006-x URL [本文引用: 1] 摘要
We project glacier surface mass balances of the Altai Mountains over the period 2006-2100 for the representative concentration pathway (RCP) 4.5 and RCP8.5 scenarios using daily near-surface air temperature and precipitation from 12 global climate models in combination with a surface mass balance model. The results indicate that the Altai glaciers will undergo sustained mass loss throughout the 21st for both RCPs and reveal the future fate of glaciers of different sizes. By 2100, glacier area in the region will shrink by 26 10 % for RCP4.5, while it will shrink by 60 15 % for RCP8.5. According to our simulations, most disappearing glaciers are located in the western part of the Altai Mountains. For RCP4.5, all glaciers disappearing in the twenty-first century have a present-day size smaller than 5.0 km, while for RCP8.5, an additional ~7 % of glaciers in the initial size class of 5.0-10.0 kmalso vanish. We project different trends in the total meltwater discharge of the region for the two RCPs, which does not peak before 2100, with important consequences for regional water availability, particular for the semi-arid and arid regions. This further highlights the potential implications of change in the Altai glaciers on regional hydrology and environment.
|
| [29] |
The contemporary glaciers in China basedon the Second Chinese Glacier Inventory .https://doi.org/10.11821/dlxb201501001 Magsci [本文引用: 1] 摘要
<p>以2004年之后的Landsat TM/ETM+和ASTER遥感影像为基础,参考第一次中国冰川目录及其他文献资料,经过影像校正、自动解译、野外考察、人工修订、交互检查和成果审定等技术环节,完成占全国冰川总面积85.5%的现状冰川编目,确定中国目前共有冰川48571条,总面积约5.18×10<sup>4</sup>βkm<sup>2</sup>,约占全国国土面积的0.54%,冰川储量约4.3~4.7×10<sup>3</sup>βkm<sup>3</sup>。中国冰川数量和面积分别以面积<0.5βkm<sup>2</sup>的冰川和面积介于1.0~50.0βkm<sup>2</sup>的冰川为主,面积最大的冰川是音苏盖提冰川(359.05βkm<sup>2</sup>)。中国西部14座山系(高原)均有冰川分布,其中昆仑山冰川数量最多,其次是天山、念青唐古拉山、喜马拉雅山和喀喇昆仑山,这5座山系冰川数量占全国冰川总数量的72.3%;冰川面积和冰储量位列前3位的山系分别为昆仑山、念青唐古拉山和天山,尽管喀喇昆仑山冰川数量和面积均小于喜马拉雅山,但前者冰储量高于后者。从冰川海拔分布来看,海拔4500~6500βm之间是冰川集中发育区域,约占全国冰川总面积的4/5以上。冰川资源在各流域分布差异显著,东亚内流区(5Y)是中国冰川分布数量最多、面积最大的一级流域,约占全国冰川总量的2/5以上;黄河流域(5J)是冰川数量最少、规模最小的一级流域,仅有冰川164条,面积126.72βkm<sup>2</sup>。新疆和西藏的冰川面积和冰储量约占全国冰川总面积的9/10。</p>
基于第二次冰川编目的中国冰川现状 .https://doi.org/10.11821/dlxb201501001 Magsci [本文引用: 1] 摘要
<p>以2004年之后的Landsat TM/ETM+和ASTER遥感影像为基础,参考第一次中国冰川目录及其他文献资料,经过影像校正、自动解译、野外考察、人工修订、交互检查和成果审定等技术环节,完成占全国冰川总面积85.5%的现状冰川编目,确定中国目前共有冰川48571条,总面积约5.18×10<sup>4</sup>βkm<sup>2</sup>,约占全国国土面积的0.54%,冰川储量约4.3~4.7×10<sup>3</sup>βkm<sup>3</sup>。中国冰川数量和面积分别以面积<0.5βkm<sup>2</sup>的冰川和面积介于1.0~50.0βkm<sup>2</sup>的冰川为主,面积最大的冰川是音苏盖提冰川(359.05βkm<sup>2</sup>)。中国西部14座山系(高原)均有冰川分布,其中昆仑山冰川数量最多,其次是天山、念青唐古拉山、喜马拉雅山和喀喇昆仑山,这5座山系冰川数量占全国冰川总数量的72.3%;冰川面积和冰储量位列前3位的山系分别为昆仑山、念青唐古拉山和天山,尽管喀喇昆仑山冰川数量和面积均小于喜马拉雅山,但前者冰储量高于后者。从冰川海拔分布来看,海拔4500~6500βm之间是冰川集中发育区域,约占全国冰川总面积的4/5以上。冰川资源在各流域分布差异显著,东亚内流区(5Y)是中国冰川分布数量最多、面积最大的一级流域,约占全国冰川总量的2/5以上;黄河流域(5J)是冰川数量最少、规模最小的一级流域,仅有冰川164条,面积126.72βkm<sup>2</sup>。新疆和西藏的冰川面积和冰储量约占全国冰川总面积的9/10。</p>
|
| [30] |
The second Chinese glacier inventory: data, methods andresults .https://doi.org/10.3189/2015JoG14J209 URL [本文引用: 1] 摘要
The second Chinese glacier inventory was compiled based on 218 Landsat TM/ETM+ scenes acquired mainly during 2006-10. The widely used band ratio segmentation method was applied as the first step in delineating glacier outlines, and then intensive manual improvements were performed. The Shuttle Radar Topography Mission digital elevation model was used to derive altitudinal attributes of glaciers. The boundaries of some glaciers measured by real-time kinematic differential GPS or digitized from high-resolution images were used as references to validate the accuracy of the methods used to delineate glaciers, which resulted in positioning errors of +/- 10 m for manually improved clean-ice outlines and +/- 30 m for manually digitized outlines of debris-covered parts. The glacier area error of the compiled inventory, evaluated using these two positioning accuracies, was +/- 3.2%. The compiled parts of the new inventory have a total area of 43 087 km(2), in which 1723 glaciers were covered by debris, with a total debris-covered area of 1494 km(2). The area of uncompiled glaciers from the digitized first Chinese glacier inventory is similar to 8753 km(2), mainly distributed in the southeastern Tibetan Plateau, where no images of acceptable quality for glacier outline delineation can be found during 2006-10.
|
| [31] |
Estimation on the response of glaciers in China to the globalwarming in the 21st century .https://doi.org/10.1007/BF02886048 URL [本文引用: 5] 摘要
正 Glaciers in China can be categorized into 3 types, i.e. the maritime (temperate) type, sub-continental (sub-polar) type and extreme Continental (polar) type, which take 22%, 46% and 32% of the total existing glacier area (59 406 km2) respectively. Researches indicate that glaciers of the three types show different response patterns to the global warming. Since the Maxima of the Little Ice Age (the 17th century), air temperature has risen at a magnitude of 1.3℃on average and the glacier area decreased corresponds to 20% of the present total glacier area in western China. it is estimated that air temperature rise in the 2030s, 2070s and 2100s will be of the order of 0.4-1.2, 1.2-2.7 and 2.1-4.0 K in western China. With these scenarios, glaciers in China will suffer from further shrinkage by 12%, 28% and 45% by the 2030s, 2070s and 2100s. The uncertainties may account for 30%-67% in 2100 in China.
|
| [32] |
Glacier water resources in china .中国冰川水资源 . |
| [33] |
Advances and problems on Qinghai-Xizang Plateau meteorology research .
<p>分高原天气学、高原气候学、高原及邻近地区的大气环流、以及高原数值预报和模拟四方面简要回顾了新中国成立以来我国(也兼及国外)青藏高原气象学的主要进展,也提出今后研究中应注意的有关问题。</p>
青藏高原气象学的研究进展和问题 .
<p>分高原天气学、高原气候学、高原及邻近地区的大气环流、以及高原数值预报和模拟四方面简要回顾了新中国成立以来我国(也兼及国外)青藏高原气象学的主要进展,也提出今后研究中应注意的有关问题。</p>
|
| [34] |
Barrier-corridor effect of longitudinal range-gorge terrain on monsoons in Southwest China .
地形格局对大气环流与区域气候具有重要影响。已有研究认为纵向岭谷区主要受到印度洋季风与太平洋季风的共同影响,二者在哀牢山山脉附近交汇,哀牢山山脉是一条重要的地理分界线。本文从大气环流、水汽输送、区域气候、河川径流以及植物稳定氧同位素等多个方面研究发现:纵向岭谷地区主要受印度洋季风的影响,太平洋季风的影响在8月份有一定的作用,但不够明显;在地形格局作用下,地表水汽、降水以及河川径流在纵向岭谷区表现出明显的纬向差异、经向延伸的特征;大流环流、水汽输送、区域气候以及河川径流等的空间差异,是特殊环境对水热再分配的结果,即"通道-阻隔"作用的效应;这些差异不是地理地带性的表现,而是非地带性作用的结果;这种"通道—阻隔"作用导致地表水热条件的再分配,是该区生态地理格局形成与演化的主驱动力之一。纵向岭谷地形对季风的"通道—阻隔"作用导致了一系列地理要素的空间分异和相关联的生态效应。
西南纵向岭谷地形对季风的“通道—阻隔”作用 .
地形格局对大气环流与区域气候具有重要影响。已有研究认为纵向岭谷区主要受到印度洋季风与太平洋季风的共同影响,二者在哀牢山山脉附近交汇,哀牢山山脉是一条重要的地理分界线。本文从大气环流、水汽输送、区域气候、河川径流以及植物稳定氧同位素等多个方面研究发现:纵向岭谷地区主要受印度洋季风的影响,太平洋季风的影响在8月份有一定的作用,但不够明显;在地形格局作用下,地表水汽、降水以及河川径流在纵向岭谷区表现出明显的纬向差异、经向延伸的特征;大流环流、水汽输送、区域气候以及河川径流等的空间差异,是特殊环境对水热再分配的结果,即"通道-阻隔"作用的效应;这些差异不是地理地带性的表现,而是非地带性作用的结果;这种"通道—阻隔"作用导致地表水热条件的再分配,是该区生态地理格局形成与演化的主驱动力之一。纵向岭谷地形对季风的"通道—阻隔"作用导致了一系列地理要素的空间分异和相关联的生态效应。
|
| [35] |
Variations in equilibrium line altitude of the Qiyi Glacier, Qilian Mountains, over the past 50 years . |
| [36] |
The basic characteristics of modern glaciers in China .https://doi.org/10.11821/xb196403001 URL [本文引用: 1] 摘要
中国西部具有世界上最高最大的山地和高原,提供了冰川发育的有利条件,成为世界上山岳冰川最发达的国家。这些冰川一方面构成流入太平洋和印度洋的许多大河的源头,一方面以其融水灌溉西北内陆干旱地区,成为干旱区农业赖以发展的主要条件之一。
中国现代冰川的基本特征 .https://doi.org/10.11821/xb196403001 URL [本文引用: 1] 摘要
中国西部具有世界上最高最大的山地和高原,提供了冰川发育的有利条件,成为世界上山岳冰川最发达的国家。这些冰川一方面构成流入太平洋和印度洋的许多大河的源头,一方面以其融水灌溉西北内陆干旱地区,成为干旱区农业赖以发展的主要条件之一。
|
| [37] |
Charateristic of spatial transportation of water vapor for Northwest China's rainfall in spring and summer .
运用1960-1997年内NCEP/NCAR的格点为2.5°×2.5°多个再分析气象要素资料以及西北地区95个加密测站降水资料,通过相关分析、合成分析等诊断方法对影响西北地区春、夏季降水的整层大气的水汽水平输送特征、各层水汽垂直输送特征以及西北地区春、夏季各个边界区域水汽输送特征进行了系列研究,揭示了西北地区季节性降水的水汽源以及水汽源三维输送路径特征;同时阐述了西北地区季节性降水与同期空中水汽含量显著性相关的原因。并用西北地区干、湿年份相关气象要素场对本文的一些分析结果进行了验证。
西北地区春, 夏季降水的水汽输送特征 .
运用1960-1997年内NCEP/NCAR的格点为2.5°×2.5°多个再分析气象要素资料以及西北地区95个加密测站降水资料,通过相关分析、合成分析等诊断方法对影响西北地区春、夏季降水的整层大气的水汽水平输送特征、各层水汽垂直输送特征以及西北地区春、夏季各个边界区域水汽输送特征进行了系列研究,揭示了西北地区季节性降水的水汽源以及水汽源三维输送路径特征;同时阐述了西北地区季节性降水与同期空中水汽含量显著性相关的原因。并用西北地区干、湿年份相关气象要素场对本文的一些分析结果进行了验证。
|
| [38] |
Accumulation and moisture sources of the glaciers in China .
利用冰川编目数据和NCEP/NCAR再分析资料,对中国及周边地区水汽通量、中国冰川地理分布情况、大气环流途径和降水分布进行分析,发现中国冰川水汽来源复杂,不同地区各季节存在不同的大气环流控制.这说明不同地理位置的冰川所指示的气候信息是不同的,大约以30°N和100°E为界,中国西北部主要受西风环流影响,冰川发育的水汽主要源于西风环流.以横断山脉为界,横断山脉以西,即30°N以南和100°E以西的区域,主要受印度季风控制,冰川发育水汽主要源于印度洋、阿拉伯海和孟加拉湾;横断山脉以东区域,受东亚季风控制,冰川发育水汽主要来源于太平洋和南海;横断山脉、念青唐古拉和青藏高原东部地区受印度季风和东亚季风共同控制,冰川发育水汽主要来源于孟加拉湾和南海.不同地区冰芯积累量的变化与该地区夏季季风环流指数的变化具有较好的一致性.
中国冰川积累与水汽来源补给分析 .
利用冰川编目数据和NCEP/NCAR再分析资料,对中国及周边地区水汽通量、中国冰川地理分布情况、大气环流途径和降水分布进行分析,发现中国冰川水汽来源复杂,不同地区各季节存在不同的大气环流控制.这说明不同地理位置的冰川所指示的气候信息是不同的,大约以30°N和100°E为界,中国西北部主要受西风环流影响,冰川发育的水汽主要源于西风环流.以横断山脉为界,横断山脉以西,即30°N以南和100°E以西的区域,主要受印度季风控制,冰川发育水汽主要源于印度洋、阿拉伯海和孟加拉湾;横断山脉以东区域,受东亚季风控制,冰川发育水汽主要来源于太平洋和南海;横断山脉、念青唐古拉和青藏高原东部地区受印度季风和东亚季风共同控制,冰川发育水汽主要来源于孟加拉湾和南海.不同地区冰芯积累量的变化与该地区夏季季风环流指数的变化具有较好的一致性.
|

/
| 〈 |
|
〉 |